variation
variation-dispersion : sprend
MTH 108 - Measures of variation 215/25
LO calculate, interpret, and describe the resistance of range • Range: difference between the __________maximum and
___minimum_______ value.
• Properties of the range
• It is very sensitive to extreme values. The range is not
__________________resistant
• Range does not consider every value. Cannot truly reflect variation among values.
LO calculate, interpret, and describe the resistance of variance
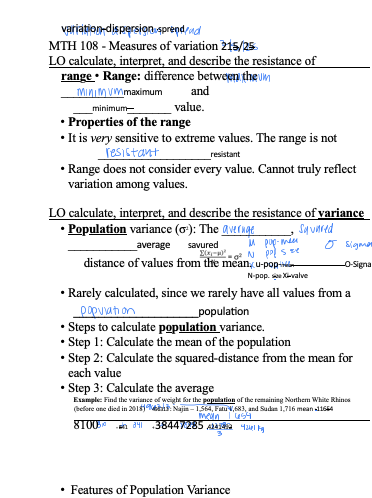
• Population variance (σ2): The ___________, ___________average savured
distance of values from the mean. u-pop-mean O-Signa
N-pop. size Xi-valve
• Rarely calculated, since we rarely have all values from a
____________________population
• Steps to calculate population variance.
• Step 1: Calculate the mean of the population
• Step 2: Calculate the squared-distance from the mean for each value
• Step 3: Calculate the average
Example: Find the variance of weight for the population of the remaining Northern White Rhinos (before one died in 2018) 496313 : Najin – 1,564, Fatu 1,683, and Sudan 1,716 mean = 11654
8100 + 841 + 38447285 : 4241492
• Features of Population Variance
• Never negative | Zero when all values are the same |
Variance is in the squared units of the original values |
Very sensitive to outliers (not resistant)
• Sample variance is calculated in the same way, except that the denominator is n – 1 *S== X-barsample=variancesample menu
• n-1 in the denominator makes the ___________ sample variance a less biased estimate of ____________population variance because we are also estimating the mean (). Accounts for more uncertainty. 4 48
- 2 02 404
Example: calculate the sample variance for the height (cm) of students in a class, if you only have these measurements:
LO calculate, interpret, and describe the resistance of standard
deviation S =+
Standard deviation is the square root of __________________.variance
• Sample standard deviation (s) is the most reported measure of variation because it is in the same ____________ as theunits original observations.
Example. In the California Health Interview Survey, randomly selected adults are interviewed. One of the questions asks how many cigarettes are smoked per day, and results are listed below for 5 randomly selected respondents. Find the standard deviation of number of cigarette smoked per day? 0, 2, 4, 6, 0.4
• Important Properties of s: Never negative | Zero when all values are the same | | Very sensitive to outliers (not resistant)| In the same units of the original values Sample vs population notation
PopulationSample
Size Nn
-Mean
--Standard DeviationVariance
LO calculate, interpret, and describe the resistance of coefficient of variation
• Coefficient of variation = CV = sample : CV =- or population : CV=
• Coefficient of variation is a unit-free measurement of variation.
• Can compare deviations between any two datasets with different units and means.
Example. Compare the variation of pulse rates and the heights for the same 153 students. For the student pulse rates, = 62.5 BPM and s = 10 BPM; for their heights, x = 175 cm and s = 7 cm. Note that we want to compare variation among pulse rates to variation among heights.
LO construct and interpret boxplots using the median and IQR
• Five Number Summary IQR : Q3-Q ,
• minimum ↳S interquartile range
• quartile -resistant toout
liers
• median
• quartile 3
• maximum
• ________________ Outliers are data points that significantly deviate from the other observations in a dataset
• Potential causes: human error, measurement error, or a true anomaly within the population being studied.
• R defines “outliers” as observations above Q3 + 1.5 x IQR or below Q1 – 1.5 x IQR
Example. Suppose we have the following set of data: 1, 3, 4, 6, 7, 7, 8, 8, 10, 12, 17. The five number summary for this data set is minimum = 1, first quartile = 4, median = 7, third quartile = 10 and maximum = 17. We may look at the data and say that 20 is an outlier. But what does our interquartile range rule say?