Econs
Economics is the study of the ways individuals and society decide to use scare/limited resources to satisfy their unlimited needs and wants
Micro
Focuses on the decisions of individual, households, firms and industry
Ceteris Paribus - all other things constant [everything else stays the same except for the change]
Economic Problem - limited resources to satisfy unlimited needs and wants
Opportunity Cost - next best alternative forgone
Questions when Decision making:
What to produce?
How to produce?
How much to produce?
Whom to produce for?
PPF - possible combinations of goods/services that can be produced
Consumer Good: immediate goods
Capital Good: investments to increase economy
Assumptions of PPF:
Resources are fixed
Economy is operating at max capacity and resources are utilised efficiently
Technology is fixed
There are only 2 types of goods
Points on PPF:
If inside PPF the economy isn’t maximised and resources aren’t being allocated effectively
If outside PPF it is an impossible point as resources are already maximised with current resources so there isn’t a possibility to reach that point without a change
If on curve economy is maximised
Market
Market Economy | Planned Economy | |
Definition | An economy that allocates resources primarily through the interaction of individuals and firms | Economic system run by central authorities rather than market participants |
Ownership | Producer | Central Authorities |
Decision Making | Decentralised | Centralised |
Incentives | Profit | N/A |
Price & Wages | Producers and Market | Central Authorities |
Income Distribution | Wider disparity or income inequality | Smaller income inequality [gov control] |
Personal Freedom | Large amount of freedom to produce and consume | minimal freedom to produce and consume |
Consumer Choice | Many diverse choices available in market | Limited choices given by central authorities |
Examples | Australia | North Korea |
A market is where buyers and sellers exchange goods & services & resources
Product Market | Factor Market | |
Definition | Marketplace in which a final good or service is bought or sold | Market where factors of production are bought or sold |
Who Demand | Consumers | Producers |
Who Supply | Producers | Consumers and Producers |
What is sold/bought | Good/services | CELL |
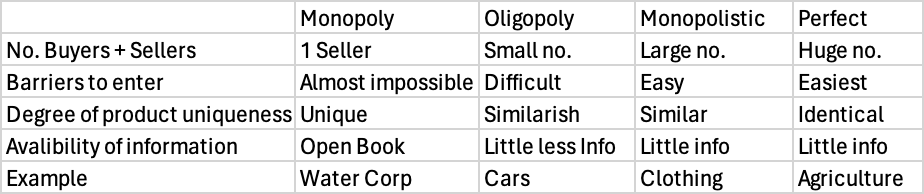
Classification of Competition:
no. of firms
degree of similarity in product
ease of entry and exit
no. of buyers and sellers
Competitive: Interaction between buyers and sellers where sellers are the price takers e.g. pasta
Non-Competitive: Little to no competition where sellers are price makers e.g. watercorp
Demand: Buying intentions of consumers where they are willing and able to buy at a particular price at the time
Law of demand: as price increases, demand decreases, vice versa
Inverse relationship
Income effect: price ↑, demand ↓ because of ↓ in purchasing power
Substitution effect: price of one good ↑, other goods become more attractive
Normal goods | Inferior goods | |
Definition | one where demand increases as income increases (most goods in the economy) | Good where demand decreases as income rises |
Example | ice cream | Home Brand (woolies) |
↑ in disposable income | Increase in demand | Decrease in demand |
Substitute goods | Complementary Goods | |
Definition | Pairs of goods that are used in place of each other | Goods that are purchased & used together |
Example | Sausage or Burger | Computer & computer program |
Situation | Price of burgers rise people will buy sausages instead | Price rises for computer less people will buy both |
Price Factors (Movement)
increase in price: contraction
decrease in price: expansion
Non-Price Factors (Shifts) [increase and decrease]
Level of disposable income - income increases, demand increases
Price of related goods - substitute goods at lower price people buy it instead
Interest rates - low rates means more spending or borrowing
Number of buyers - ads, wealth and health impact buyers
Taste/Trends/Consumer preference - taste change, demand change
Consumer expectations - expectation that price ↑ in future, demand ↑
Supply: Quantity producers are willing and able to produce at a particular price at a time
Law of Supply: as price increases supply increase, vice versa
Proportional relationship
Individual Supply | Market Supply | |
Definition | Supply of a singular producer | Supply of all producers in market |
Example | Ice cream from a particular producer | All supply of ice cream |
Price Factors (Movement)
increase in price: expansion
decrease in price: contraction
Non-Price Factors (Shifts) [increase and decrease]
Input price/Cost of production - increase in cost decrease in supply
Technology - improvement in tech, decrease cost, increase supply
Expectations - increase in price in future = decrease in current supply
No. of sellers - increase in sellers = increase in supply
Market Equilibrium: occurs when consumers and producers come together and exchange a mutually agreeable quantity at a mutually agreeable price
Shortage - price is lower than the =
Surplus - price is above the =
Price Mechanism: Adam Smith, father of Economics, talked about how free markets can motivate individuals, acting in their own self-interest, to produce what is societally necessary aka the invisible hand or price mechanism.
Elasticity
Finding Elasticity Equations
The Point Method
(ΔQ/Qi) / (ΔP/Pi)
%ΔQ/%ΔP
The Midpoint Method
(ΔQ/Qav) x (Pav/ΔP)
PED: Measure of how demand reacts to change in price
Price Elasticity of Demand: shift is demand for a good or service when changes happen on a variable that consumers consider apart of purchasing decision
Businesses and the Government follow PED as it is an indicator to price
PED Value | Name | Situation to price change |
PED = 0 | Perfectly inelastic | No reaction - demand doesn’t change |
PED < 1 | Relatively inelastic | Minimal reaction - small change in QD |
PED = 1 | Unitary elastic | Equal reaction - change price = change quantity |
PED > 1 | Relatively elastic | Large reaction - change in price < change in quantity |
PED = infinity | Perfectly elastic | Infinite reaction - price doesn’t change |
Factors affecting PED
Necessities |
|
No. Substitutes |
|
Habits formed |
|
Time to react |
|
Definition of Market |
|
Income Spent |
|
Complementary Good |
|
PES: change in supply relative to change in price
PES Value | Name | Situation to price change |
PES = 0 | Perfectly inelastic | No reaction - demand doesn’t change |
PES < 1 | Relatively inelastic | Minimal reaction - small change in QS |
PES = 1 | Unitary elastic | Equal reaction - change price = change quantity |
PES > 1 | Relatively elastic | Large reaction - change in price < change in quantity |
PES = infinity | Perfectly elastic | Infinite reaction - price doesn’t change |
Factors affecting PES
Time |
|
Nature of Industry |
|
Ability to store inventory |
|
Government Taxing
Elastic goods are unlikely to be taxed compared to inelastic goods due to revenue
Elastic goods cause Producer Tax index - producers taking on the burden of tax
Inelastic goods cause Consumer Tax index - consumers taking on the burden of tax
DWL (dead weight loss) is causes by tax as it is a loss of max efficiency which was avoidable
TS (total surplus) is decreased with tax as CS [consumer surplus] and/or PS [producer surplus] decrease
Governments tax to increase revenue
Price discrimination
Businesses change their prices for different times/groups for customers
Women haircuts > Men haircuts
Uber at night > Uber at day
Market Efficiency
Producing goods/services that are desirable to consumers at lowest cost
Not possible to make someone better off without making someone worse off
Utilising scarce resources to make best possible decisions
All information is included in price so market isn’t overvalued or undervalued
Marginal Benefit: Max price consumers willing to pay for an additional good
decreases as more goods are added as enjoyment/benefit decreases
Can also be known as the price in demand curve
Marginal Cost: Min amount producer willing to sell for additional cost for + unit
Increases as more units are made
MC > Price producers will stop supplying
Consumer Surplus: Max amount consumer willing to pay vs what they pay
CS > CE (consumer expenditure) increase in consumer welfare
Max - actual
Producer Surplus: Min amount producers are willing to accept vs what they receive
$ ↑, PS ↑
PS > Cost of Production, ↑ economic welfare
Total Surplus: Measure of economic efficiency
TS = TPS + TCS
TPS = ½ (Actual - min) x Q
TCS = ½ (Max - actual) x Q
Deadweight Loss: avoidable decrease in TS, preventing production of optimal output
If market has DWL it is failing
Government Policies in Reducing Efficiency
Government reduces market efficiency to trade off for social benefit, equity and much more
Market Restrictions
Limits supply
Taxi licenses
→ reduce congestion and pollution
Price Control
Price Ceiling
→ Maximum price below equilibrium to protect consumers
→ Medicine
→ Rent
Price Floor
→ Minimum price above equilibrium to protect suppliers from sellers
→ Milk
Taxes
Raise revenue for government to improve efficiency of economy
Tax is added to supply such as cigarettes
GST
Subsidies
A cash payment from government to business to encourage the production of goods an services (grant to firms)
→ shift to right as it reduces cost of production
Reduce pressure to improve efficiency in future
Market Failure
Occurs when resources aren’t allocated efficiently (TS isn’t maximised)
Government intervention:
Improve efficiency
Influence the nature of price
Respond to fluctuation in economic growth
Types of Market Failure
Market Power
only seller
price setters
product differentiation
Government intervention
→ ACCC prohibits price fixing and collusions [consumer law]
→ collusions reduce competition and increase profit
→ legislate, regulate
Externality
when there are costs or benefits imposed on a third party that is not involved with the economic transaction
Private cost: cost incurred by producer and consumer
Social cost: cost on third party external to price mechanism
Private benefit: benefits reaped by producer and consumer
Social benefit: benefit society has, external to price mechanism
Within the 2 different types of externality it further splits into consumption and production externalities
Negative Externality
→ Production or consumption of a good or service that indirectly causes harm to third party e.g. smoking or pollution
→ Causes overconsumption and overproduction impacting peoples health through secondhand smoke and it harms the environment with ↑ CO2
→ PC<SC
→ Government intervenes with 2 types of policies:
Market Based
→ Taxing CO2
→ Taxing Cigarettes by certain percent each year
Command and Control
→ Regulating what age, demographic and groups can use product
→ Banning where product can be used
Positive Externality
→ Production or consumption of a good or service that indirectly benefits a third party e.g. beekeepers or vaccines
→ There is underconsumption and underproduction as the market is unable to see the benefits to third parties such as herd immunity and pollination
→ PB<SB
→ Government intervenes with 2 types of polices:
Market based
→ Subsidising the cost of production to producers to increase production
Command and Control
→ Making it mandatory for certain ages, demographics and people to have it
→ Prioritising the licenses needed
Characteristics of goods
Rival Goods: by using good/service it effects other people using good or service
Excludable Goods: good can only be used by person who bought
Public Goods
→ Non-rival, non-excludable
→ Parks
→ private firms refuse to pay for these goods as they can’t be monetised and there is no profit from it
→ Governments pay for these goods as they benefit society
→ Problem with it is there are free riders who don’t contribute to the good but take advantage of it
Private Goods
→ Excludable, Rival
→ Household goods
→ People go buy things at the shop which cannot be used by others as they own the item
→ By buying the item it reduces the stock for others
Club Goods
→ Excludable, non-rival
→ Netflix
→ People buy good that others can’t use as it is theirs
→ By someone purchasing good it does not impact another purchasing good as their isn’t a set supply
→ Government can allow companies to set price above marginal cost levels
Common Resources
→ Rival, non-excludable
→ Ocean - fishing
→ Tragedy of the commons
→ Fish are free to get from the ocean but people become greedy and take more it will deplete the population of fish meaning others can’t take the same amount
→ Governments restrict the time, area and amount of fish people can take to protect the species and make sure there will be some in the future
→ There are people who disregard these laws made and it negatively impacts others
Macro
Focuses on total economic activity and performance on a whole
What it includes:
GDP [gross domestic production] - target rate of 3.5%
Price Stability
Measured with CPI
Inflation should rise by 2-3% each year
Unemployment rate - 4-5%
Equitable income distribution
Measured using Gini coefficient in Lorenz curve
Efficient resource allocation
Maximising output to achieve allocative/production efficiency
Aggregate Demand
Total amount spent in economy over a particular time period
Aggregate Supply
Total value of final goods+services produced over a period
Participants in economy
Households
Firms
Government
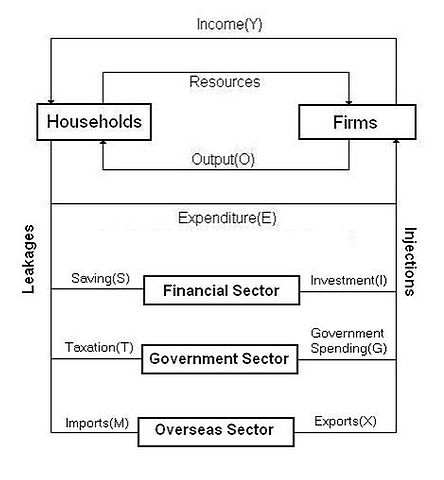
Circular Flow of Income
Basic Circular Flow Assumptions:
households spend all income
all output is sold
no savings
no government or overseas sectors
Circular Flow Assumptions:
Financial Sector
businesses can only invest and borrow while households can only save
investments are capital goods
banks attract surplus funds from savers by offering interest rates and make funds to borrowers at high rates
Government Sector
gov employs approx. 20% of workforce
taxes improve social welfare
Overseas Sector
drives economic growth around world
exports - purchase of goods and services from other countries
2 Flows
Real Flow - movement of physical resources from HH to firms
Money Flow - flow of [E , S , I , T , G , X , M]
Markets
Factor/resource - Resources sold by HH to firms
Product - goods + services sold by firms to HH
Financial - lenders/savers/borrowers meet at bank
Overseas - trade
Economic activity measured
Aggregate Output - value of real flow leaving firms
Aggregate Income - value of money flow entering HH
Aggregate Spending - value of money flow entering firms {C+I+G+(X-M)}
Equilibrium
Level of economic activity is stable
TL = TI [S+T+M = I+G+X]
No change in activity
Disequilibrium
Income and expenditure is impacted by L and I
TL > TI , AI decreases, C decreases, economy slows
TI > TL , AI increases, C increases, economy increases
Impact
TL > TI output will decrease, employment will decrease, less jobs being occupied causes economy to fall as less is being bought as income has decreased, this causes a contraction in the economy
TI > TL employment will increase, output will increase, more jobs being occupied causes a boost in the economy as more people are having a higher income which causes more to be consumed which causes an expansion in the economy
Adjustments
increase in injection leads to an increase to adjustments reaching increase in income I > L
increase in leakages leads to adjustments decreasing income L > I
creates a new equilibrium
equilibrium is a theoretical concept [ Y = C + S ] because income can only be used for spending or saving
Aggregate Expenditure
AE = C + I + G + (X - M) = GDP
Total spending in economy
Aggregate Demand
We study the change in level and why they vary so economic activity can be explained snd managed
Total amount spent in economy over a particular time period
Consumption: Total spending on goods and services by HH
Composition in AE is 55%
3 Types of Goods and Services
Durable {15% composition}
used for 3+ years e.g. washing machine
Non-durable {35% composition}
short period of time e.g. milk
Services {55% composition}
can’t touch product e.g. insurance
5 Factors Affecting C
Disposable income
increase in disposable income leads to increase in consumption as people are more willing to more make purchases as there is less financial burden
Cost of Credit and Availability of Credit
increase in interest rates means a decrease in consumption as people are saving more and less borrowing is occurring
Stock of Personal Wealth
assets on hand [e.g. house] increase, people spend less frugally
Expectations
expected increase in income people are more willing to spend more increasing consumption
Government Policy
Fiscal Policy
if government want so increase EG they use expansionary fiscal policy by decreasing taxes to increase spending
Income: Income available to an individual after payment of tax
Government Expenditure: Total spending on goods and services by government at local, state and federal levels
Composition in AE is 25%
Government injects around $400 bn every year to overcome the impact COVID had
2 Types of Gov Spending
G1: day to day spending that has to happen e.g. schools, healthcare
G2: expenditure to stabilise the business cycle e.g. investment
Decided Upon by Budget
Structural Expenditure
allocative expenditure, providing public resources to transfer to households to provide social security e.g. schools
Cyclical Expenditure
changes with the business cycles
2 Factors Affecting Gov Spending
Where we are in the business cycle
economy in trough, expansionary fiscal policy, increase in eg
economy in boom, contractionary fiscal policy, decrease in eg
Political Ideology
Labour: increases government spending
Liberal: decrease government spending
Depends on different party in power
Net Exports: Income earned by exports minus the imports spending
Composition in AE is -3% to 5%
Trade Balance
Either deficit or surplus
Currently Surplus [E>M]
4 Factors Affecting Net Exports
Where we are in the business cycle
upswing/boom, increase in Y, M elastic, trade deficit
downswing/trough, decrease in Y, M inelastic, trade surplus
The business cycle for business partners
trading partners increase, exports increase, trade surplus
vise versa
Exchange Rate
dollar value increases, X decreases, M increase, trade deficit
vise versa [deprecates]
Terms of Trade
ratio of export price to import price
TOT increase, trade balance improves
Private Investment Expenditure: Purchase of capital/investment by firms to increase ability to produce output
Composition in AE is 16% to 25%
Planned Investment
Spending on producer or capital goods that are used by businesses to produce final goods and services
Fixed investment: equipment, buildings, construction
Residential fixed investment: new housing
Working Capital: stocks and inventory
Refers to change in capital stock
When businesses change the level of planned investment all other equal things AE and AD changes creating a new equilibrium
5 Factors Affecting Investment
Degree of Uncertainty
as it increases firms are less likely to invest [political, overseas, change in tastes]
Real rate of Interest
Real Rate of Interest excludes inflation and shows firms the real value of money that needs to be paid back based on the base year it can be found [nominal rate of interest - inflation]
increase in real rate of interest, investment becomes expensive and less profitable meaning there will be a decrease in investment
Business Expectations/Confidence
confidence in economy increases, investments increases
Profit Levels of the Business
increase in profit, increase in investment
Government Policies such as Fiscal Policy
changes in taxes and gov spending can incentivise firms how to invest
decrease in taxes leads to increase in investment
Economic Growth
Increasing the capacity of an economy to satisfy the growing needs and wants of the population
GDP in the Circular Flow of Income
Market value of output = spending = income received = wages = profit
Resources match money so we can track what is going on (equal and opposite)
all output is sold at market price (market value = spending)
total spending = total income
total output = total spending = total income (measure of value of GDP)
GDP
Market value of all final goods and services produced within a period of time in an economy
includes stock regardless if sold or not as it is produced
AE = GDP = C + I + G + (X - M)
C: HH [including rent]
I: inventories
G: transfer of money between groups
(X - M): net value of exports - import
Benchmark to compare country size and productivity
Can add up all the total output of all businesses to measure
O: 84% of GDP is services and manufacturing is declining
Y: allows us to see if living standards are increasing as it shows GDP per Person
also shows where the money is going
2 sides to transaction
capital gain/losses are not counted
PPF
Moving along curve shows opportunity cost as an increase production of consumer goods, decrease in capital goods [vice versa]
Shift outwards demonstrates economic growth as there is a increase in potential output e.g. increase in resources or technology
APF [Aggregate Production Frontier]
The relationship between input and GDP
Total production in economy
Shows efficiency of economy by measuring the output per input
Increasing the input does not increase the output per input, it moves along the curve
When efficiency increases output increases per input and the APF model moves upwards e.g. technology has improved
Proportional relationship between output and input [other factors are constant]
Determines max quantities
Changes in production are subject to the law of marginal returns
Law of Diminishing Returns
an additional amount of a single factor of production will result in a decreasing marginal output of production [other factors are constant]
Capital widening when the efficiency is maintaining an increase in economic activity aka consumer spending
Capital deepening when efficiency increase, economic growth increases due to an increase in supply
Limitations of GDP
Prices are not the value
GDP is the market value but things are constantly sold below the value so GDP is greater than what it actually should be
Non-market activities [HH] production not included
GDP only measures what market goods and services that are sold which excludes HH work like laundry ect.
Shadow economy is missing
Excludes off the book work like babysitting and excludes illegal activities such as the black market
Environmental Damage
Pollution is ignored and natural resources have no value
Leisure doesn’t count
Increase in work, increase in money, decrease in quality of life as leisure decreases
GDP ignores distribution
Views income as the same for everyone ignoring some are better and worse off
Measure of Living Standards
GDP per person measures average income of a country, increase incomes, increases investing to education, healthcare, etc
Real and Nominal GDP
Nominal is GDP in todays prices (total production at market value)
Inflation makes GDP increase even when the actual production hasn’t changed and same amount is produced
Real is GDP is constant prices
Inflation is excluded
GDP due to change in output [isolates economic growth]
Measures change in production
When we use 1 year price to calculate it is called the base year
Economists adjust nominal GDP for price changes to obtain a measure of real GDP, they ‘deflate’ nominal GDP using price index
Equations
Real GDP (YR 2+) = NGDP 2 x (CPI 1 / CPI 2)
%ΔGDP = [(GDP2 - GDP1) / GDP1] x 100
Real Rate % = %ΔGDP - CPI%
%ΔNGDP = %ΔRGDP + %Δincome
GDP per Capita = RGDP/population = $ per person
Factors Contributing to Economic Growth
Potential rate of economic growth over time is determined by the stock of natural, human and capital resources used to produce [qualitative and quantitive]
Depends on willingness to buy goods/services
Illustrated with APF
Benefits of Growth
Material living standards increase
higher goods and services
higher income
higher employment
creates further growth via multiplier k
Fiscal dividend
rise in output
income and spending increases, tax payments used to improve public and merit goods and services
Cost of Growth
Inflation risk: AD > AS
Environmental concerns: air quality
Damage to Social Welfare: excess consumption increases
Income and wealth inequality
Structural changes + structural unemployment: may become overly dependent on one sector
Source of Economic Growth
Sustained economic growth must come from demand side and supply side
D economic activity can increase by:
Fiscal Policy
Monetary Policy - RBA reduces interest rates to increase consumption and investment
S economic activity can increase by:
Increasing use of resources
Finding better resources
Use resources more efficiently
Make labour more productive via capital
Invest in human capital
Increase education and training makes labour force more efficient, motivated, skilled and productive
Relation Between AD and Economic Growth
AD and AS need to increase to achieve economic growth
without AD
investments are low
depreciation in capital stock
lower levels of tax revenue
decrease in labour force
fall in international competitiveness
Inflation
Unemployment
Business Cycle
Income Distribution
Government redistributes income to support and maintain a minimum standard of living (40% of spending/budget used)
Role of Government in a Modified Market Economy
Provision of goods and service
Provide without profit
Private firms have no incentive so govt takes over providing these as they benefit people
Street lamps, education, healthcare
Redistribution of Income
The government uses progressive tax (personal income tax) to redistribute income within the country
Income can be redistributed while wealth can't really (Inheritance cannot be taxed in Australia)
The higher income earners take majority of the burden with the highest tax bracket being $190K and up with it claim a ≅ 45% of income
The government then uses this for welfare such as jobseeker
Regulation of Business Enterprise
ACCC - Australian consumer act, ceilings and floors
Used to have fair competition and protect consumers (rules against anti-competition)
Macroeconomic Management
Fiscal policy is used by the government to increase or decrease the flow of money in the economy by either increasing or decreasing taxes and spending
This was introduced in the 1940s to help with the fluctuation in the business cycle
Redistributive Role
Welfare benefits (pension/jobseeker)
Progressive taxes
Provision of essential goods/services
Public housing, education, healthcare
Reduces burden on people, leaving more for spending on discretionary goods
Compulsory Superannuation
Employers are required to put a % of income into a superannuation account which employees can access when they are over the age of 67.
This improves equity and allows elders to have a decent living standard when they retire
Causes of Income Inequality
- Mobility of Labour
- Ease of movement between occupations or geographic regions
- Primary Labour Market
- Little to no likelihood of unemployment e.g. doctor
- Secondary Labour Market
- Frequent unemployment, casual employment and low/declining wages e.g. waiter
- Relative Poverty
- Situation where income/lifestyle is below minimal/average living standards
- Unemployment
- long-term or permanent loss of job e.g. bank tellers
- Underemployment
- employed less than full time or inadequate amount in respect to economic needs
Income VS Wealth
- As income increases the capacity to have greater wealth increases
Income is the flow of funds
Majority of households have at least one income with some households also receiving transfer payments from the government
Once direct and indirect payments are applied HH are left with disposable income
Direct Tax: personal income tax
Indirect Tax: GST
Many HH receive some form of indirect benefits e.g. education, healthcare
Wealth is the stock of assets
It refers to the current value of assets a HH has accumulated overtime
This can be through savings, investment, business profits and inheritance
Defined as the difference between HH assets and its liabilities
Assets generally are as property, shares, savings
Liabilities are generally loans, mortgages, debt
Distribution of Income
- Very few Aussie live in absolute poverty (basic needs)
- 20% Aussies live in relative poverty (just below minimal living standards)
Income Redistribution
- Key elements of income redistribution
- Direct Taxation - Progressive tax
- Spending Powers - Direct Transfer (40% of budget)
- Indirect Payments - Public Services