
Map Types/ Projections
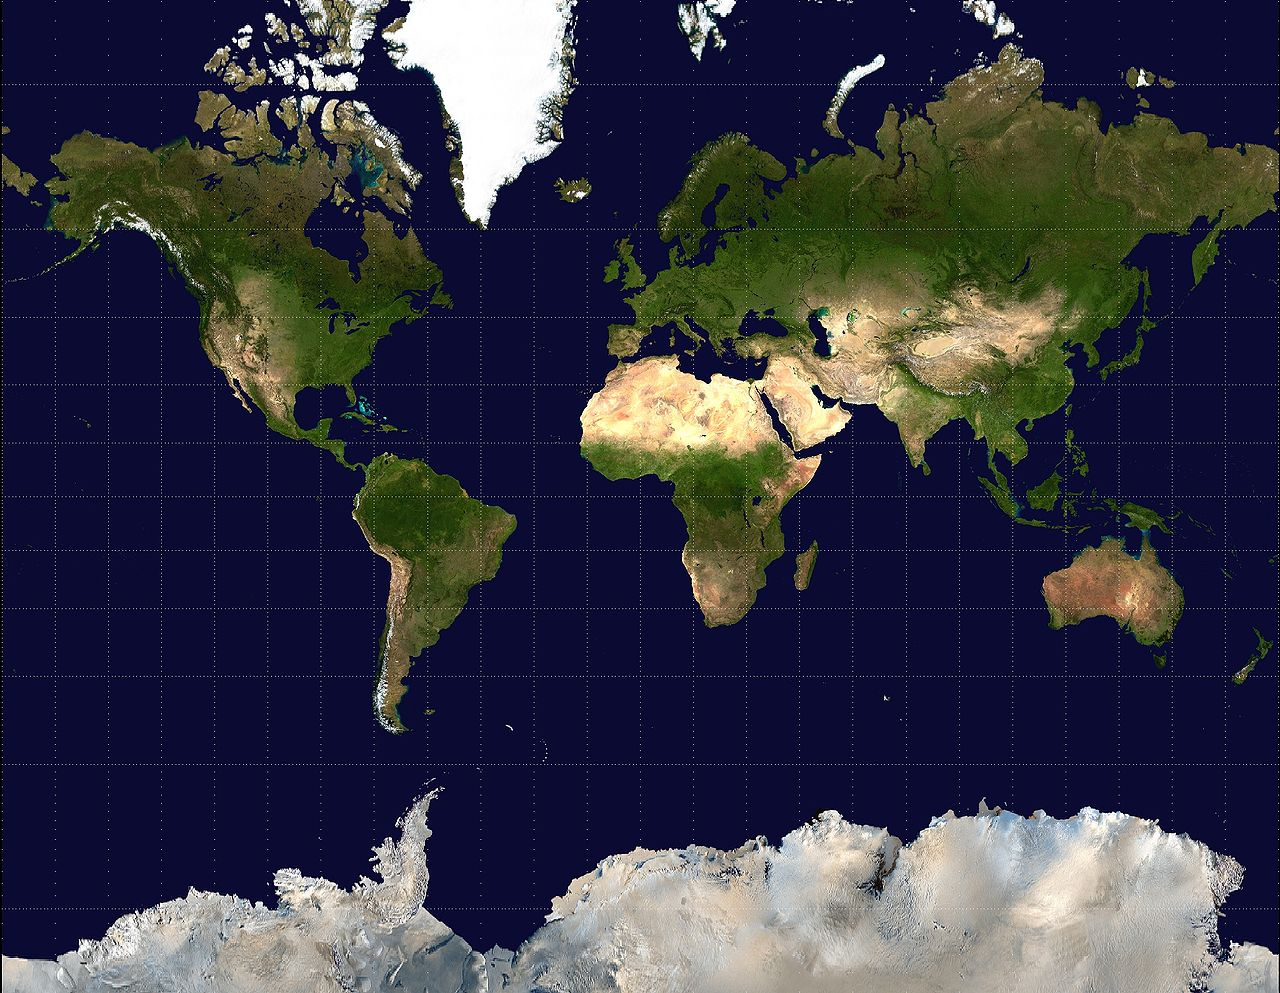
Mercator Map Projection
A map projection that fairly accurately shows shape and direction, but distorts distance and size of land masses.
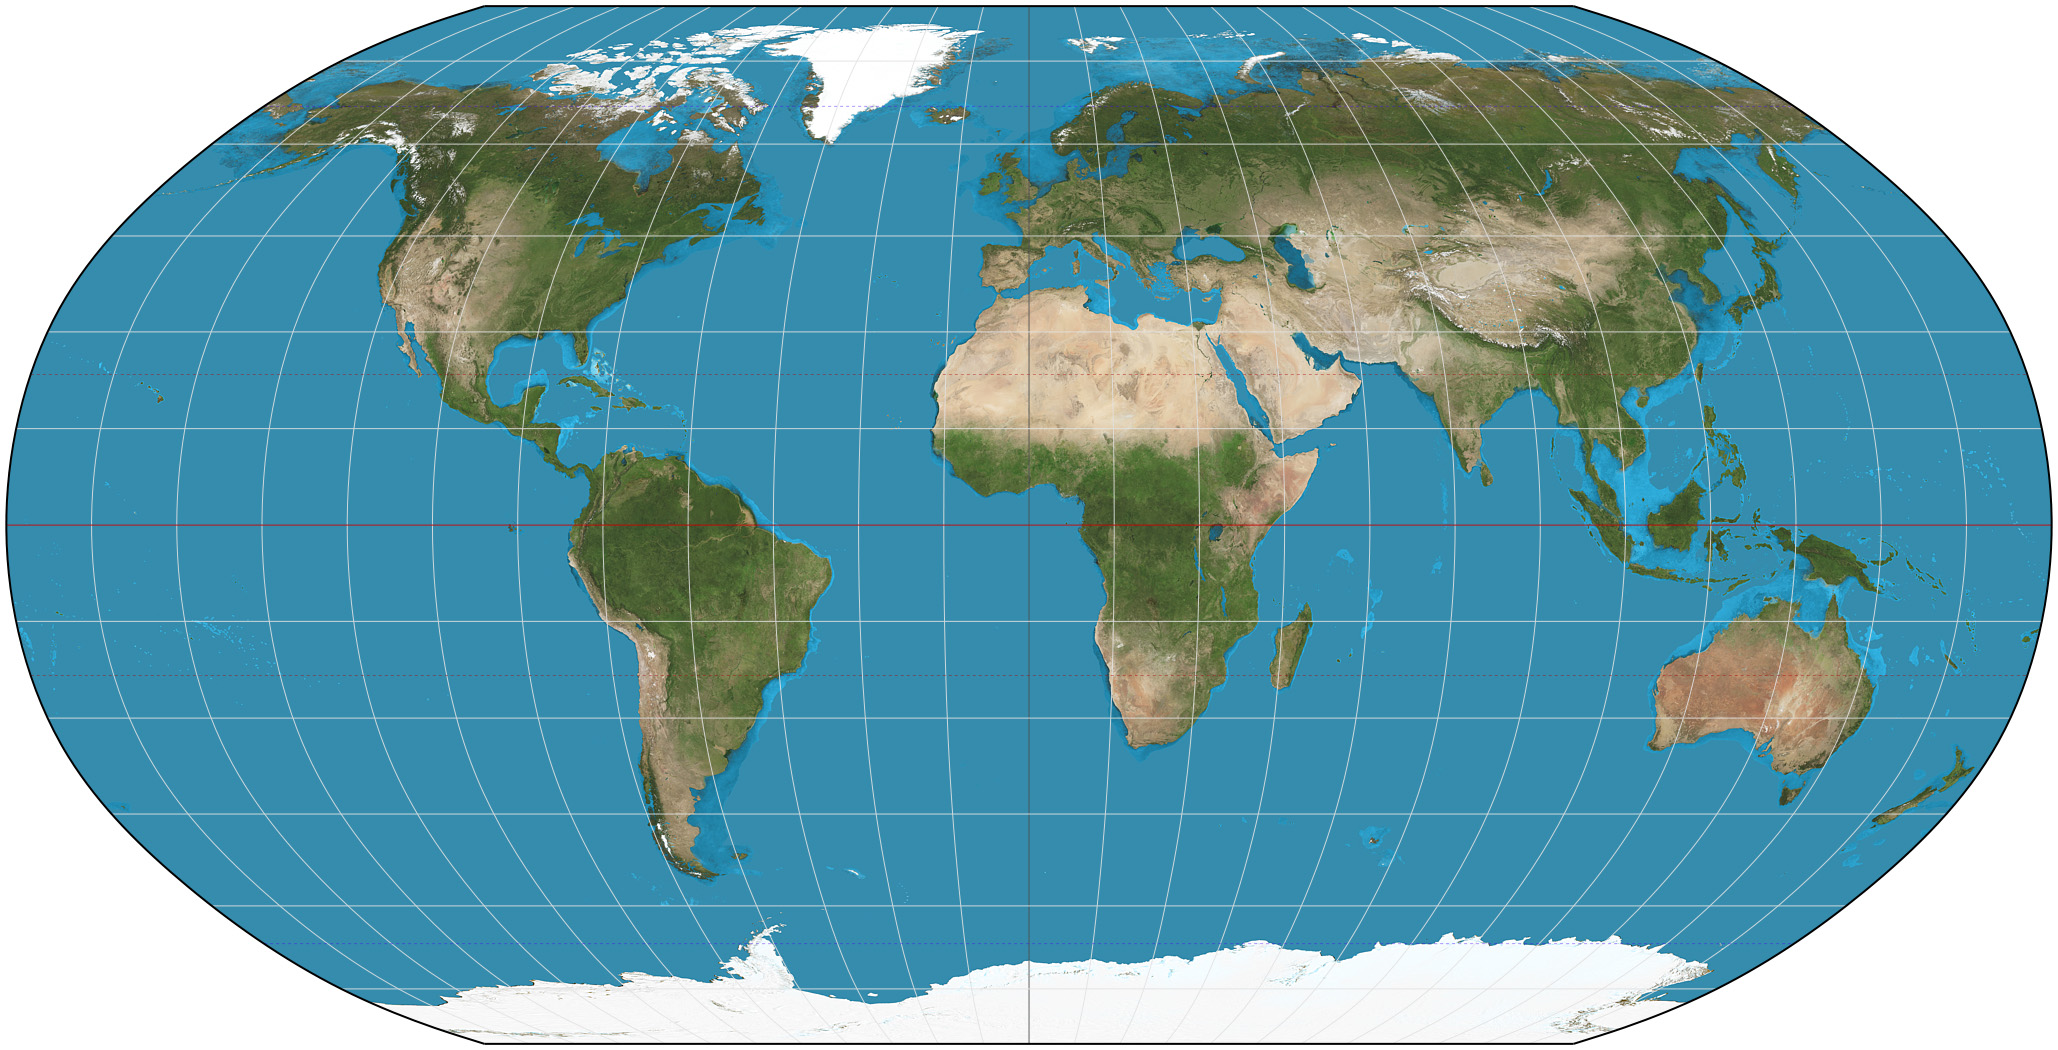
Robinson Map Projection
A compromise map projection showing the poles as lines rather than points and more accurately portraying high latitude lands and water to land ratio.
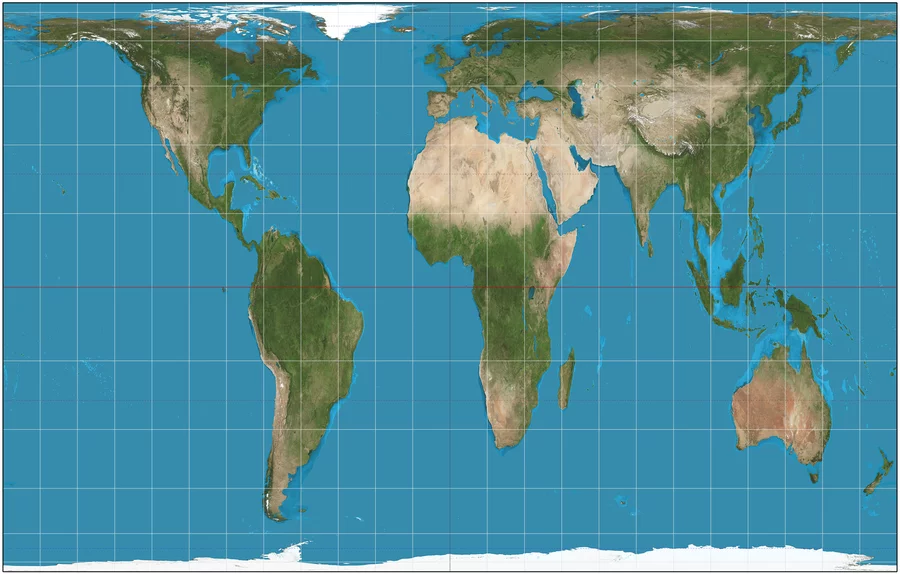
Gall-Peters Map Projection
The Gall–Peters projection is a rectangular, equal-area map projection. The map shows the correct sizes of countries, but it also distorts their shape.
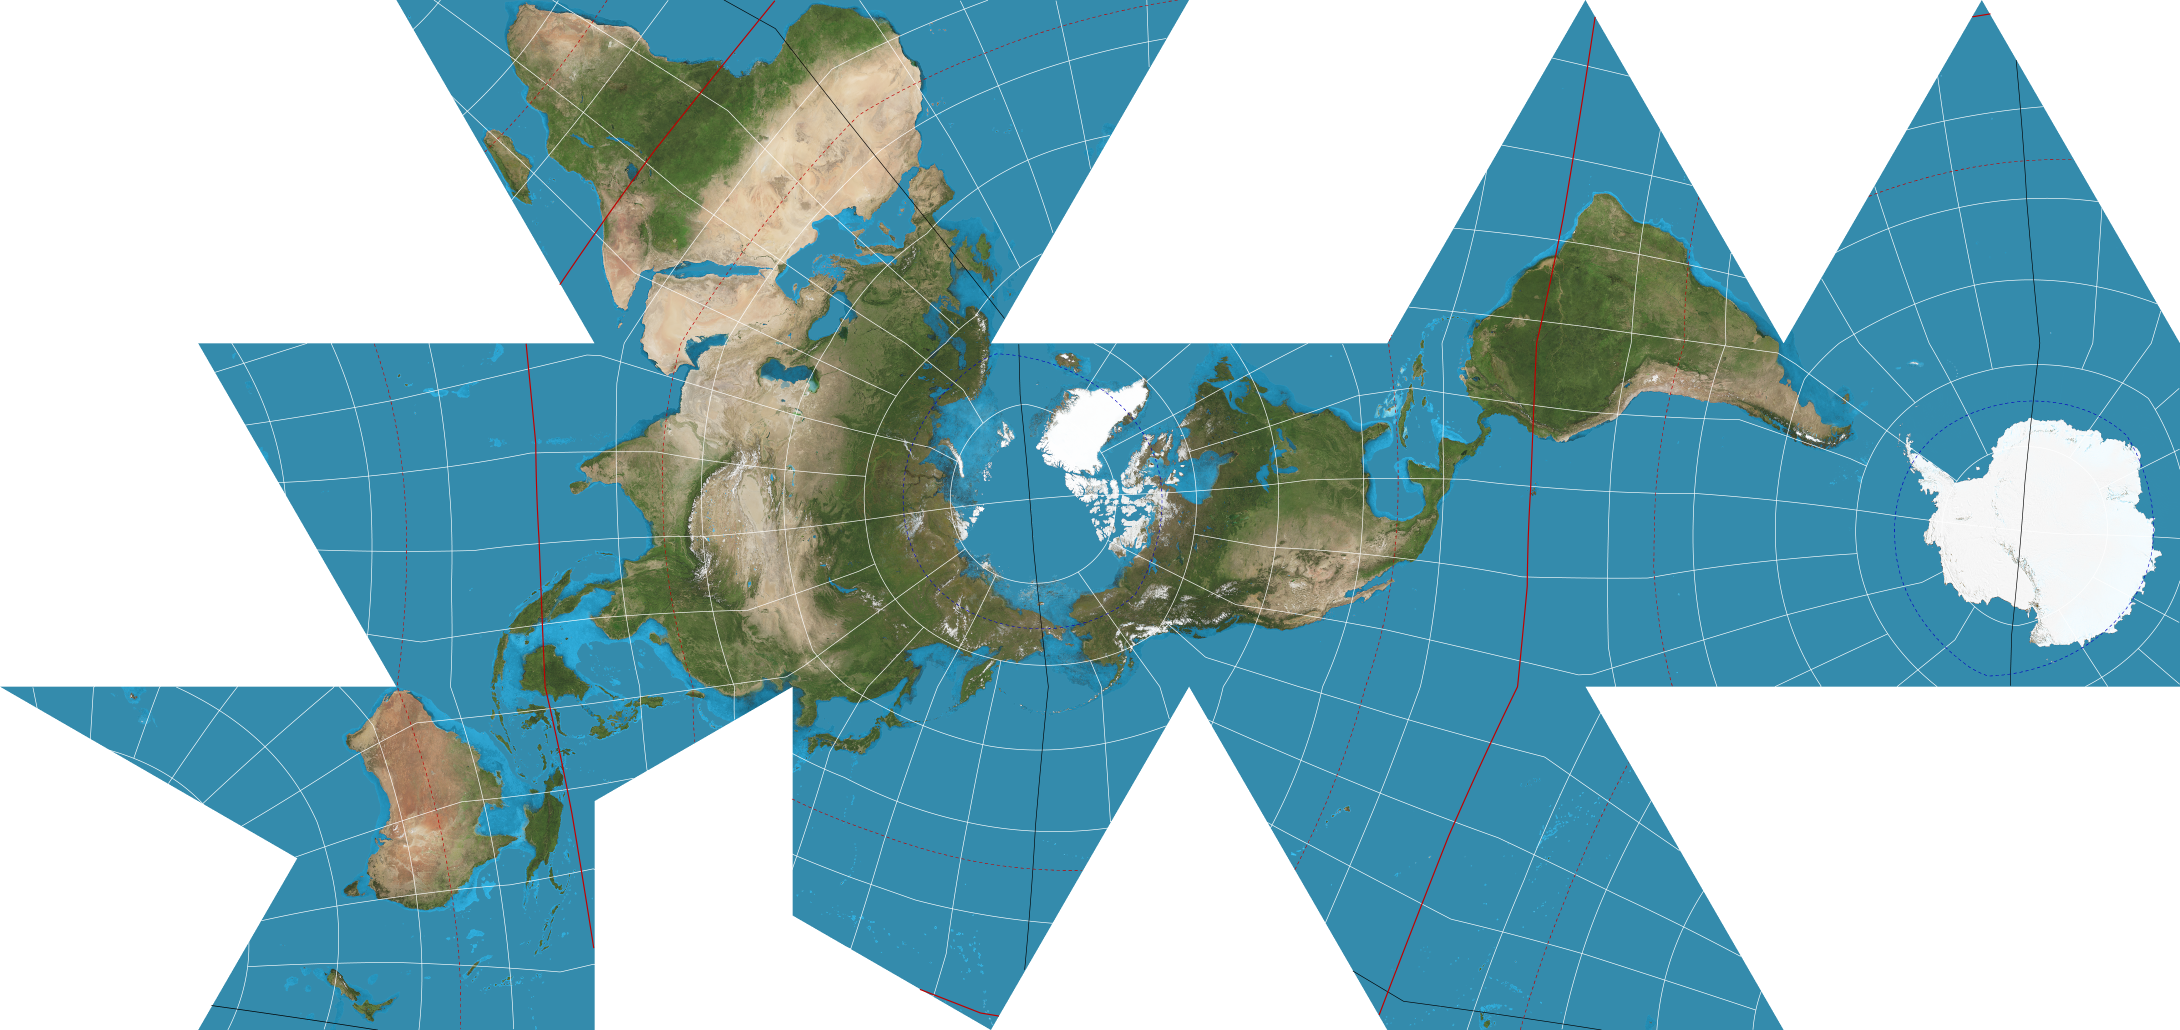
Dymaxion/ Fuller Map Projection
The Dymaxion map is only intended for representations of the entire globe. When presented as a flat map, the land masses are unbroken. The flat map is heavily interrupted in order to preserve shapes and sizes.
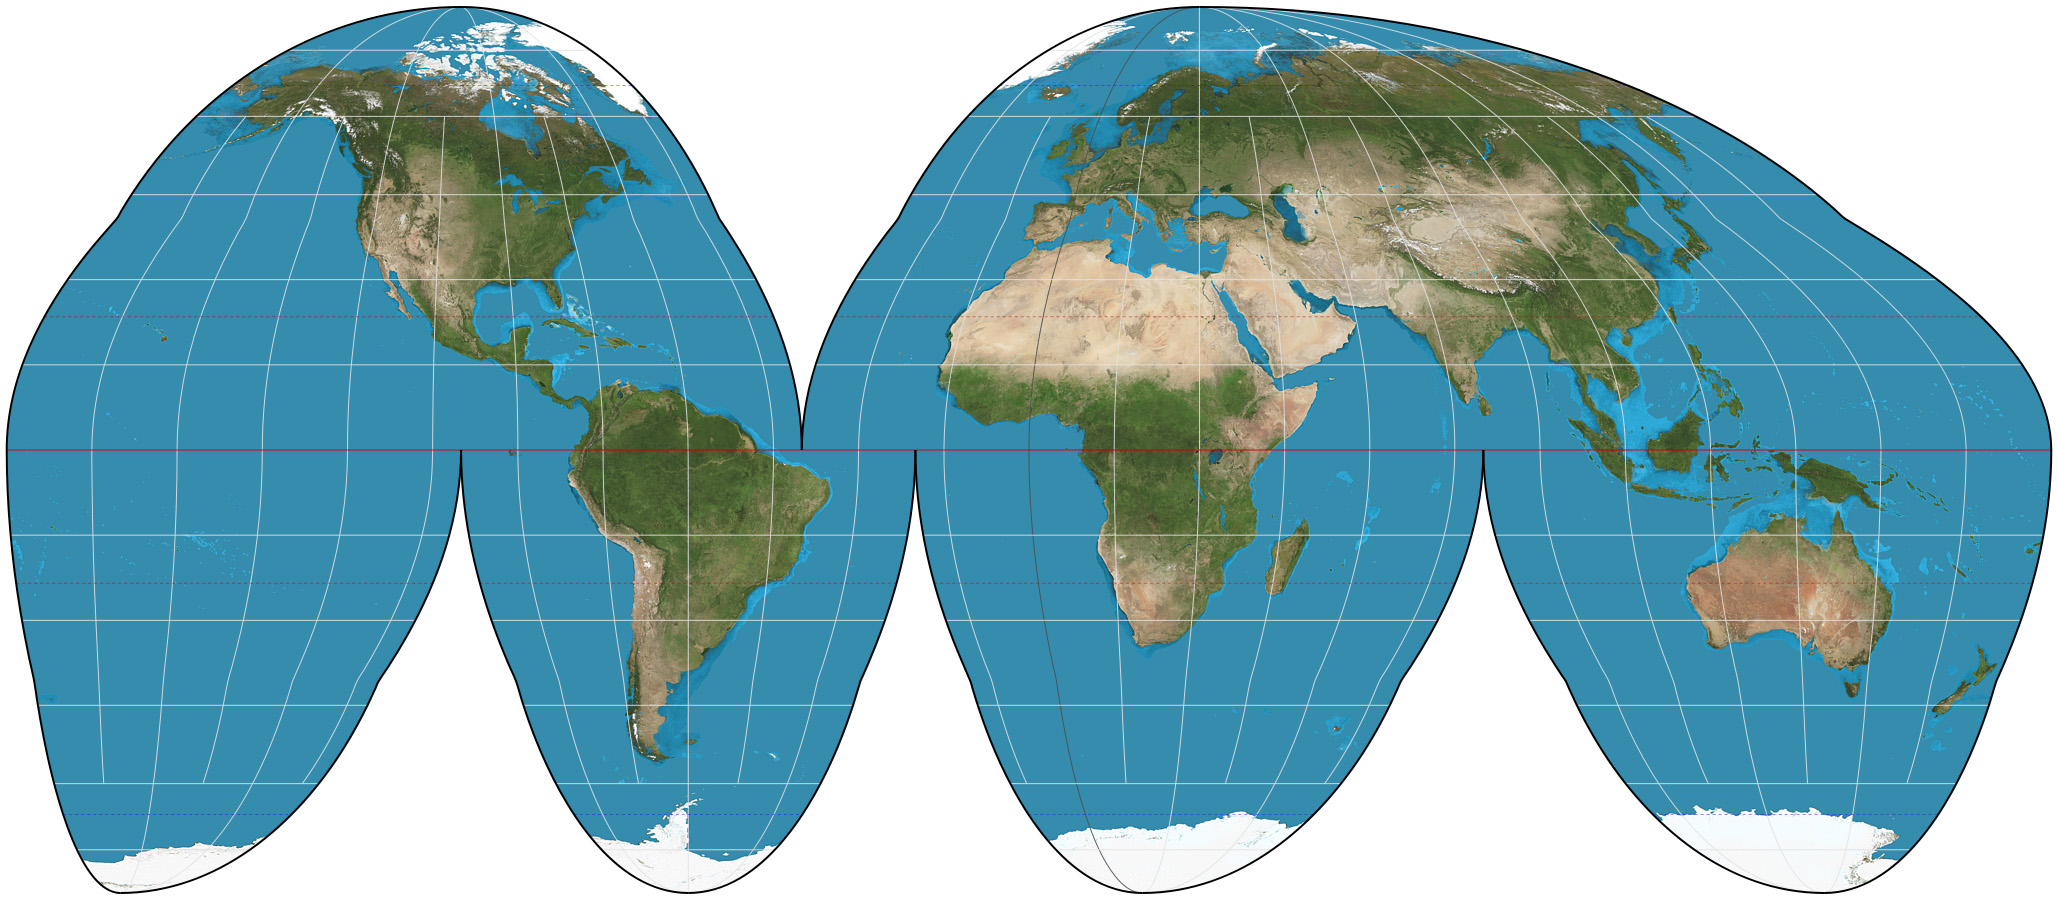
Goode Homolosine Map Projection
Its ability to minimize distortion for the entire world means it can show the continents proportionally sized to each other. However, it’s use of distances, directions, and angles are not accurately shown because of distortion.
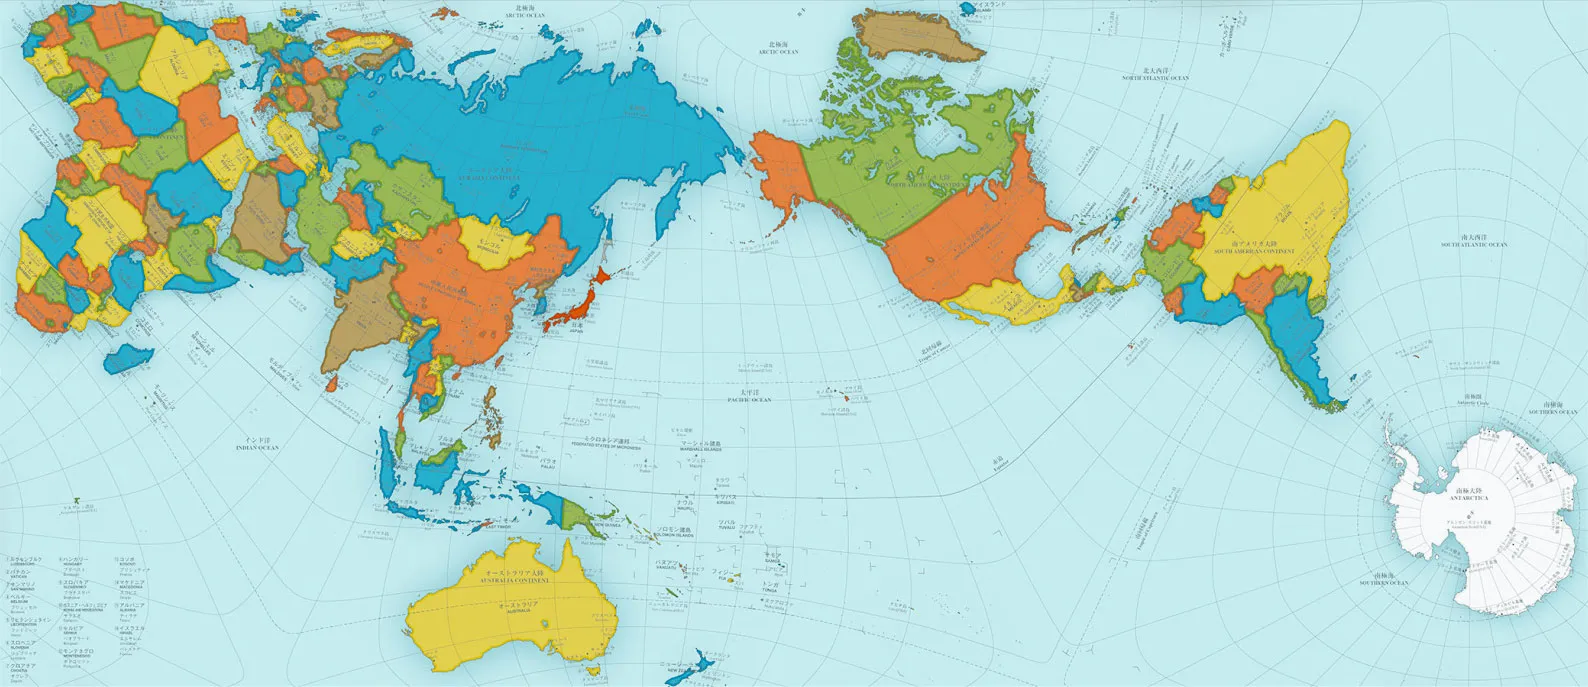
AuthaGraph Map Projection
It is considered the most accurate projection for its way of showing relative areas of landmasses and oceans with very little distortion of shapes.
Thematic Map
A thematic map shows the spatial distribution of one or more specific data themes for selected geographic areas. (Ex: Weather maps, population density maps, geology maps)
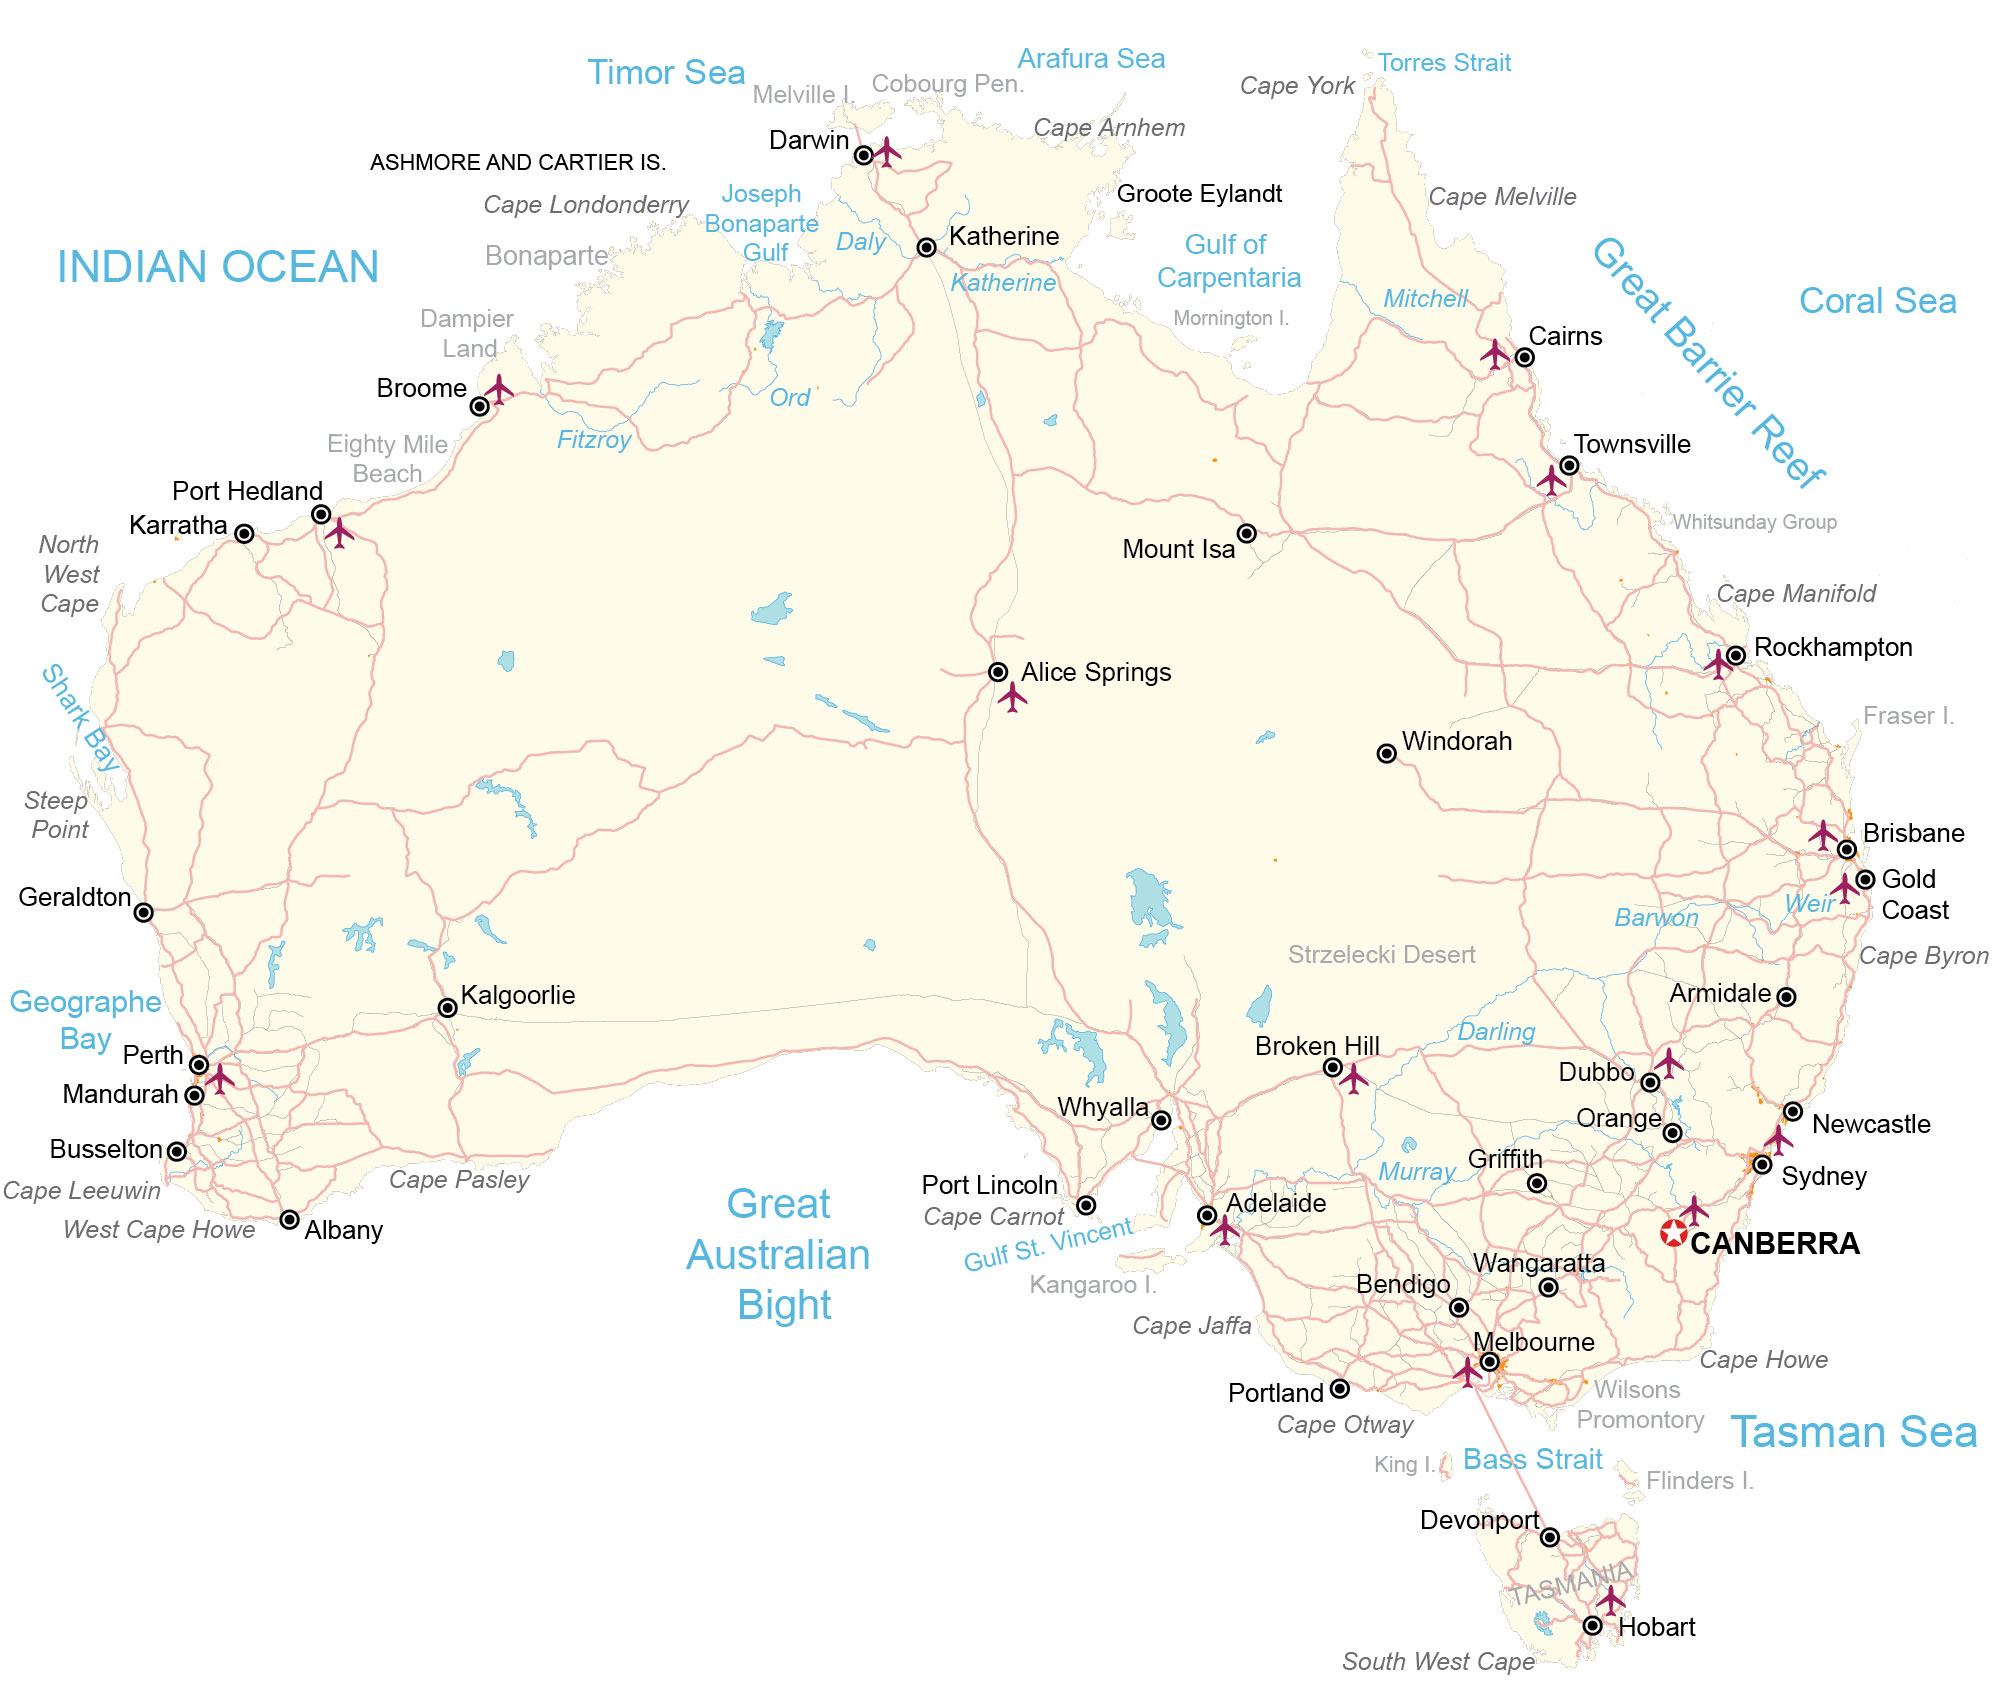
General Reference Map
A reference map focuses on the location and names of features, unlike thematic maps, which focus on the spatial variability of a specific distribution or theme
(Ex: political maps, physical maps, road maps, topographic maps)
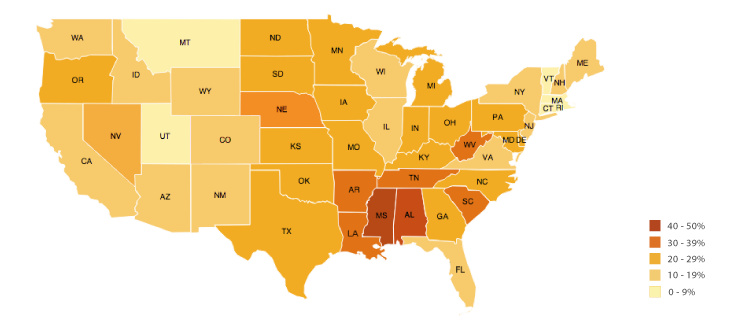
Choropleth Map
A thematic map using shading to show a pattern of a variable (the darker the shading, the higher the concentration of the variable)
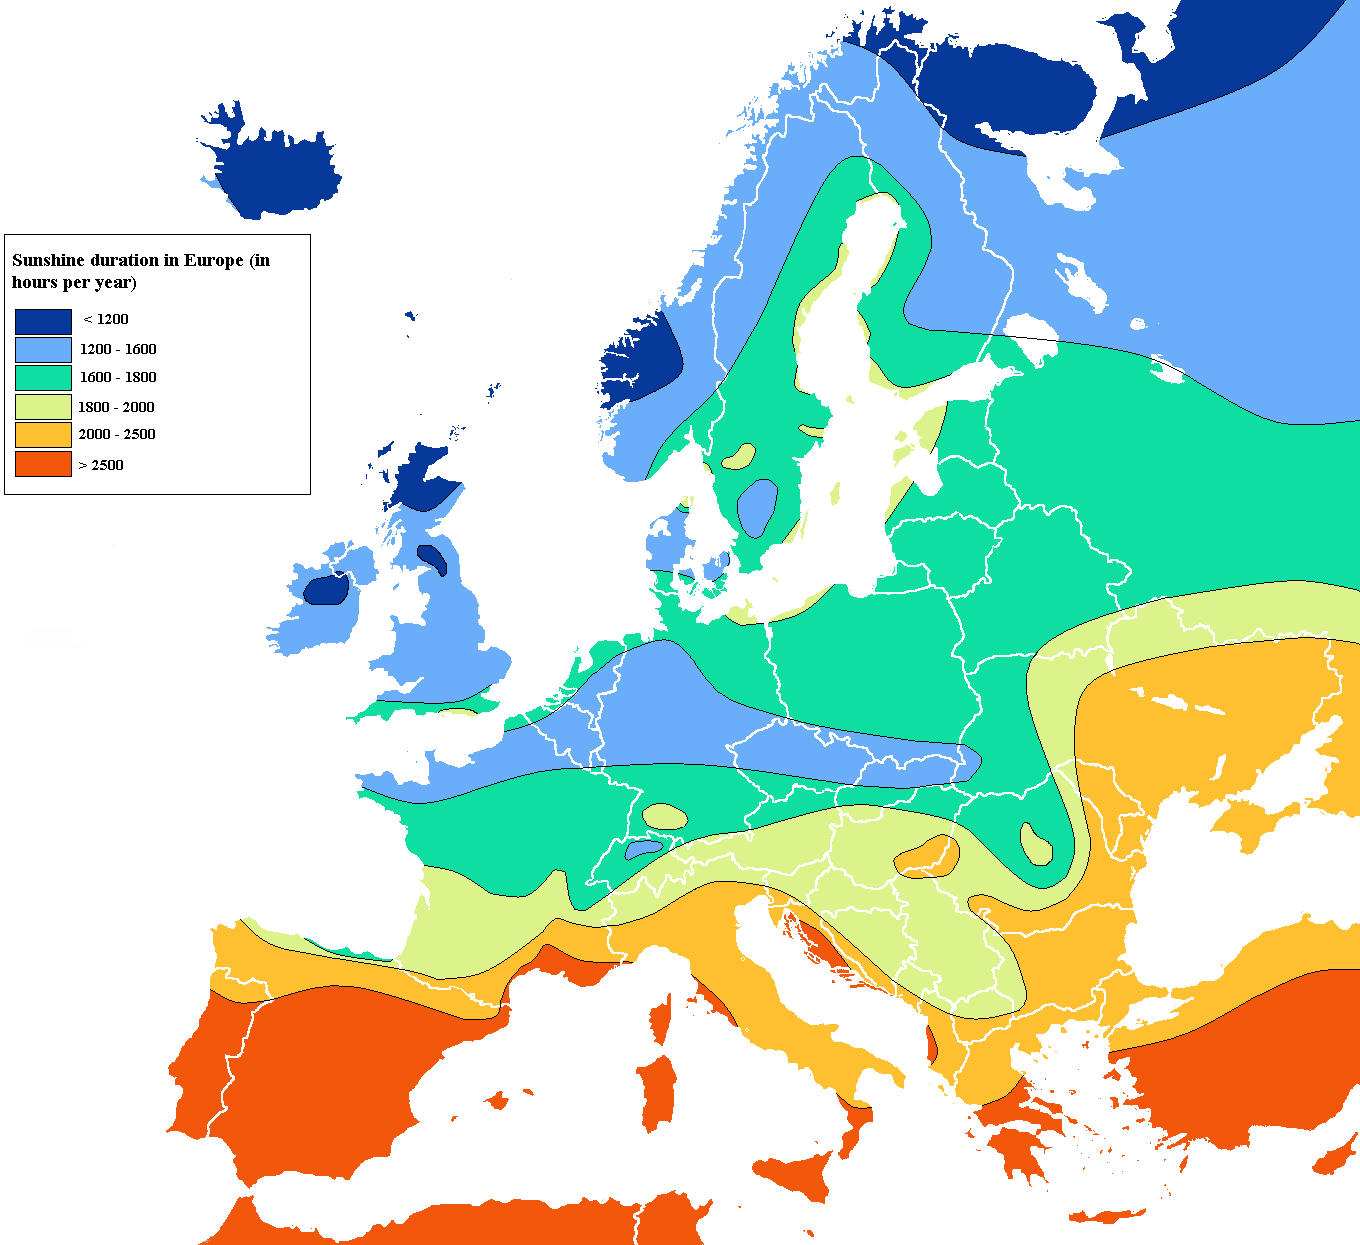
Isoline Map
Isolines maps are lines drawn on a map connecting data points of the same value.
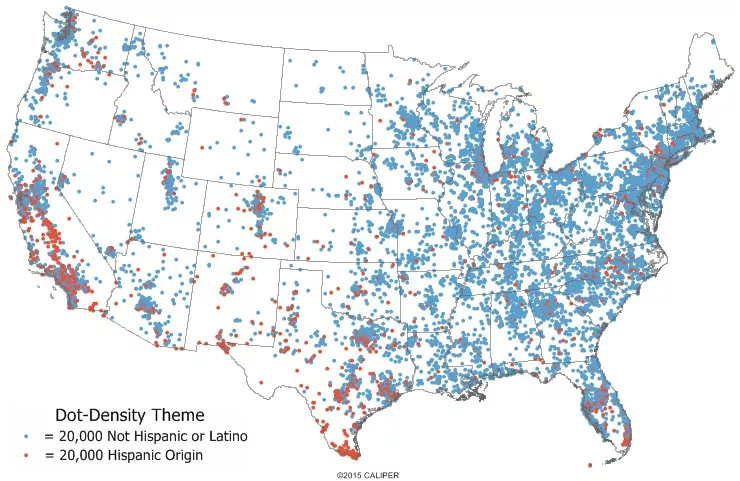
Dot Distribution (Density) Map
A type of thematic map that uses a point symbol to visualize the geographic distribution of a large number of related phenomena.
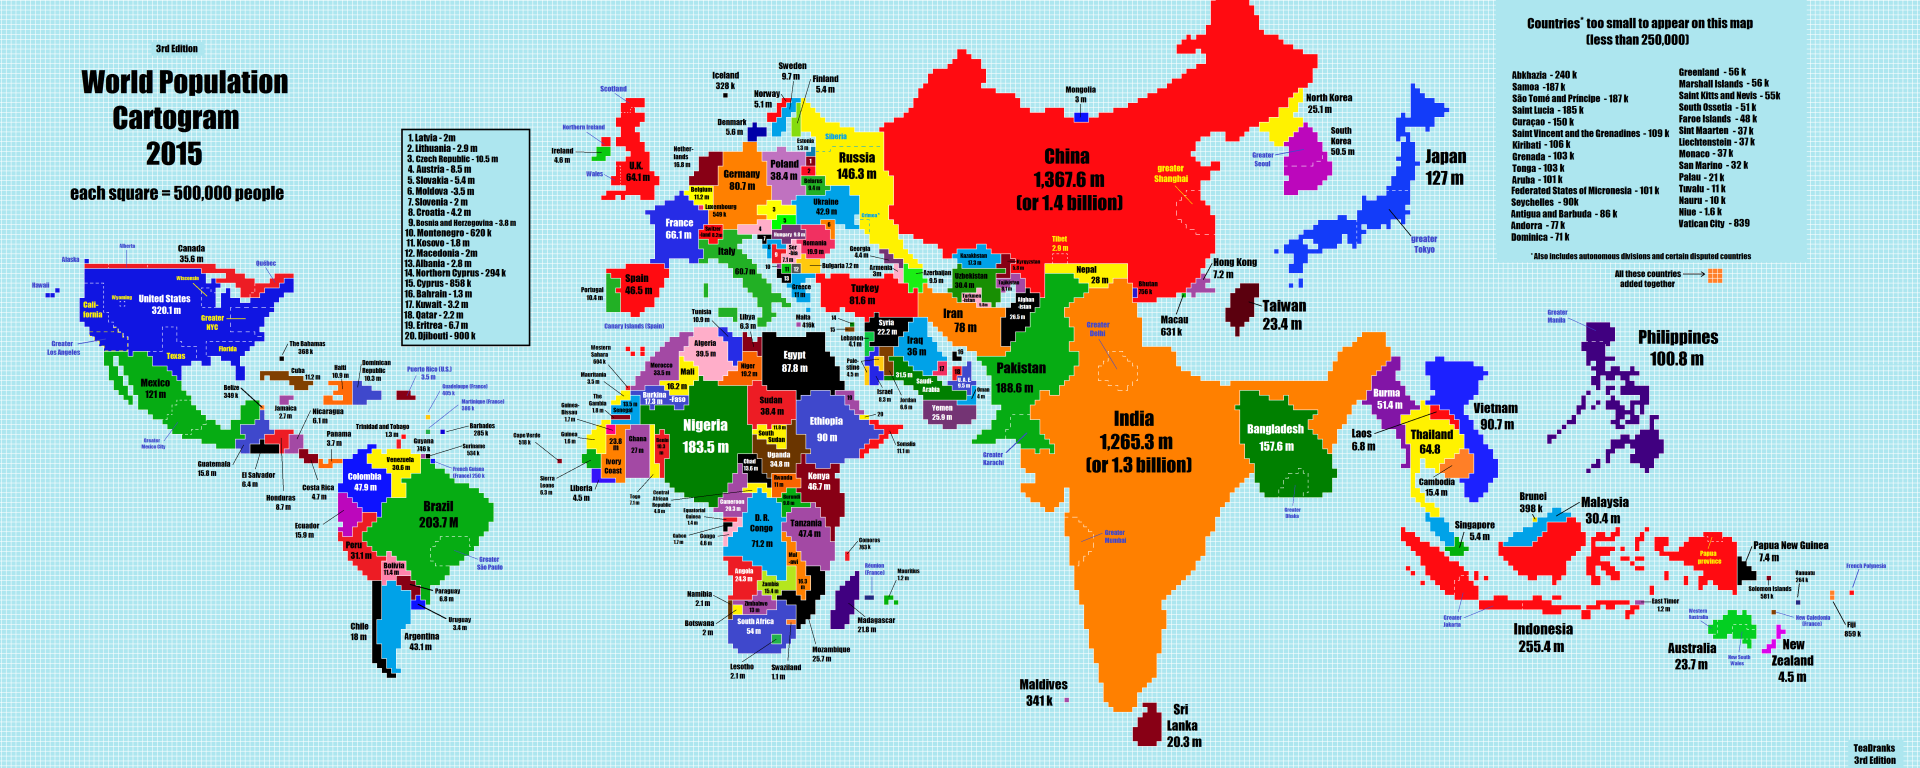
Cartogram Map
Cartogram maps distort the shape of geographic region so that the area directly shows a specific data variable.
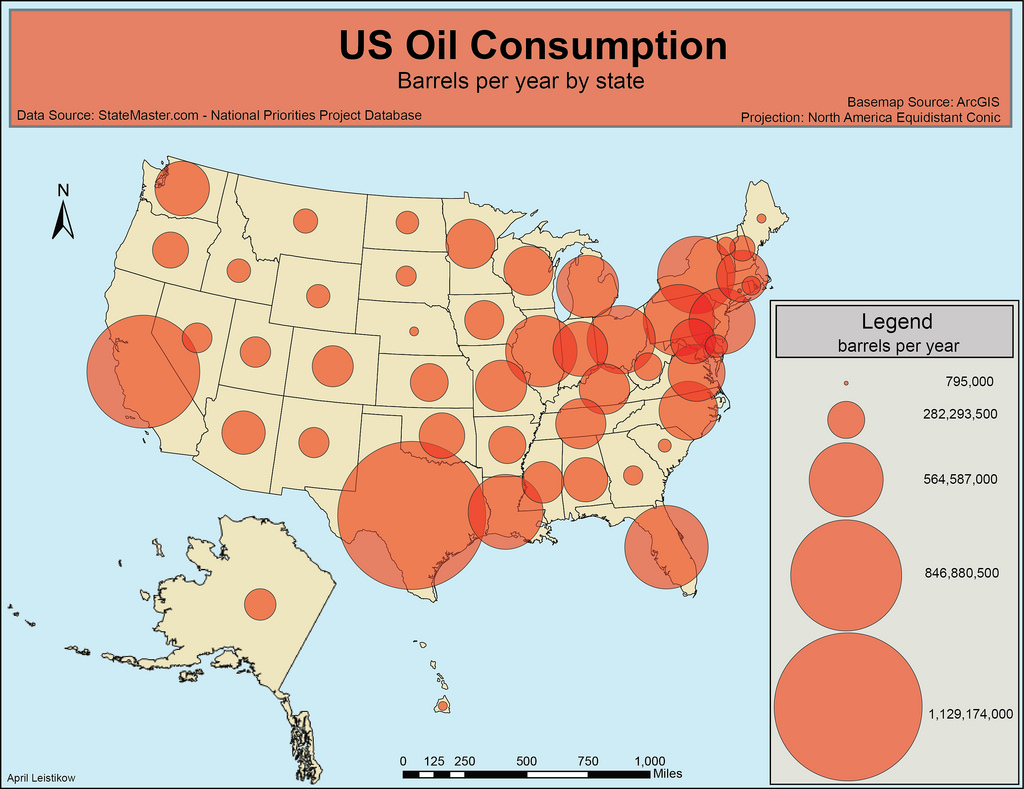
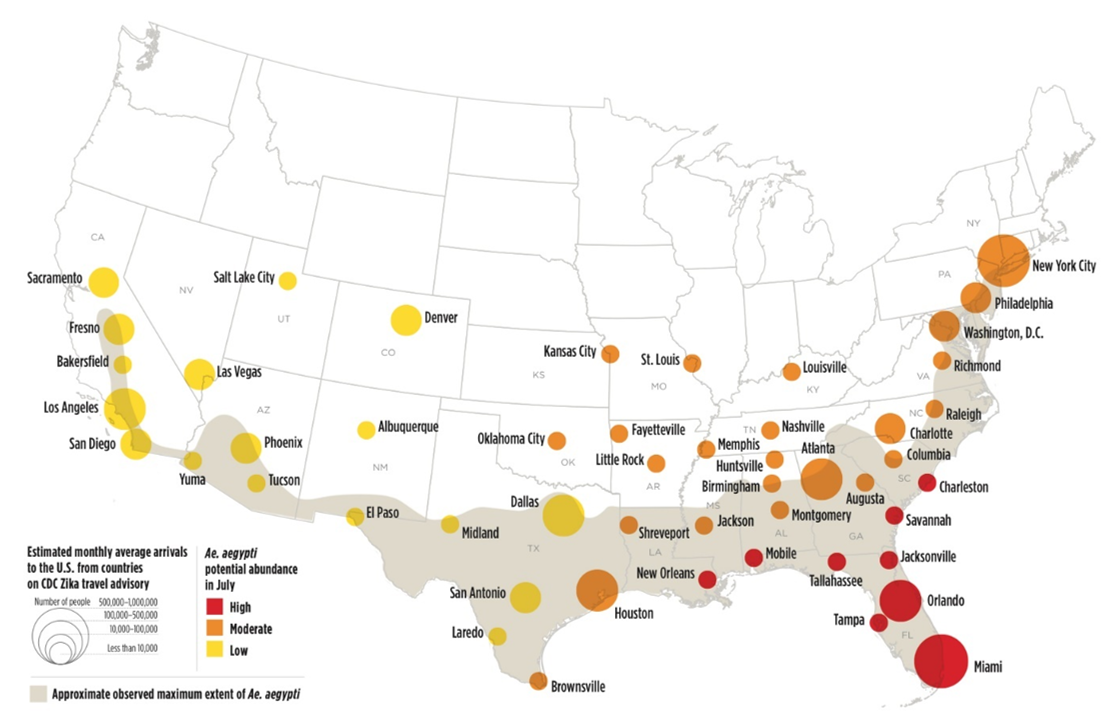
Graduated / Proportional Symbol Map
A type of thematic map with symbols that change in size according to the value of the attribute they represent. For example, denser populations might be represented by larger dots, or larger rivers by thicker lines.
Many geographers consider graduated symbol and proportional symbol maps to be interchangeable, although they are slightly different. For proportional symbol maps, the size of the symbols are in direct relation to the value that is being displayed. Graduated symbol map use symbol sizes to represent classes of data rather than unique or absolute values.
Mercator Map Projection
A map projection that fairly accurately shows shape and direction, but distorts distance and size of land masses.
Robinson Map Projection
A compromise map projection showing the poles as lines rather than points and more accurately portraying high latitude lands and water to land ratio.
Gall-Peters Map Projection
The Gall–Peters projection is a rectangular, equal-area map projection. The map shows the correct sizes of countries, but it also distorts their shape.
Dymaxion/ Fuller Map Projection
The Dymaxion map is only intended for representations of the entire globe. When presented as a flat map, the land masses are unbroken. The flat map is heavily interrupted in order to preserve shapes and sizes.
Goode Homolosine Map Projection
Its ability to minimize distortion for the entire world means it can show the continents proportionally sized to each other. However, it’s use of distances, directions, and angles are not accurately shown because of distortion.
AuthaGraph Map Projection
It is considered the most accurate projection for its way of showing relative areas of landmasses and oceans with very little distortion of shapes.
Thematic Map
A thematic map shows the spatial distribution of one or more specific data themes for selected geographic areas. (Ex: Weather maps, population density maps, geology maps)
General Reference Map
A reference map focuses on the location and names of features, unlike thematic maps, which focus on the spatial variability of a specific distribution or theme
(Ex: political maps, physical maps, road maps, topographic maps)
Choropleth Map
A thematic map using shading to show a pattern of a variable (the darker the shading, the higher the concentration of the variable)
Isoline Map
Isolines maps are lines drawn on a map connecting data points of the same value.
Dot Distribution (Density) Map
A type of thematic map that uses a point symbol to visualize the geographic distribution of a large number of related phenomena.
Cartogram Map
Cartogram maps distort the shape of geographic region so that the area directly shows a specific data variable.
Graduated / Proportional Symbol Map
A type of thematic map with symbols that change in size according to the value of the attribute they represent. For example, denser populations might be represented by larger dots, or larger rivers by thicker lines.
Many geographers consider graduated symbol and proportional symbol maps to be interchangeable, although they are slightly different. For proportional symbol maps, the size of the symbols are in direct relation to the value that is being displayed. Graduated symbol map use symbol sizes to represent classes of data rather than unique or absolute values.

