Errors & Uncertainties - Practical Work
__Random Error:
__Random errors cause unpredictable fluctuations in an instrument’s readings because of uncontrollable factors, such as human errors or environmental conditions.
- Affects the precision of results, causing a wider spread of values about the mean value.
- Can be reduced by taking multiple repeat measurements, calculating an average, and drawing a graph to find the trend
__Systematic Error:
__Systematic errors arise due to faulty equipment/instruments. This type of error is repeated every time the instrument is used, or the method is followed, which affects accuracy.
- Cannot be reduced by taking more repeat measurements as the error is consistent with every repeat.
- To reduce systematic errors, you need to make sure the equipment/instrument is calibrated to the true value.
- Common systematic errors: zero error. Zero Error is when the equipment/instrument does not read 0 when the true value of the reading is 0.
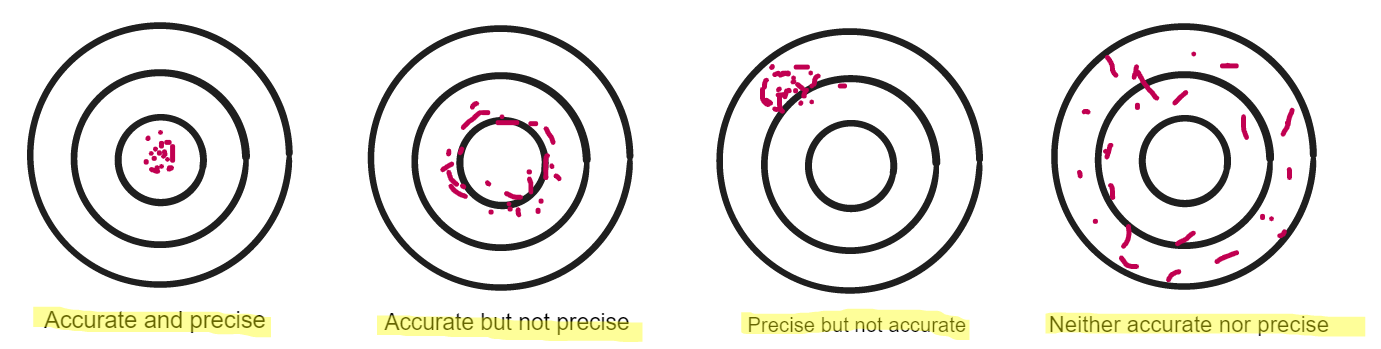
__Precision & Accuracy:
__The precision of a measurement is how close the measured values are to each other; if a measurement is repeated several times, then they can be described as precise when the values are very similar to, or the same as, each other.
- Measurements to a greater number of decimal places are said to be more precise than those to a whole number
Accuracy is how close the measured values are to the real/true value. Accuracy can be increased by repeating measurements, finding the mean, and drawing a graph to find the trend.
__Calculating Uncertainties:
__There is always a degree of uncertainty when measurements are taken; the uncertainty can be thought of as the difference between the actual reading taken (caused by the equipment or techniques used) and the true value.
- ==Absolute Uncertainty:== uncertainty given as a fixed rational quantity (usually 1 significant figure)
- ==Fractional Uncertainty:== uncertainty given as a fraction of the measurement
- ==Percentage Uncertainty:== uncertainty given as a percentage of the measurement (usually given to 2 significant figures)

Calculating absolute uncertainties of Log() values: 
==When adding/subtracting values of measurement:== add the absolute uncertainty
==When multiplying/dividing values of measurement:== add the percentage uncertainty
- ==When the uncertainty is raised to a power:== multiply the uncertainty by the value of the power
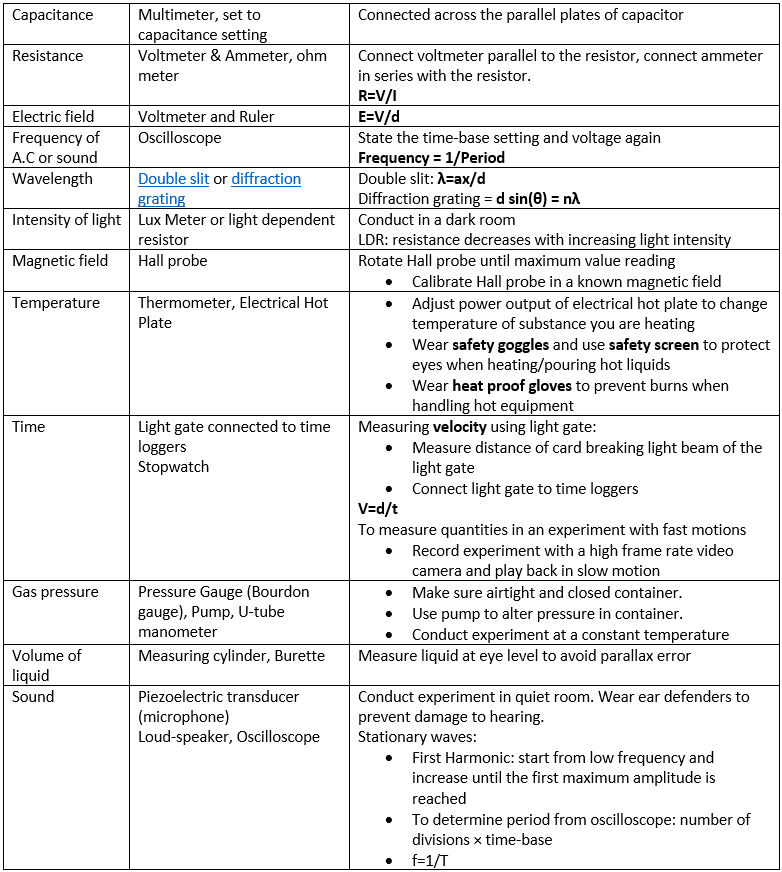
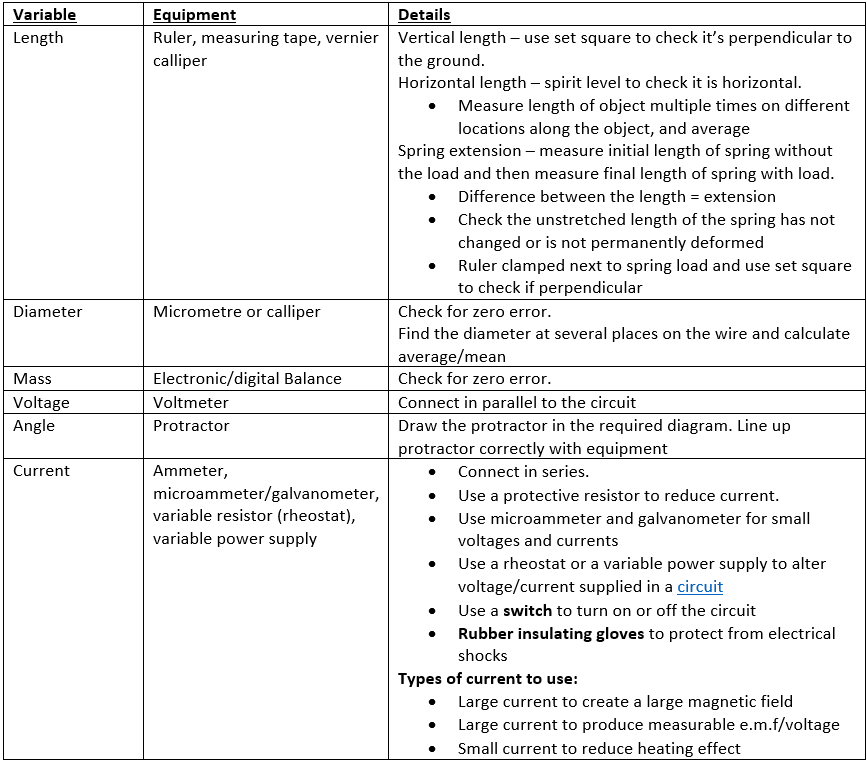
__Experimental Equipment:
 \n
\n