Hazards
Natural Hazards
Nature
Natural Event: A natural physical occurrence.
A hazard is a potential threat to human life and property caused by an event. An event will only become a hazard when it is a threat to people.
A disaster occurs when harm actually occurs to the environment, people, or the economy.
Natural hazards have the potential to cause significant impacts on humans, the built environment, and natural environment. The severity of the impacts depends on a number of factors such as population density, magnitude of the hazard, and the level of preparedness.
Human-made and technological hazards are events that are caused by humans and occur in or close to human settlements. These include:
Complex Emergencies
Conflicts
Industrial Accidents
Transport Accidents
Environmental Degradation
Pollution
Forms
Hazards can come in various forms:
Geophysical
Hazards originating from solid earth.
EXAMPLE: Earthquakes
Atmospheric
Hazards caused by atmospheric processes and the conditions created because of these, such as weather systems.
Climatological
Relating to the climate.
EXAMPLE: Droughts
Meteorological
Relating to weather conditions.
EXAMPLE: Cyclones
Hydrological
Hazards caused by the occurrence, movement, and distribution of water on Earth.
EXAMPLE: Floods
Biological
Hazards caused by exposure to living organisms and their toxic substances, or diseases they might carry.
EXAMPLE: Pandemics
Hazards can also be classed as a mixture of these geographical processes. For example, a tropical storm can be classed as an hydrological-atmospheric hazard, these are sometimes classed as hydrometeorological hazards.
Hazards can be classified by:
Frequency
Magnitude
Spatial Occurrence
Duration
Length of Forewarning
Type of Cause
Natural or Quasi-natural
Natural vs Quasi-Natural
Natural Hazards, such as earthquakes, arise from purely natural processes in the environment and would continue to exist in the absence of people.
Quasi-natural Hazards, such as smog or desertification, arise from the interaction of natural processes and human activities.
Perceptions
Risk: The likelihood that humans will be seriously affected by a hazard.
Vulnerability: How susceptible a population is to the damage caused by a hazard.
People have different viewpoints of how dangerous hazards are and what risk they pose. These perceptions are dependent on lifestyle factors, including economic and cultural elements.
Wealth
The financial situation of a person will affect how they perceive hazards.
Richer people may be able to afford to move to areas that are less prone to hazards, or to build their homes to withstand hazards, so they may perceive the risk as smaller.
Wealthier people may view a risk as greater as there is a higher risk of property damage and financial loss.
Increased spending on preparation and prediction may mean that people are more aware of the risks and able to evacuate.
Religion
Some may view hazards as acts of God, sent to punish people, they may not evacuate because of their perception.
Others may simply view hazards as part of the natural circle of life so may not perceive them to be negative.
Cultural values and beliefs may affect whether people trust scientists and government officials, this may mean they underestimate the risk.
Education
People with more education may have a better understanding of the risks of hazards.
They may believe that they are able to reduce the risks or mitigate the impacts.
Past Experience
People who live in hazard-prone areas may have experienced hazards before, which may affect the perception of risk of future hazards.
Past experience may make people more fearful which may mean they are more prepared for future hazards.
Some studies suggest that people who have experienced hazards are likely to have an optimistic and unrealistic outlook on future hazards. “Lighting never strikes the same place twice” mentality.
Vulnerability
Government polices can reduce vulnerability, empower individuals and communities.
Technology improves ability to forecast extreme events, withstand the impacts, and recover afterwards.
Age affects a person’s individual vulnerability as it affects wealth, education, physical health. Similarly, disabilities affect how an individual reacts to a hazard.
Social norms and discrimination has a large impact on vulnerability.
For example, some families prioritise boys’ education over girls, LGBTQI people face discrimination in shelters. Media coverage of white areas over POC neighbourhoods result in more volunteers for the white population.
Human Responses
The natural response to a hazard is to reduce risk to life and equity. At a local level, this involves saving possessions, globally this means coordinating rescue and humanitarian aid. Responses can be passive, making no effort to lessen a hazard, others are active.
Fatalism: The viewpoint that hazards are uncontrollable, they cannot be avoided, therefore losses should be accepted. Some believe that any interference can have detrimental effects on the ecosystem. (Passive)
Prediction: Using scientific research and technology to predict when and where a hazard will occur so that warnings can be issued and impacts can be reduced. In some cases, hazards may be prevented when predicted early enough.
Adaptation: Attempting to live with hazards by adjusting lifestyle choices so that vulnerability is lessened. For example, practicing earthquake drills, or adding earthquake resistant features to buildings.
Mitigation: Strategies carried out to lessen the severity of a hazard, working to reduce the impacts of hazards. For example, building sea walls to reduce the risk of flooding.
Management: Coordinated strategies to reduce a hazard’s effects. This includes prediction, adaptation, and mitigation. Governments may coordinate responses to manage it effectively.
Risk Sharing: A form of community preparedness. Working together to reduce the risk and sharing the costs of hazard response. For example, buying home insurance - only some people need to claim but the cost is shared by everyone.
Factors affecting Response
Frequency: How often a hazard occurs. Also known as incidence.
The more often a hazard occurs, the more likely that people will be educated and prepared with effective management strategies.
Low Incidence Hazards may be harder to predict and have less management strategies in place. This could mean more catastrophic when it does eventually occur.
Intensity: The power or strength of a hazard. The effects on the person, can change dependent on the distance from the hazard or management strategies.
Magnitude: The size of the hazard, this is usually how a hazard’s intensity is measured. Definable, does not change.
The greater the severity of a hazard, the larger the potential impact, and the greater the response required.
High magnitude, high intensity hazards will have worse effects.
Television Analogy
The magnitude is the signal being sent out, and the frequency of the television transmission.
The intensity is how well it is being received by the person.
Even if the quality (intensity) on an individual’s end is poor and grainy, the broadcast (magnitude) is always going to be on the same frequency.
The same earthquake may cause extreme damage to one individual (high intensity), and may cause no damage to someone who is well prepared (low intensity). The size of the hazard did not change (magnitude remained the same).
Level of Development: The level of economic wealth and standard of living in a country.
More developed countries are more likely to have mitigation and adaptation strategies in place, and will be better prepared to respond to the hazard effectively.
LICs may lack the wealth and technology to manage hazards effectively.
HICs may not be prepared for natural hazards, meaning they lack the management strategies for an event. This is especially true for Multi-hazardous environments, where the resources are spread thinly over a variety of hazards.
Distribution: Where hazards occur.
In more hazardous locations people are more prepared for hazard events because they invest significant time and money to protect themselves.
Models
The Park Model
The Park Model describes various phases following a hazard event - relief, rehabilitation, and reconstruction. It outlines how people respond to a hazard event.
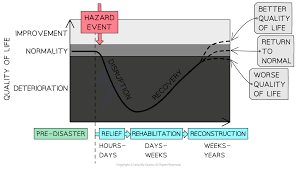
Relief - hours to days
The immediate response including search and rescue, provision of emergency medical assistance, and aid.
Rehabilitation - days to weeks/months
A longer phase that includes temporary restoration of services and infrastructure. This phase facilitates reconstruction to begin as soon as possible.
Reconstruction - weeks to years
Permanent restoration which aims to provide the same or an improved quality of life than before.
Normality is the state of the country pre-disaster, the conditions found within the place the disaster hits. This includes the social, economic, and environmental status.
The steepness of the downward curves varies depending on the nature and the magnitude of the hazard. A high magnitude event that happens very suddenly will have a steeper and deeper curve compared to a slow-onset, low magnitude event.
The upward curve will vary for each event and area depending on, preparation and planning, development, and aid (both national and international).
The Hazard Management Cycle
The hazard management cycle is a model that shows how the events of one hazard event inform the planning and preparation of the next hazard event.
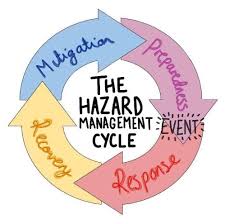
Response
The immediate action taken after an event. Immediate responses focus on saving lives and coordinating medical assistance.
The speed of response will depend on the effectiveness of the emergency plan that has been put in place.
Recovery
Long-term responses. Restoring the affected area to something approaching normality.
Mitigation
Strategies to lessen the effects of another hazard. This can involve direct intervention, or preparing defences that may slow down the advance of the hazard.
This may happen before or after a hazard.
Preparedness
Being ready for an event to occur. This is about the planning on how to respond to a hazard.
For example, making sure warning systems are in place, educating people about what to do, or training responders.
The Hazard Management is a cycle because hazard events keep happening, so efforts to prepare for them, mitigate, respond, and recover from their effects are ongoing.
Plate Tectonics
Earth structure
The Earth has four main layers:
The Crust
The Mantle
The Outer Core
The Inner Core
The Crust
There outer layer of the Earth is the crust, this is the rigid part of the mantle called the Lithosphere.
There are two types of crust:
Continental
A thicker, less dense layer mainly composed of granite. (30-70km)
Oceanic
A thinner, dense layer mainly composed of basalt. (5-10km)
The Mantle
The Mantle is between the crust and the core, it is the widest layer (2900km) which is mostly made up of silicate rocks.
The upper mantle has two layers
The asthenosphere is a plastic-type layer which moves very slowly under high pressure. It is semi-molten.
The layer above this is rigid, and with the crust, makes up the lithosphere.
The lower mantle is hotter and denser than the upper mantle. The intense pressure keeps the lower mantle, near the outer core, solid.
Around 1000-3500°C.
The Core
At the centre of the Earth is the core, which is split into an inner and outer core.
Inner Core
Solid centre containing lots of iron and nickel.
About 6000°C.
Outer Core
Semi-molten, mostly liquid iron and nickel.
Internal Energy
The Core and the Mantle’s heat form the Earth’s main source of internal energy. This heat is the main driver of tectonic activity.
There are two key causes of this extreme heat:
Primordial Heat
Heat left over from the Earth’s formation.
Collisions of asteroids and other small bodies.
Radiogenic Heat
Radioactive Decay of elements
Elements such as uranium and potassium inside the Earth’s core release heat.
History
Plate Tectonic theory revolutionised the study of Earth Science. People began to notice that the continents seemed to fit together remarkably well.
In 1912, Alfred Wegener, published his theory that a single continent existed about 300 million years ago, he named this super-continent Pangea. He proposed that today’s continents were formed from further splitting of Pangea. Wegener published his theory of continental drift which was based on several pieces of evidence.
Geological Evidence
Continents show similar rock sequences along their margins up until the time they were split apart. After that, the continents show different stratigraphic sequences (different rock sequences).
Areas of South America and Africa have rocks of the same age and composition.
Rock type and distribution of some mountain ranges can be matched up. Mountains in Scotland, Norway, Sweden, and Finland are similar to those on the east coast of North America.
These rocks must have formed under the same conditions in the same place in order to match so well.
Palaeontological Evidence
By fitting together land masses, some fossils can be matched up in distribution. It is very unlikely these species migrated across thousands of miles of water, or that they evolved separately in different places.
Fossils of Brachiopods can be found in Indian limestone is comparable with similar fossils in Australia.
Fossil remains of the a reptile are found in both South America and Souther Africa.
Ocean Floor Magnetism
From the 1940’s onwards, evidence began to accumulate supporting Wegener.
The Mid-Atlantic Ridge was examined. It provided evidence that sea-floor spreading was occurring, this came from the polarity of the rocks.
The Earth’s magnetic field aligns particles of iron in rocks, however the magnetic field reverses at regular intervals. (Approx. every 400,000 years).
This results in magnetic stripes of alternating patterns. The striped pattern is mirrored exactly on the other side of the oceanic ridge.
Climatology
There is evidence that the past climates of some continents were similar.
Some glacial deposits are found in Antarctica, Africa, South America, India, and Australia. Together, the distribution of the deposits suggest that they were joined together millions of years ago.
Large coal deposits that were formed in tropical conditions have been found in North America and parts of Europe. This suggests these regions were once closer to the Equator.
Theory of Plate Tectonics
The tectonic theory of crustal evolution is a scientific theory that revolutionised people’s understanding and study of geological processes on Earth. It helps to explain geological phenomena such as:
the occurrence of hazards such as earthquakes and volcanoes
the formation of mountain ranges
the movement of continents
the distribution of some mineral resources
Continental Drift Theory
Wegener’s theory stated that the continents had moved but was unable to suggest how or why, and his ideas did not link to the occurrence of tectonic hazards. It was only decades later that scientists were able to build on his theory to explain how and why tectonic plates move and how their interaction at plate margins creates distinctive processes and landforms.
Tectonic Plate Movement:
The tectonic plates move slowly over the asthenosphere.
Scientists agree that the plates move but there is still debate over the mechanisms that cause the movement.
Convection Currents
Central to the theory of plate tectonics is the idea of convection currents. Higher temperatures at the Earth’s core, and heat released by radioactive decay, help create convection currents.
Lower parts of the asthenosphere heat up, because of the temperature of the core, become less dense and slowly rise.
As they move towards the top, they cool down, become more dense and slowly sink.
These circular movements of semi-molten rock are called convection currents.
They create drag on the base of the tectonic plates, they carry the lithosphere plates, causing them to move.
Slab Pull
A subduction zone is formed when two plates move towards each other.
The heavier, denser oceanic plate subducts under the lighter, less dense plate.
The denser crust is forced under the less dense plate.
As the plate sinks, gravity pulls the plate down into the mantle.
This is slab pull.
Ridge Push
Magma rises to the surface and forms new crust.
The heat of the magma heats the surrounding rocks, which expand and rise above the surface of the surrounding crust forming a slope.
The new crust cools, becoming thicker and denser.
Gravity causes the denser rock to move downslope, away from the plate margin.
This puts pressure on the tectonic plates, causing them to move apart.
This is ridge push, also called gravitational sliding.
Sea Floor Spreading
As tectonic plates diverge (move apart), magma rises up and fills the gap created. The magma cools and forms new crust.
Over time, the new crust is dragged apart and even more new crust is formed.
When this happens, the sea floor gets wider. Sea Floor Spreading.
This creates mid-ocean ridges - ridges of higher terrain on either side of the margin.
Palaeomagnetism provides evidence of this process. As the lava cools and solidifies, the minerals solidify lining up with the magnetic field. The directions of the minerals on either side of the mid-ocean ridge is a mirror image.
Plate Margins
At each plate boundary, different processes take place and different landforms are found. There are three main types of plate boundaries:
Constructive (Divergent)
Destructive (Convergent)
Conservative (Transform)
Constructive Plate Boundaries
A constructive margin occurs when two plates are moving apart, the two plates are diverging.
Volcanoes
The mantle is under pressure from the plates above. When they move apart, the pressure is released.
The release of pressure causes the less dense magma to rise and fill the gap.
The magma erupts to form a volcano.
Earthquakes
The plates do not move apart uniformly, some parts move faster than others.
This causes pressure to build up.
When the pressure becomes too much, the plate cracks, making a fault line and causes an earthquake.
There are two landforms created at constructive plate margins.
Ocean Ridge
Forms when the diverging plates are under the ocean.
EXAMPLE: The Mid-Atlantic Ocean Ridge, where the Eurasian and North American Plates are moving apart.
As the plates move apart, the magma rises up to fill the gap. This accumulates over time to become taller and wider.
Underwater volcanoes erupt along the ocean ridges, these can build up to be above the sea level.
EXAMPLE: Iceland has been formed by the build-up of underwater volcanoes along the Mid-Atlantic Ridge.
Rift Valley
Forms when the diverging plates are under land.
EXAMPLE: East African Rift Valley, where the Nubian and Somalian plates are diverging. Stretches about 4000km from Mozambique to the Red Sea.
As the plates move apart, the continental crust bulges and fractures forming fault lines. The plates keep moving apart so the areas of crust between the fault line drops to from a rift valley.
Volcanoes form around rift valleys, when magma rises through the fault lines and cracks in the crust.
EXAMPLE: Mount Kilimanjaro and Mount Kenya are volcanoes in the East African Rift Valley.
Destructive Plate Boundaries
A destructive plate margin occurs when two plates are moving towards each other, they converge at one point.
What happens at the margin depends on the type of plates that converge.
Oceanic-Continental
The dense oceanic plate crust is forced underneath the less dense continental crust. This is a subduction zone.
This forms a Deep Sea Trench.
Narrow depressions in the ocean floor with depths of over 6km and up 11km.
EXAMPLE: Peru-Chile Trench in the Pacific Ocean.
This forms Fold Mountains.
The continental plate is compressed and deformed, buckling and folding due to the pressure,
The oceanic plate is heated due to friction with the continental plate, and with contact with the mantle.
This melts the rock into magma.
The magma is less dense than the continental plate above it, so rises to the surface forming volcanoes.
As the plates move, they can get stuck.
This builds up pressure.
When this pressure is too much, the plate jerks releasing the pressure in the form of an earthquake.
Subduction causes friction, which in turn causes the plates to stick.
Energy accumulates, when it finally exceeds the friction, the plates snaps back into position.
This sudden vertical displacement sets a tsunami in motion.
Oceanic-Oceanic
The older, denser oceanic plate is subducted underneath the younger, less dense plate.
This forms Deep Sea Trenches.
EXAMPLE: Mariana Trench, where the pacific plate is subducted under the Philippine Sea plate
This triggers earthquakes.
This also forms volcanoes.
Volcanic eruptions form Island Arcs
The submarine volcanic eruption leads to crust building up and rising above sea level.
Island arcs are clusters of these islands that sit in a curved line near the plate boundary.
EXAMPLE: Mariana Islands, Japanese Archipelago.
Continental-Continental
Also known as a collision zone.
Where two plates of continental crust move towards each other.
Neither is subducted as they have similar density.
The land is pushed upwards instead of creating a subduction zone.
This forms fold mountains,
EXAMPLE: Himalayas, where the Indian plate is moving towards the Eurasian Plate
This trigger earthquakes.
There are no volcanoes found as there is no subduction.
Conservative Plate Boundaries
A conservative margin occurs when two plates are moving past each other. This can be in the same direction at differing speeds, or in the opposite direction.
The two plates get locked together in places and pressure builds up.
This causes the plates to jerk past each other.
It can also crack, forming fault lines.
As it jerks past, it releases the built up energy in the form of an earthquake.
EXAMPLE: San Andreas Fault, where the Pacific plate is moving past the North American plate.
Magnitudes
Boundary | Volcano | Earthquake |
Constructive | Less Explosive EXAMPLE: Eyjafjallajökull | Mild and Shallow |
Destructive | Explosive as the magma has to force its way to the surface. EXAMPLE: Mount Etna | Strong |
Conservative | NO | Powerful |
Magma Plumes
The radioactive decay within the Earth’s core can be concentrated forming hot spots. These hot spots heat the lower mantle creating localised thermal currents where magma plumes rise vertically. These hot spots of magma plumes occasionally rise within the centre of the plate and ‘burn’ through the lithosphere. This creates volcanic activity on the surface. The basaltic lava flows slowly and forms huge flattish volcanoes (shield volcanoes). As the plate moves and the hot spot remains stationary, this causes the formation of a chain of active and subsequently extinct volcanoes.
EXAMPLE: the Hawaiian Islands, near the centre of the Pacific Plate.
Radioactive decay is concentrated forming hot spots
This heats the lower mantle.
Magma rises vertically as a Magma Plume
This burns the lithosphere.
Volcanic activity
The plate moves, magma plume is stationary, forming island chains.
Volcanic 🌋
Distribution
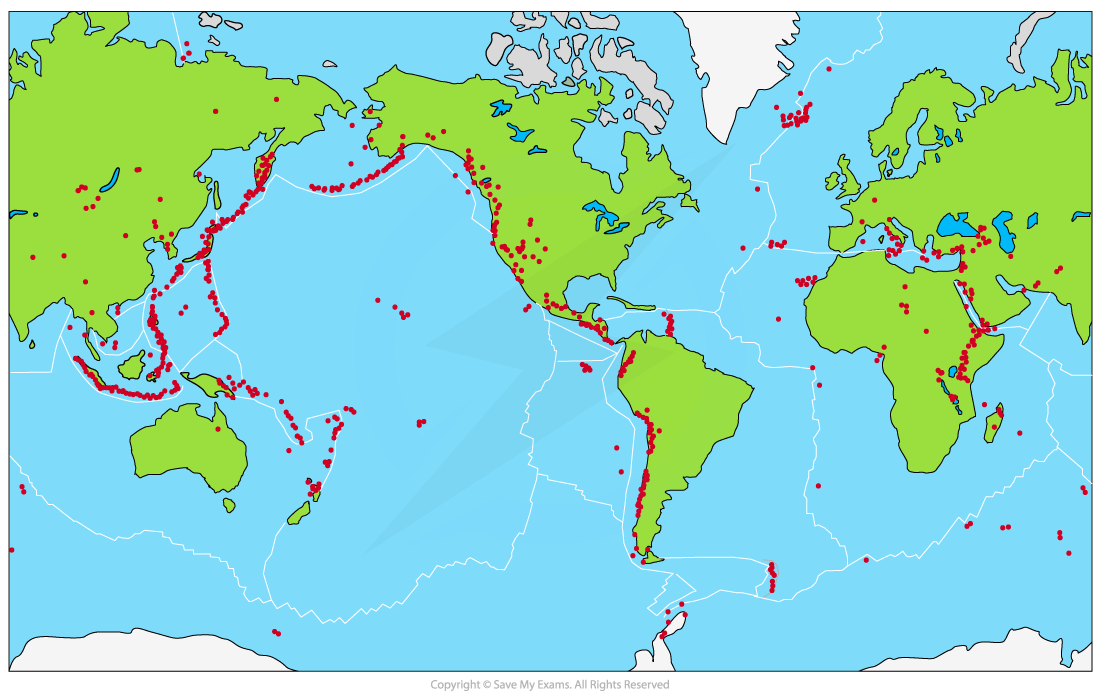
Most volcanic eruptions, vulcanicity, occur near or at constructive and destructive plate boundaries. About 75% occur around the Ring of Fire - 40,000km stretch of high density volcanoes stretching from the Aleutian Islands, through Japan, the Philippines and across to New Zealand.
Constructive Margins
Eruptions are frequent and go on for a long time.
Eruptions are effusive
Dominated by lava and not very violent.
The eruptions are usually basaltic lava:
Low gas content
Low viscosity - flows easily
Higher temperatures
When the boundary is underwater, magma rises to fill the gap, forming ocean ridges.
EXAMPLE: Kilimanjaro (continental-continental), Eyjafjallajökull (oceanic-oceanic)
Destructive Margins
Eruptions tend to be explosive as magma has to force its way to the surface.
Eruptions are short-lived and intermittent
The eruptions are usually andesitic or rhyolitic lava:
High gas content
High Viscosity
Lower temperatures
Lava bombs, ash, dust
EXAMPLE: Mount Fuji (oceanic-continental), Tarawera (oceanic-oceanic).
Hot Spots
Volcanoes can be found away from plate boundaries, at hot spots.
Most hot spots have basaltic lava.
The flowy lava forms volcanoes with gentle slopes. (Shield volcanoes).
EXAMPLE: Mauna Loa, Hawaii
Types of Lava
Basaltic Lava: formed from magma with low silica content, this is more fluid. It allows gas bubbles to expand on the way up therefore resists sudden explosive activity. It is around 980-1260°C.
Andesitic Lava: Formed from magma that is more acidic than basaltic but less than rhyolitic. It has medium amounts of silica, and is more viscous than basaltic. It is around 800-1000°C.
Rhyolitic Lava: Formed from highly acidic magma with high silica content. It is extremely viscous. It has a lower temperature at around 650-800°C. This solidifies before reaching the surface, leading to a build up of pressure and ultimately violent and dangerous eruptions.
Extra
Geysers: Formed when the water is heated to high temperatures, forms steam and is pressurised underground. These require hot underground rocks, ample groundwater source, subsurface water reservoir, and fissures to deliver the water to the surface.
EXAMPLE: Old Faithful in Yellowstone National Park.
Hot Springs: Occurs when water reaches the surface at a gentle rate after being heated below ground. Generally it is accepted to be a hot spring, it has to be above body temperature, above 27°C.
EXAMPLE: Spa Area of Belgium
Boiling Mud: Found where water mixes with volcanic ash, clay, and other fine particles to form viscous slurry. It has high temperatures, often with bubbles.
EXAMPLE: The Sulphur Caldron area of Yellowstone National Park.
Magnitude
The magnitude of volcanic activity is difficult to assess as different eruptions produce different types of products, have different durations, and develop in different ways. The magnitude cannot be measured using a scientific instrument.
In 1982, the VEI was developed, creating a relative scale that enables explosive volcanic eruptions to be compared.
The Volcanic Explosivity Index (VEI) is used to measure the magnitude of an eruption. This is a logarithmic scale from 0-8, based on the amount of material ejected and how high the material was blasted.
The primary characteristics:
The volume of pyroclastic material ejected
Volcanic ash
Tephra
Pyroclastic flow
The height of the eruption column
Duration of the eruption
Types of Eruptions
Icelandic
Basaltic
Lava flows gently from fissures
Hawaiian
Basaltic
Lava flows gently from a central vent.
Strombolian
Basaltic
Frequent explosive eruptions of tephra and steam
Occasional, short lava flows.
Vulcanian
Can be any of the three
Less frequent but more violent eruptions of gases, ash, and tephra
Vesuvian
Can be any of the three
Following long periods of inactivity
Very violent gas explosions blast ash high into the sky
Peléean
Andesitic and Rhyolitic
Very violent eruptions of Nuées Ardentes
Plinian
Rhyolitic
Exceptionally violent eruptions of gases, ash, and pumice.
Torrential rainstorms cause devastating lahars.
Frequency
The frequency and regularity of eruptions are rarely measurable to any degrees of predictable accuracy.
Some active volcanoes erupt only erupt once every 100,000 years or so, whereas others erupt every few months. Generally less frequent eruptions are larger in magnitude and are more damaging.
Some volcanoes erupt at very regular intervals, whereas others may be dormant for hundreds, or thousands of years, then can erupt several times in quick succession.
Prediction
The regularity with which a volcano erupts helps scientists to predict when it might erupt again. They monitor tiny earthquakes and changes in the shape of the volcano, which suggest that an eruption is imminent.
There are warning signs before most volcanic eruptions. Volcanologists monitor these changes using GPS, tilt meters, satellites, seismometers, and gas detection.
Signs of an eruption include:
Magma rising - detected by heat sensors and satellites
Ground deformation - caused by rising magma
Increased gas emissions
Increased seismic activity - detected by seismometers
Forms of Hazards
Primary Hazards
Nuées Ardentes
A highly destructive, fast moving, mass of gas-enveloped particles.
Consists of two parts
the ‘glowing’ avalanche - the lower, denser pyroclastic flow.
the lighter volcanic gases, ash and dust.
Formation
Collapse of eruption column
Boiling over from eruption vent - no formation of plume.
Collapse of lava domes or flows.
Impact
Destroy virtually everything in their path.
Pyroclastic Flow
Extremely hot mixture of volcanic gas, ash, and rock that flows down the sides of the volcano
Travels at high speeds - often 80km/h
Travels a long way - around 10-15 km
Impact
Widespread death
Destruction
Lava Flow
Molten rock which flows out of a volcano or volcanic vent.
The speed of the flow and the distance it travels depends on its temperature and viscosity.
Low viscosity (such as Basaltic) lava can flow at up to 10km/h on a steep slope and can travel far.
Viscous flows are cooler and travel shorter distances. These can build into lava domes or plugs.
Impact
Most can be avoided
Can cause server burns to people
Destroy everything in their path by burning, burying, or knocking down.
Buildings
Vegetation
Volcanic Gases
Lava contains gases such as carbon dioxide and sulphur dioxide which are released in large quantities.
These gases dissolved in the magma provide the driving force that causes most volcanic eruptions
Formation
As magma rises, pressure decreases.
This releases the dissolved gases which eventually reach the atmosphere.
Gases can often escape continuously even if the magma never reaches the surface.
Can be released through soil, volcanic vents, fumaroles, and hydrothermal systems
Impacts
These gases can be hazardous to human and animal health
Can cause respiratory problems and deaths
Pyroclastic and Ash Fallout
Pyroclastic fallout is material that has been ejected from a volcano during an eruption and falls back to the ground.
When fallout consists mostly of ash (material under 2mms in size), it is called ash fallout.
Fallout consists of material of a range of sizes.
Tephra is a general term used to define all sized particles of igneous rock ejected from an eruption.
Material can travel thousands of kilometres from the volcano.
Heavier particles are deposited earlier.
Impacts
Larger tephra can
damage buildings
kill or injure people
Finer material can settle in layers
killing vegetation
hinder road and rail transportation
cause buildings to collapse
Finer material can
Reflect light and heat from the sun causing the temperature to drop, resulting in temporary ‘volcanic winter.’
Mix with precipitation and form acid rain.
Secondary Hazards
Lahars
Mudflows occur when volcanic material (tephra) mixes with large amounts of water, from rainfall, or from melted snow and ice.
These are fast flowing (over 80km/h) and travel tens of kilometres.
Impacts
Can bury and destroy natural habitats, settlements and infrastructure.
Sweep away everything in its path including people, houses, bridges, and vegetation.
Once it stops, it settles like concrete.
Acid Rain
Precipitation that contains acidic components such as sulphuric acid.
Formation
Volcanic gases react with water vapour in the atmosphere to form acidic rain.
Impacts
Damages ecosystems
Damage crops and vegetation
Can cause stone and metal to deteriorate, damaging buildings, bridges, statues, etc.
Impacts and Management
Primary Impact | Secondary Impact | |
Social | Deaths and injuries Displacement Damage to properties and infrastructure. Ash can cause respiratory problems, eye and skin irritation. | Ash can result in silicosis. Mental health issues - stress, anxiety, depression. Homelessness Disruption to services such as healthcare and education. Loss of cultural heritage sites. |
Economic | Destruction of property and infrastructure. Disruption of trade and economic activity Loss of income and employment Costs of immediate responses | Slower economic growth and development Increased economic inequality as impacts are more severe for most vulnerable people Increased costs of insurance and hazard management strategies Tourist attraction, boosting the economy |
Environmental | Poor air and water quality Loss of biodiversity Destruction of habitats and ecosystems - impacting agriculture | Increased rate of stream runoff. Acid rain can damage ecosystems Release of GHG can lead to a rise in global temperatures Ash clouds can lead to a fall in global temperatures |
Political | Pressure on governments to co-ordinate emergency response Social unrest and political instability | Conflicts over government response and food shortages Changes in government policy and regulations to reduce future risk. |
Management and Responses
Short-term | Long-term |
Evacuation Search and rescue Emergency aid | Hazard mapping and land use zoning Building codes - creating a set of codes to increase the resilience of buildings. Education and training. |
Responses can also be categorised as prevention, preparedness, mitigation, and adaptation.
Prevention
It is not possible to prevent a volcanic eruption.
It is possible to prevent the eruption posing a risk
Restrict access
Prevent building in high-risk areas
Preparedness
The measures ensure that people are ready to respond to volcanic hazards.
Monitoring systems
Contingency planning such as hazard maps to identify most at risk areas.
Mitigation
The measures that aim to stop the volcanic eruption posing a threat to populations through direct intervention to the volcano.
Walls or embankments to divert lava flows away from populated areas
Adaptation
How people change their behaviour to minimise the risks and maximise the benefits.
Buildings can be strengthened
Capitalise on opportunities of living near the volcano
Tourism
Farming
Case Study: Mount Etna
Located on Sicily, Italy (the largest island in the Mediterranean), Mount Etna is an active stratovolcano approximately 3329 metres high, covering 1250 km². It has primarily explosive and effusive eruptions, with lava fountains, lava flows, and ash plumes. Mount Etna is one of the most active volcanoes in the world, it also has one of the world’s longest documented eruptions dating back to 1500 BC.
Mount Etna has 3 prominent craters which erupt lava and ash, but its most prominent feature is the “Valle del Bove.” Created approximately 6000BC, Valle del Bove is a 5-10km caldera (depression) that was created after a massive eruption caused a huge landslide. There are a number of secondary vents and cinder cones that are constructed over the vents of lava flows on the lower flanks.
Geology:
The stratovolcano has a classic conical shape but has complex craters and numerous secondary (parasitic) cones and fissures.
Mount Etna is situated at the intersection of the African and Eurasian tectonic plates, where the African plate is being subducted beneath the Eurasian plate.
Causes of eruptions
Theories suggest that the causes of the eruptions are linked to rifting. Associated with constructive plate boundaries such as that separating eastern Sicily from the rest of Italy, rifting may be the cause of the eruptions but there is no agreement on the exact cause.
One theory suggests that the volcano is over a hot-spot or mantle-plume.
Another theory believes that the subduction of the African plate is the main cause.
It erupts basaltic lava, which has a low viscosity and therefore travels far. These are classified as strombolian-type eruptions with short lava flows.
Valle del Bove is the result of the eastern slopes collapsing. It is layered with ancient and recent lava flows.
The fertile slopes are home to over 900000 people.
Management:
Mount Etna is continuously, carefully monitored. The Catania Section of the Instituto Nazionale di Geofisica e Vuclanolgia (INGV) has a permanent network of remote sensors on the volcano. This records data continuously, this is then integrated with observations, surveys and laboratory analysis to issue appropriate warnings.
Perception of Risk
There are many perceptions of the risk and threat of Mount Etna, it depends on one’s proximity to the volcano, understanding of volcanic science, and exposure to media coverage.
Local Residents
Mount Etna is a part of everyday life. Local residents are used to small, frequent lava flows, ash plumes, and occasional seismic activity. Some view the volcano as a source of livelihood, the fertile soils supports agriculture, especially vineyards and citrus fruits.
Some locals are simply complacent, yet there still is awareness of the potential for more dangerous eruptions.
Scientists and Experts
Scientists have a more nuanced understanding, therefore constantly monitor the volcano using satellites, seismic networks, and ground-based instruments.
The volcano poses a moderate to high risk to the local population. The risk assessment is dynamic and changes constantly, so experts continuously monitor for early warning signs.
Activity: November 2002
Immediately before midnight on 26 October 2002, a new flank (side) eruption began on Mount Etna. The eruption ended after 3 months and 2 days, on 28 January 2003. It was a VEI 3.
The eruption occurred from fissures on two sides, at about 2750m on the southern flank and at elevations between 2500 and 1850m on the northeastern flank.
The nature of the eruption was Strombolian, Hawaiian fountaining and phreatomagmatic. Strombolian eruptions are moderately explosive eruptions of basaltic magma with moderate gas content. Hawaiian eruptions are non-explosive eruptions of lava fountains that generate red-hot lava rivers of basaltic lava. Phreatomagmatic is a type of explosive eruption that results from magma erupting through water.
Impacts
Social
Damaged more than 100 homes in Santa Venerina - a town to the southeast of the volcano.
1000 people had to evacuate their homes in Linguaglossa.
Schools were shut down in Linguaglossa, but the church remained open to allow people to pray.
Lava destroyed springs and water supply was disrupted.
Economic
Catania airport was closed for 4 days as ash was covering the runway and threatened to clog aircraft engines. Catania serves as a major hub of air travel in eastern Sicily. Ash fall also affected roads making travel hazardous.
Tourism was heavily affected. The skiing season was about to start but the area was covered by flowing lava. A tourist station at Piano Provenzana was destroyed.
Lava flows engulfed a restaurant and pushed over three ski-lift pylons
The ash fall caused damage to crops, especially in areas where ash accumulation was heavy. This lead to an economic loss for farmers.
Millions had to take out insurance claims for property damage.
Environmental
The eruption resulted in a series of earthquakes, measuring up to 4.3 on the Richter scale.
Ash deposited material as far away as Libya, Africa, 600km away.
The lava flows destroyed hundreds of hectares of forest on the slopes, Crops, orange groves, vineyards, chestnuts and hazel groves were destroyed.
Responses
Short-term/ Immediate
The Italian Army’s heavy equipment was brought in to block and divert lava flows. Tarmac was cracked and barriers were built to create a channel to redirect the lava away from populated areas. Similarly, emergency workers dug channels to divert the northern flow away from Linguaglossa.
Holiday homes were taken over by local authorities to house the displaced.
Residential areas at risk from the lava flows, such as Linguaglossa, were evacuated. However, the residents of Linguaglossa paraded their patron saint through the town to ward off the lava flow.
The Italian government declared a state of emergency in parts of Sicily.
The monitoring station at the foot of Mount Etna was at risk of being engulfed by the lava flows, so rescue workers battled to divert it.
A ship with a medical clinic was positioned off Catania in case of emergency.
Long-term
The Italian government gave tax breaks to the 300 families who were affected by the eruption, along with providing more than £5.6 million in immediate financial assistance.
Tourist facilities were rebuilt.
Mitigation
Reforestation
Evacuation of people from Nicolosi
Dams of soil and volcanic rock were put up to protect the tourist base.
Adaptation
Buildings were strengthened to reduce risk of collapse from the weight of the ash.
Management plans were put in place
Mount Etna is used for tourism to generate local income.
Risk Management
Development of evacuation plans and emergency supplies
Constant monitoring.
Case Study: Montserrat 1997
Seismic 🌍
Formation
Earthquakes occur when friction along plate boundaries build stresses in the lithosphere.When the strength of the rock under stress is suddenly released, they fracture along cracks in the crust called faults. These send a series of shockwaves to the surface. Earthquake tremors usually last less than 1 minute, but are followed by aftershocks as the crust settles into its new position.
The point at which the stress is released below the surface is called the focus of the earthquake.
The point directly above the focus on the Earth’s surface is the epicentre.
Shaking is most intense at the epicentre, the further out from it the less severe as the waves dissipate.
Distribution
The majority of earthquakes, about 95%, occur close to or at a plate margin. Many occur around the Ring of Fire.
Earthquakes occur at all plate boundaries, however some boundaries are more seismically active than others. The nature and magnitude is affected by three main factors:
Margin Type
The biggest earthquakes occur at destructive margins. The subduction of a plate causes massive pressure to build up, causing a high magnitude earthquake.
Earthquakes at constructive margins tend to be lower magnitude than destructive or conservative margins.
Rate of Movement
There is no clear relationship between movement and earthquake magnitude, but the rate of movement can impact the frequency and magnitude.
Depth of Focus
Deep focus earthquakes tend to be higher magnitude than shallow focus earthquakes.
However, deep focus earthquakes generally do less damage as the shockwaves generated have to travel further to the surface reducing their power.
Earthquakes can occur at hot spots and at the location of old fault lines
EXAMPLE: Great Glen fault line and the Highland Boundary fault in Scotland.
They can occur because of human activity such as fracking.
Fracking has caused many earthquakes such as some in Ohio, Alabama, and Colorado.
Fracking is hydraulic fracturing of rock to collect gas.
Magnitude
Earthquakes can be measured using 3 different scales:
Richter Scale
Measures the magnitude of an earthquake.
It doesn’t have an upper limit
Logarithmic scale.
Moment Magnitude Scale (MMS)
Based on the total amount of energy released by an earthquake.
It doesn’t have an upper limit
Logarithmic scale
More accurate than the Richter Scale
Mercalli Scale
Measures the impacts of an earthquake using observations of the event.
The scale is between 1 and 12.
12 being total destruction.
Measures intensity.
Frequency
Low magnitude earthquakes occur much more frequently than high magnitude earthquakes.
There are around 20,000 earthquakes around the world every year.
Equates to around 55 per day.
Most of these are low magnitude and may not even be felt by humans.
According to records from 1900, it can be expected to experience around 16 major earthquakes (magnitude 7 or greater) every year.
Some years there are more major earthquakes than the long-term average
EXAMPLE: 2010, there were 23 major earthquakes
Other years there are less.
EXAMPLE: 1989, there were only 6
Seismic Gap Theory suggests that if there has been little or no earthquake activity at a plate margin for a long period of time, it is more likely to experience a large earthquake in future.
This is because stress will have built up for longer, so more energy will be released.
The theory has been used to identify areas at higher risk of large earthquakes.
However, it is not precise and not all seismic gaps result in large earthquakes.
Prediction
Predicting earthquakes is not possible, but understanding plate tectonics allows seismologists to know which areas are most at risk.
Scientists are constantly researching to improve forecasting - research has focussed on monitoring:
Pre-cursor earthquakes (foreshocks)
Measured using seismometers
May indicate that a larger earthquake will follow.
Deformation
Measured using strainmeters and tiltmeters
It might indicate that pressure is building
Groundwater levels
Measured using sensors
Water levels in wells can rise or fall suddenly indicating that an earthquake may be imminent
Radon Emissions
Measured using radon detectors
Concentrations of the gas in the atmosphere can increase prior to an earthquake
Animal Behaviour
Unusual behaviour can indicate that an earthquake might be about to happen.
No method of prediction has yet proved to be reliable.
Forms of Hazards
Primary Hazards
Shockwaves
Primary (P) Waves
Body wave
Fastest
Reaches the surface first
Travel through liquids and solids
Cause backwards and forwards shaking.
Least damaging
Secondary (S) Wave
Body wave
Slower than P waves
Only travels through solids
Cause a sideways motion
More damaging
Love (L) Wave
Surface wave
Slowest
Cause a side-to-side motion
Larger and energy is focused on the surface
Most damaging
Impact
Cause damage or instability to buildings and infrastructure
Affects wildlife and habitats
Liquefaction
Occurs when the shaking causes loose or saturated soils to lose their strength.
This causes them to act like a liquid rather than a solid.
Impacts
Can result in significant damage to buildings and infrastructure.
Foundations sink and the building collapses
Can open large cracks or fissures in the ground
Landslides
A landslide is the downward movement of soil and rock on a slope.
Formation
The intense shaking may trigger the collapse of material downhill.
The risk of landslides is greater where soils are looser, slopes are steeper and where the shaking lasts longer.
Impacts
Falling rocks and debris
Block roads and disrupt utility lines
Secondary Hazards
Tsunamis
Large waves caused by the displacement of large volumes of water.
Formation
When an earthquake occurs beneath the sea bed this can lead to a tsunami.
The greater the movement of the sea floor, the greater the volume displaced, and the bigger the wave produced.
Impacts
Destroy houses
Leave people homeless
Uproot trees
EXAMPLE: 2011 Tohoku earthquake in Japan triggered tsunami waves of up to 40 metres which travelled inland for several kilometres in some areas.
Impacts and Management
Primary Impact | Secondary Impact | |
Social | Death and Injuries Displacement of People Damage to properties and infrastructure. | Homelessness Mental health issues Disruption to services Loss of cultural heritage sites. Liquefaction - gas lines and power lines can break starting fires that kill more people. Lack of clean water can cause disease to spread. Tsunamis can flood large areas, killing people. |
Economic | Destroy Business premises - damaging the economy. | Damage to industry may mean reliance on expensive imports. |
Environmental | Contamination of water supplies. Industrial units can cause chemical and/or radioactive material to leak. | Fires can destroy ecosystems. Tsunamis can flood freshwater ecosystems, killing plants and animals, and salinising water and soil. Tsunamis cause flooding, erosion, and damage to coastal ecosystems. |
Political | Pressure on governments to co-ordinate emergency response Social unrest and political instability | Conflicts over government response and food shortage Changes in government policy and regulations to reduce future risk |
Management and Responses
Short-term | Long-term |
Search and rescue - using sniffer dogs and heat sensors to locate survivors and rescue them Emergency aid Evacuation - moving people out of the danger zone when a tsunami warning has been issued (not possible before an earthquake) Issue a warning - via text, TV, and radio as soon as an earthquake happens underground before the seismic waves reach the surface. | Building codes - increase the resilience of buildings to earthquakes Education and training - preparing communities to improve evacuation and response through regular drills. EXAMPLE: Japan’s Disaster Prevention Day, September 1st. Early warning systems Hazard mapping and land use zoning - identifying the most at risk areas of liquefaction or tsunamis. |
Responses can also be categorised as prevention, preparedness, mitigation, and adaptation.
Prevention
It is impossible.
Preparedness
Ensure people are ready to respond
Monitoring and warning systems
Plan how to respond
staying away from buildings
finding a strong desk or doorframe
Evacuation routes
Mitigation
Aims to reduce the threat.
Building tsunami walls
EXAMPLE: since 2011, Japan has built over 400km of tsunami wall
Making buildings earthquake-resistant
Using cross-bracing, shutters on windows
‘Smart meters’ are installed to shut down gas supplies automatically in an earthquake
To reduce the risk of fire.
Adaptation
Changes in behaviour to reduce risk.
Better evacuation routes
Citizens are advised to keep some supplies to help with evacuation and survival
Case Study: Haiti 2010
220000 killed
250000 injured
Case Study: Kobe, Japan
/
On January 17th 1995, an earthquake devastated Kobe, Japan. The Great Hanshin Earthquake, of magnitude 7.3 on the Richter scale , had a shallow focus making it the costliest urban disaster up to that point in time, economic damage was put up to $100 billion. The earthquake hit at 5:46 am, lasting about 20 seconds. The epicentre was 20km from the port city of Kobe and the focus was 16km below the earth’s surface.
The Hanshin region is Japan’s second largest urban area with a population more than 11 million inhabitants. Roughly 6400 people were killed, over 35000 injured and nearly a quarter million people were made homeless. Only 3% of the city’s buildings were insured and in excess of 240000 damaged homes. Kobe was the hardest hit city with 4571 fatalities, more than 14000 injured. Additionally, Kobe was also struck by a typhoon six months after the earthquake.
Responses
Electric power, gas, water, telecommunications, and communication infrastructure were restored within months
48000 housing units had been supplied to those who were made homeless, who made up 20% of the city’s population.
70% of the port operations were restored within one year
almost all of the debris was removed with 60% of it successfully re-used in landfill sites.
15 months after, the manufacturing was 96% of what it used to be.
The Japanese Government issued a document of new policies towards such disaster-stricken areas.
“The objective of providing the recovery and reconstruction of a disaster-stricken area is to aid victims to return to normal life, restore facilities with the intention of preventing disasters in the future, and implementing fundamental development plans that focus on safety in the community. In view of the decline in social activities in a community following a disaster, it is important that recovery and reconstruction measures are conducted as swiftly and smoothly as possible.”
Adaption and Mitigation
Improved seismic resistance of existing buildings
Improved the fire fighting capacity
Protection of lifelines
Backup systems were put in place wherever possible, despite the cost. Telecommunications, for example, were reconstructed a duplicate fibre optic system.
Community participation through awareness and education programs
Including the stockpiling of resources, the ability of ordinary people to fight fires and the availability of basic tools for search and rescue,
Non-governmental Organisations
NGOs were encouraged help where official bodies did not seem flexible.
Disaster-resistant measures
A variety of measures had been proposed to protect from; earthquakes, fires, landslides, and typhoons. This includes firebreaks along rivers and roadways, a mountain greenbelt in order to reduce landslides, a new canal system to ensure a reliable water supply and backup systems for hospitals.
Risk and Vulnerability
Storms 🌪
Formation
A tropical storm is a low pressure, spinning storm with high winds and torrential rain. It can only form when certain conditions are met:
Temperature: Ocean temperatures must be around 26-27 degrees Celsius and the ocean needs to be at least 50 meters deep. This provides the storm with energy.
Air Pressure: There must be unstable air pressure - typically areas where low and high pressure meet, at areas of convergence - so that warm air rises more rapidly and clouds can form.
Wind Shear: Winds must be present for the swirling motion to form, it cannot be too strong or the storm system will be ripped apart.
Rotation: Tropical storms only form around the equator, but no less than 5 degrees on either side. Typically they form in a band between 8 degrees and 20. The Coriolis Effect is the effect of the Earth’s rotation on weather events.
A trigger: A pre-existing thunderstorm, a spot of very high sea surface temperature, an area of low pressure and many other factors can act as a trigger for a storm to develop, which will only further develop when the other conditions are present.
Warm, moist air rises quickly forming an area of intense low pressure
Air from high pressure areas rushes in to take the place of the rising air, generating strong winds.
This air then rises forming a continuous flow of rising air.
As the air rises, it cools and condenses forming large cumulonimbus clouds.
These clouds form the eye wall of the storm and produce heavy rainfall.
Condensation releases energy in the form of latent heat, which helps to power the storm.
Air at the top of the storm goes outwards away from the centre of the storm.
The Coriolis effect causes the rising air to spiral around the centre.
Cold air sinks at the centre, creating a calm, dry area known as the eye.
Tropical storms will die out if the heat energy and moisture from the ocean are no longer available to drive the storm.
Characteristics
Heavy rainfall
High wind speeds
over 119km
High waves and storm surges
Distribution
Due to how tropical storms form, they are only found in a band between 8 and 20° around the Equator.
They are not formed at the equator because the Coriolis Effect is not strong enough.
They spin anticlockwise in the northern hemisphere and clockwise in the southern hemisphere.
Magnitude
The magnitude of storms are measured using the Saffir-Simpson Hurricane Scale. This scale is based on the wind speed.
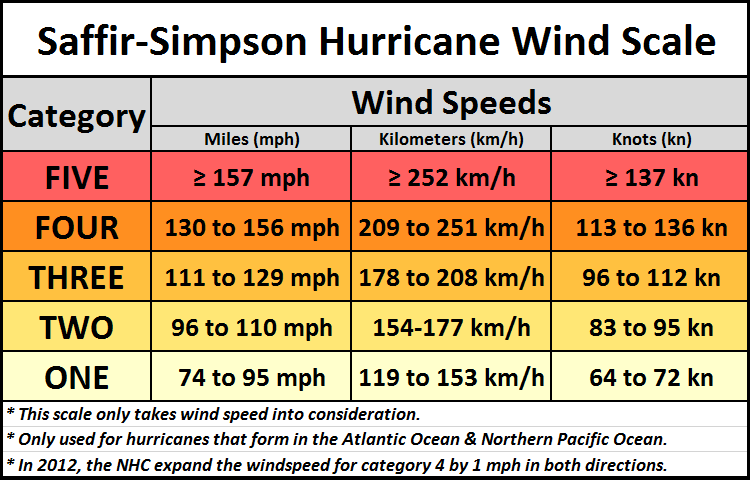
Category 1 is the weakest and Category 5 is the strongest. Tropical storms are considered major when they reach category 3.
Other factors such as the amount of rainfall, storm surges and the nature of the area affected also play a significant role. For this reason, the Saffir-Simpson scale alone is not necessarily an accurate prediction of the likely impact of a storm.
Frequency
Frequency: The rate at which storms occur over a period of time.
Regularity: The pattern of storm occurrences, how much there is a pattern ie most likely September-October in USA.
Tropical storms are relatively frequent in many parts of the world, but the frequency can vary significantly from year to year. On average, there are about 80 tropical storms each year.
Tropical storms tend to occur during tropical storm season.
In the Northern Hemisphere
the season runs from June to November
Peak months in August, September, and October.
In the Southern Hemisphere
the season runs from November to April
Peak months in January, February and March
The Center for Climate and Energy Solutions stated that the average number of tropical storms between 1966 and 2009 was about 11 annually, with about 6 becoming hurricanes. However, more recently, the average is over 15 tropical storms annually, including about 7 hurricanes. “This increase in frequency is correlated with the rise in North Atlantic sea surface temperatures, which could be partially related to global warming.”
Predictability
Predicting hurricanes falls into two categories; seasonal probabilities (predicting the regularity) and the track of a current hurricane. These use different methods and approaches, but overall storms are predicted using satellite images and even Doppler radar.
Predicting the Regularity of Hurricanes
The regularity of a season can be predicted using elementary statistics such as the wind speeds. The sustained wind speed follows the Poisson Distribution with fairly consistent accuracy. Named storms are typically predicted based on past occurrences and current measures of climatic factors, but these are only probabilities never certainties.
Predicting the Routes
The path of hurricanes and storms can usually be predicted 3 to 5 days in advance. At first, the possible trajectory is usually represented as a cone, this shrinks over time along with the degree of error. Many different models are used, such as CLIPER (Climate and Persistence), NHC90, and BAM, these take measurements multiple times a day. Intensity models are essential to understanding how dangerous a hurricane will be when it makes landfall. Accurate assessments allow people to take appropriate actions like evacuating or preparing homes.
Problems
The accuracy of prediction is a major problem. The National Hurricane Centre has been forecasting the path of hurricanes since the early 1950s, they issue 120 hour, 96, 72, 48, 24 and 12 hour forecast. The error decreases as the time before landfall decreases but still remains relatively large. These errors have substantial effect on the damage done to a certain area; the difference of 100 miles could determine whether someone evacuates or not, therefore the errors could be at the cost of lives.
There are problems with predicting the intensity, in some cases there are unforeseen factors that greatly impact the hurricanes intensity. One of the most common causes of a sudden intensity increase in the Gulf of Mexico is the Loop Current, a stream of deep warm water that provides a lot of fuel to a hurricane. The Loop Current intensifies hurricanes as it causes the storm to churn up more warm water instead of cooling the water decreasing the strength. It makes prediction difficult as it changes position, depth, and strength over the years.
Time is another problem in predicting hurricanes. Scientists cannot make a prediction early enough for cities to be completely prepared. There is no certainty until it is too late to respond.
Flood Risk
Prediction has great relevance to the flood risk of an area. The National Flood Insurance Program (NFIP) have created different classifications of flood zones. In New Orleans, the common flood zones are A, V and B zones. Places in A zones from 0-30 are below the base flood elevation putting them at higher risk than other areas. B zones are above base elevation but may still flood. V zones are below the base elevation, like A zones, but are at a higher risk due to the danger of storm surges, these tend to be found along the coast of Lake Ponchartrain. Flood risk is directly proportional to the probability of being hit by a hurricane, the elevation of the land, and the proximity of an area to a major body of water.
The National Hurricane Centre
The National Hurricane Centre is responsible for forecasting all tropical storm activity in the Atlantic and Eastern Pacific basins around North America. They predict the track, intensity, size, and structure of all hazards associated with tropical storms.
The NHC process begins with available observations:
satellite
reconnaissance aircraft
ships
buoys
radar
other land-based platforms
These are important tools used in hurricane tracking and prediction.
Satellite data is used to estimate characteristics of a storm, including the location of its centre, its past motion, and its intensity. Once an Atlantic hurricane becomes a threat to land, it is directly monitored by US Air Force and NOAA hurricane aircraft, dropsondes, and land stations. Reconnaissance Coordination are flights where data is transmitted back to the CARCAH, checked for errors and given to NHC and the public. As the storm approaches within 450km of the coast, land-based radars provide critical precipitation and wind velocity data.
All the data is gathered from various observational platforms, examined, quality controlled and used to initialise a suite of models. These models create computer-generated predictions of a hurricane’s future track and intensity.
Official hurricane forecasts and warnings are created when the results from hurricane forecast models are interpreted. Continuous watch is maintained. When a storm hits, a complete set of advisory products are issued every 6 hours, this can be every 2 hours when land-based radars can provide reliable fixes on a storm’s centre.
Forms of Hazards
Primary Hazards
High Winds
Often over 119km/h
Impact
Uproot trees
Damage infrastructure and buildings
Cause Injuries
Loss of life
Heavy rainfall
As warm, moist air rises and cools, it causes torrential rain
Impact
Causes secondary hazards
Storm surges
Occur when large volumes of water are forded inland by the low pressure and strong winds.
Waves can be 5-10 meters high
Impacts
Cause extensive flooding
Erode beaches
Damage sea defences
Contaminate farmland and freshwater
Cause of 90% of deaths in tropical storms
Secondary Hazards
Coastal and River Flooding
Caused by intense rainfall and storm surges
Can affect large areas of low-lying land
Impacts
Similar to Storm Surges
Landslides
Trigged as the soil becomes saturated due to intense rainfall
This increases the weight of the soil and makes it unstable
Secondary Hazards
Tends to be a result of the heavy rainfall.
Flooding
Landslides
Impacts and Management
Primary Impact | Secondary Impact | |
Social | Drowning, deaths and injury by debris blown or carried flood water. Damage to homes and property. | Electricity cables can be damaged and supplies are cut off. Spread of diseases from contaminated water. |
Economic | Destruction of property Loss of income and employment | Agricultural land is damaged affecting commercial farming. |
Environmental | Beaches and coastal habitats are eroded and damaged. Environments are polluted, | Landslides can block watercourses. |
Political | Social unrest and political instability | Changes in government policy and regulations to reduce future risk |
Management and Responses
Short-term | Long-term |
Evacuation before the storm arrives Rescue people before the storm cuts |
Responses can also be categorised as prevention, preparedness, mitigation, and adaptation.
Prevention
Preparedness
Mitigation
Adaptation
Case Study: Hurricane Katrina
Case Study: Hurricane Katrina (2005), Louisiana (LA) and Mississippi (MS), USA
Mississippi’s geography places it a vulnerability
Poorest state in America
Louisiana at risk because of loss of barrier islands and wetlands
industry and urban expansion
New Orleans, (LA), below sea level, protected by levees
Levees falling into disrepair
Slowly sinking
hurricanes serious threat to both cities
Disconnect between academics and reality
Wednesday 24 August
Official tropical storm
Thursday 25
strengthens 80mph winds
landfalls in Florida
caught of guard of winds
Travels west southwest, strengthening in Gulf of Mexico
Friday 26
Category 3 strength
reports in MS
LA no change in activity
intensifies each hour
Governors call state of emergency
MS ask people to evacuate, recommendation
Most in LA focused on the game
Saturday 27
category 3
MS evacuation swiftly
LA finally urgency of evacuation
Bush approves LAs request of federal emergency
All highways become one way in both states
Evacuation is slow in LA, only recommendation
20% of LA population live around New Orleans
Gaining strength
Sunday 28
Category 4
160mph winds and hour later, category 5
MS mandatary evacuation
Finally announce evacuation emergency LA
For many its too late
1.8 million evacuated in LA
Poorer residents don’t have the opportunity to
Buses transport people to shelters of last resort
high school
super dome
More 100000 people stayed behind in New Orleans
MS, by nightfall coastline is abandoned
Monday 29
2am losing strength
6am landfall
80 miles south of New Orleans, Katrina hits
New Orleans, storm surges
Lakes overflow
Main issue
6:30am surge of water into levees
slide and buckle
7am
70-80mph winds
cellphone lines go down
power lines go down
Storm rips roof of super dome
9am
eye passes MS coast
10ft higher storm surges in MS than LS
18 miles of coastline hit by storm surges
Hurricane system was huge
Tornados hit north in MS
Afternoon
begins to dissipate
MS worst is over
LA disaster still going
High School shelter, flooding
lost provisionals
5pm
survey of damage in helicopter
reports only acted upon the next day
Tuesday 30
National response plan enacted
LA response was difficult due to political gap
MS got help quickly because of political links
High School
8ft, reaches second floor
250 initially to 1200 people
only 4 hospitals remained open
MS
ocean front downs wiped clean
surge waters receded
response begins
Super dome
Conditions deteriorate
buses for evacuation never came
Flood waters seal off city
Wednesday 31
LA - Coastguard, Volunteers
saved 1000
LA - Corpses in streets, in flood waters
Death Toll 1500 in LA
Sunday 4 September
Last evacuations from Super Dome
MS - political allies, response was quick
5 billion allocated to rebuild within 6 months
architectural plans
LA -
governor only had been in a term
less political clout
recovery proposal questioned and denied
political stance instead of human response
no single school opens in LA
Musicians Village Organisation
80 homes built
5 states overall affected by Katrina
LA and MS impacted most
Wetland Restoration in LA to prevent damage again
still being eroded
Army Coorps
restoration and development of better protection
Case Study: Typhoon Haiyan
8th Nov 2013
over 5000 dead
storm surge caused the most damage
Developed in the Pacific
No panic, used to typhoons
Nov 3rd potential to be super typhoon
Hits east coast of Philippines
195mph sustained winds
No sign of weakening even after landfall
2 hours after landfall, climax of storm hits
hospital patients moved to basement
15-20 ft storm surge
escape to upper floors was risky due to roofs being ripped apart
escape to lower floors was risky due to storm surge being equivalent to tsunami
forecaster did not predict storm surge
Philippines are used to storms not storm surge
Conditions were perfect to turn into a ‘super typhoon’
380 miles across
No immediate help
no water
no food
no shelter
some places so remote aid was slow
Business were destroyed
looting occurred
no choice
warehouses wiped clean
UN warns that international aid is not arriving fast enough
25th Nov British aircraft carrier arrived with tonnes of aid
including tonnes of rice
Boats smashed and roads broken
Helicopters were the only way of helping
Aid organisations
Save the Children
biggest fears amongst people was lack of food
Multi hazardous but socially vulnerable
poverty forces people to live in the most hazardous zones
2000 people missing
families had to bury their children
quick burials
1 million homes damaged
500000 houses destroyed
Small business destroyed
grocery stored reopened destroyed building into relief centre
inflatable hospital opened
rising sea level increased the deadliness of storm surge
£3.6 billion estimated for reconstruction
Fire in Nature 🔥
Formation
Distribution
Magnitude
Frequency
Predictability
Forms of Hazards
Impacts and Management
Primary Impact | Secondary Impact | |
Social | ||
Economic | ||
Environmental | ||
Political |
Management and Responses
Short-term | Long-term |
Responses can also be categorised as prevention, preparedness, mitigation, and adaptation.
Prevention
Preparedness
Mitigation
Adaptation
Case Study: Alberta, Canada
Example for wildfires but Also local case study for a hazardous setting.
‘The Beast’ - Fort McMurray, Alberta, Canada, May 2016
Beacon Hills hardest hit
80% of homes destroyed in Beacon Hills
10000 evacuated homes
highway 63 closed
16000 structures burned
province declared a state of emergency
250 firefighters
the wind direction changed fuelling the fire
Helicopter and Aircraft sent from Ontario
government matched donations made to red cross
red cross
deployed volunteers to support evacuees
provided resources to evacuees
88000 people forced to flee their homes - mandatory
matter of minutes to leave.
2 hours to leave