Unit 1: Thinking Geographically
Maps
-Each map projection struggles with distortion in the form of-
shape
area
direction
distance
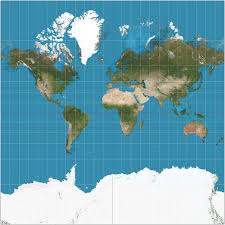
Mercador Projection:
has distortion in shape, area, and size
used for naval expedition
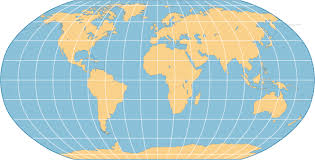
Robinson Projection:
Used for textbooks/atlases
less distortion than other projections
Inaccurate distances
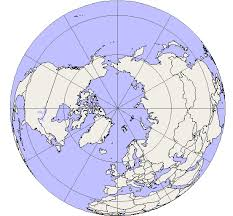
Polar projection (Azimuthal):
Used for pilot navigation
accurate view near center
shows the shortest distance between 2 places
Cannot show large plots of land
Topographic Maps:
designed to show area’s topography
can show infrastructure, rivers, and other physical features
used for land surveying
Thematic Maps:
centered around a central theme
not used for navigation
show data through graphics, colors, lines
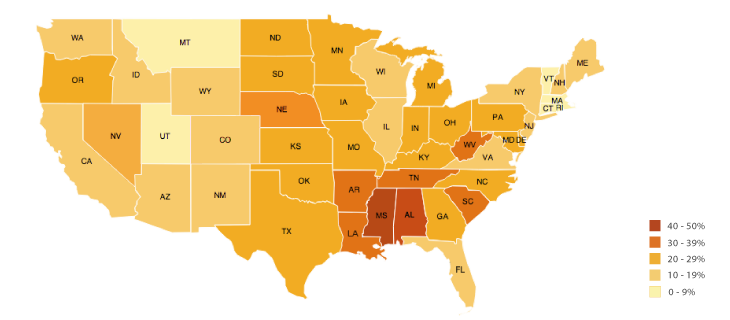
Chloropleth Maps:
Use color variations to express geographic variation
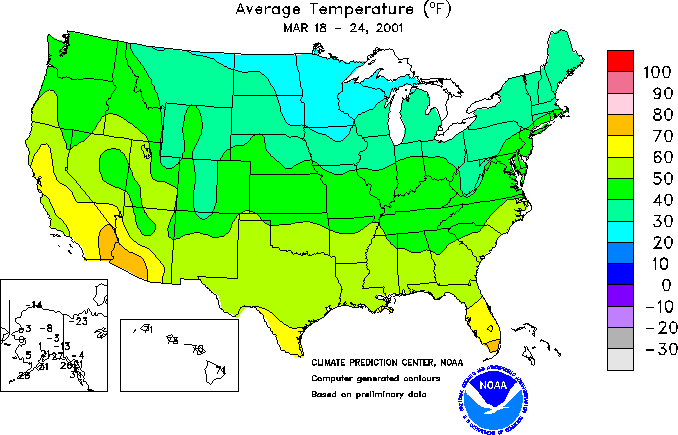
Isoline Map:
Most daily used maps
Use contour lines to separate differently colored regions
Data Collection Sources:
Geographic Information Systems:
Layers data on maps and allows the user to see spatial relationships
Field Observations:
geographer travels to a location to study it
travel narratives, personal interviews
Remote sensing:
collects information from satellites and distance collection systems
Online mapping and visualization:
Ex: Google Earth
Satellite Navigation Systems:
Satellites that provide geo-spatial positioning or exact location
GPS
Qualitative vs. Quantitative Data:
Qualitative data: collects information on people’s belief or feelings about a subject
Quantitative data: collects information based on numbers and statistics (census).
Distance Decay: The idea that places will interact less the farther away they are.
Globalization: The world is more connected due to technology, making it seem smaller.
Time Space Compression: Interaction between far away places becomes instantaneous due to the Internet.
Environmental Sustainability:
Environmental Determinism: The environment sets restrictions on human society, and humans can’t do much about them.
Locations limit growth in society.
Environmental Possibilism: society can shape and modify the environment to meet their needs.
Scale and Scale of Analysis:
Scale of Analysis:
looks at how data is being organized/chunked together.
Global, Regional, National, Sub-national scale of analysis.
Scale: How much of the Earth’s surface the reader is viewing
Small scale map:
Ex: a global map of the world
sees a lot of the Earth’s surface but has few details
Large scale map:
ex: a county map
shows specific places on Earth rather than generalizes.

Regions:
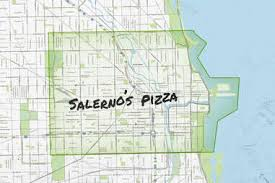
Functional/ Nodal Regions: Areas organized around a node
often based around certain economic, travel, or communication activities.
ex: An area zoned to a school, pizza delivery zone
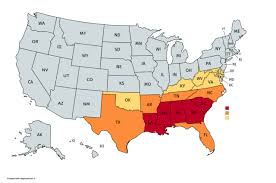
Perceptual/ Vernacular Region:
Regions that don’t have a perfect definition or borders
Exist because of people’s beliefs/ feelings of a region
ex: The Deep South
Formal Region:
Geographic regions with common attributes
ex: State borders