Science Inquiry Skills
Scientific Reports
Hypothesis
Writing An Hypothesis - Always put units even for controlled
“If the independent variables (units) change, then the dependent variables (units) change. “
If a higher concentration of enzyme(catalyst M/L) is used, then the reaction rate will increase.
Independent Variable → Concentration of enzyme/catalyst(mg/L)
Dependent Variable → Rate of reaction(product per unit time)
e.g. If there is a larger number of carbon and hydrogen atoms per alcohol molecule then there will be an increase in the heat of combustion.
Variables
Independent - Cause Whatever is measurable is the independent variable. Must be something measurable (type of alcohol does not count)
Dependent - Effect Responds to the independent variable.
Controlled - Mass(g)/Volume(mL), Do not say ‘amount’,
Experiment
How to make a good experiment? → This all makes a reliable set of results aka repeatable.
Increased Safety Effectivity: Safety goggles, lab coat, hair tied up
Increased Repetition(multiple trials): Reliability, allows calculation of average, and allows anomalies to be identified.
Increased Replication: The entire experiment repeated
Increased Sample Size:
The benefits of increasing these are identifying outliers to determine averages. Higher sample sizes allow for a reduced impact of outliers/anomalies on the average.
Reliable Results: Results are reproducible given the same population and the same process.
Method
Written so that someone is able to repeat the experiment under identical conditions and get similar results. In order to do this, the results must be valid.
How to make valid results: Results are the outcome of a test on a variable that was intended.
Only one independent variable and controlled variables.
A test group
A control group (baseline/comparison) does not include the independent variable
How to make non-accurate results: Through Techniques
Experimental error:
Tools Calibration - digital thermometer
Sanitation - Not cleaning tools
Writing the wrong numbers down
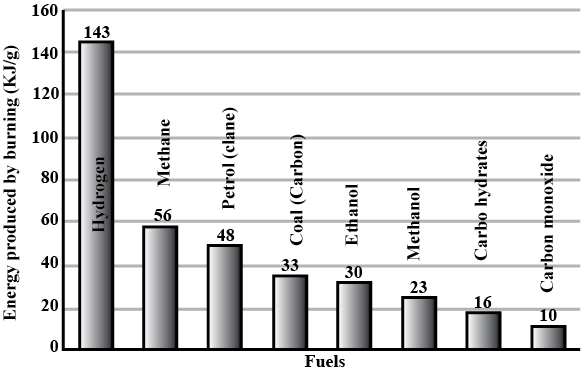
Results - Bar, Histogram, Line etc.
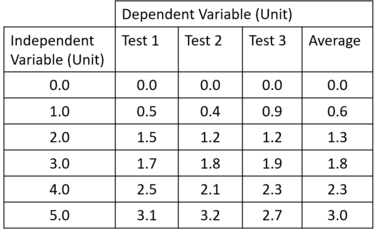
Data is either qualitative (descriptive) or quantitative (numbers) and should be recorded in a table.
x-axis: Independent variable or time (units)
y-axis: dependent variable (measured/units)
Scale breaks: always start at 0 unless you need to
Straight line: Line of best fit for physical sciences (physics and chemistry)
Outlier: Circle it and label outlier
Always start with 0 for graphs
break after 0 is written down.
Conclusion
Hypothesis was/was not partially supported.
Never say PROVED
Restate the hypothesis by stating the trends observed in the results between the independent and dependent variables.
Qualitative results - color change
Quantitative results - two significant data points, averages, if one range shows the significant comparison between independent and dependent then you can use range.
Use quantitative/qualitative data to show how the results support the hypothesis.
Discussion
Evaluate the experiment; where could you have gone wrong? Reliability, accuracy and validity analysis
Reliability
When you repeat an experiment multiple times and getting the same result
Achieved through repetition (multiple trials or larger sample size), replication
(conducting the same investigation)
Average of these results can be taken to identify outliers
Accuracy
Degree of closeness of measurements of a quantity to its actual true value
Real value is the value that is not known beforehand but is usually close to the desired outcome
Achieved using equipment
Validity
The extent to which the tests measure what was intended
Achieved through control variables or a control group
SIS Validation Q’s
Construct a hypothesis
Identify independent and dependent variables
List controlled variables
Write a method
Construct a table and graph to illustrate the findings
Conclusion
Discussion
Where could you have gone wrong?
Source of Errors and how to reduce?
Benefits of repetition?
Safety
Example Responses
Comparative Analysis of Heat of Combustion per Gram of Ethanol and Propan-1-ol in Heating Water
Hypothesis
If combustion of ethanol will result in a higher change of heat of combustion per gram of fuel compared to propan-1-ol, due to the simpler molecular structure and stronger carbon-oxygen bonds in ethanol.
Independent Variable: Type of Alcohol Fuel (Ethanol and Propan-1-ol)
Dependent Variable: Change of Heat of Combustion per Gram of Fuel (measured in joules/gram or another appropriate unit)
Controlled Variables: Mass of alcohol fuel, mass of water, initial temperature of water, water container, thermometer, surface area, environment and ignition source
Results

Graph

Conclusion
The results obtained from the experiment supports the hypothesis that the heat of combustion per gram of ethanol would be higher compared to the propan-1-ol due to differences in their molecular structures and bond energies.
This can be seen as ethanol consistently through multiple trials show a greater change in temperature (insert data) than propan-1-ol whose greatest temperature change was …. This supports the idea that ethanol’s simpler molecular structure with fewer carbons lead to stronger carbon-oxygen bonds and efficient combustion. On the other hand, propan-1-ol’s more complex structure with additional carbon atoms results in weaker carbon-oxygen bonds and less efficient combustion.
Discussion
Validity: The experiment demonstrates good validity as it directly addresses the research question of comparing the heat of combustion per gram of ethanol and propan-1-ol. The chosen variables, methodology, and measurements align with the objective, ensuring the relevance of the data collected.
Reliability: The experiment exhibits a high level of reliability due to its controlled variables, repeated trials, and consistent results. The use of multiple trials for each type of alcohol and careful measurement of masses and temperature changes enhances the reliability of the findings.
Accuracy: The accuracy of the experiment is supported by its attention to detail in measuring the mass of alcohol, mass of water, and temperature changes. However, potential sources of error, such as heat loss to the environment or incomplete combustion, could affect the accuracy of the calculated heat of combustion values.
Overall, the experiment's validity is strong, as it effectively addresses the research question, while its reliability is enhanced through rigorous experimental design. The accuracy is reasonably high, but acknowledging and addressing potential sources of error would further improve the accuracy of the results.
Overall, the design of example one has the most effectiveness in meeting th
Error Analysis - Systematic and Random
Random Error: Temperature fluctuations of surroundings could affect temperature measurements. Fluctuations are not easily controlled and could introduce variability in results. Human reaction time when igniting alcohol fuels and timing duration can affect the accuracy of temperature change measurements.
Systematic Error: A thermometer not being calibrated or inconsistent can lead to improper readings. Uneven insulation could lead to heat loss. Incomplete combustion due to inconsistent oxygen supply or imperfect ignition methods. Results in a lower than expected heat release.