AP Bio Unit 5 Review Notes
Heredity and Meiosis
Today's Plan
Meiosis
Differences between mitosis and meiosis
Genetics: Mendelian, non-Mendelian, and chromosomal
Practice questions
Meiosis
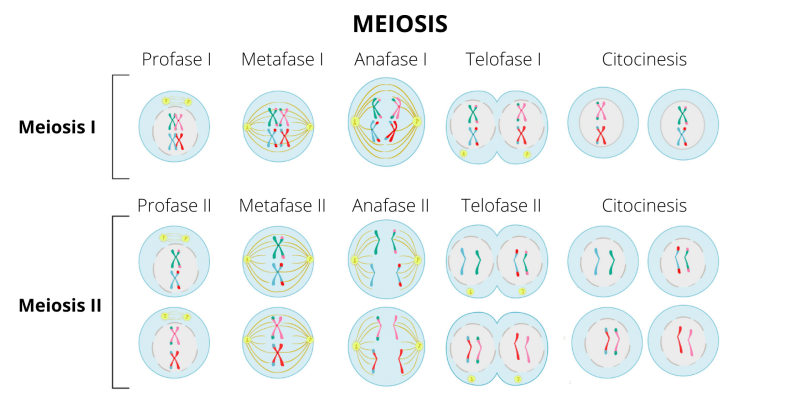
Prophase I
Chromatin condenses.
Sister chromatids and homologous pairs line up.
Crossing over occurs:
Crossing over: Non-sister chromatids from the maternal and paternal chromosomes overlap and exchange genetic information.
Parental chromosomes: Outer chromatids that remain all blue or all pink.
Recombinant chromosomes: Inner chromatids that have exchanged genetic information via crossing over.
Metaphase I
Homologous chromosomes line up on the metaphase plate.
Independent assortment: Maternal and paternal chromosomes line up independently of each other, creating variety in gametes.
Anaphase I
Homologous chromosomes move apart into two new nuclear envelopes.
Telophase I and Cytokinesis
Two haploid cells are formed.
Each cell contains a duplicate chromatid.
No DNA replication is needed between meiosis I and meiosis II.
Meiosis II
Prophase II: Sister chromatids line up, and chromatin condenses.
Metaphase II: Sister chromatids align on the metaphase plate.
Anaphase II: Sister chromatids move apart to opposite poles.
Telophase II: Nuclear envelope forms around haploid nuclei.
Cytokinesis: Four genetically distinct cells are produced.
Gamete Formation
Meiosis creates gametes
Meiosis I deals with homologous chromosomes.
Meiosis II deals with sister chromatids.
⚔ Mitosis vs. Meiosis
Feature | Mitosis | Meiosis |
|---|---|---|
Parent cell ploidy | Diploid (2n) | Diploid (2n) |
Rounds of replication | One | One |
Rounds of division | One | Two |
Daughter cells | Two diploid (2n) cells | Four haploid (n) cells |
Daughter cell identity | Genetically identical to parent cell | Genetically distinct from parent cell due to crossing over and independent assortment |
Crossing over | Does not occur | Occurs in prophase I |
Independent Assortment | Does not occur | Occurs in metaphase I |
Complete Dominance
With complete dominance, the dominant trait completely masks the recessive trait.
This masking occurs because the DNA of the dominant trait produces a functional protein, while the recessive trait either doesn't produce a functional protein or doesn't produce a protein at all.
Homozygous dominant and heterozygous individuals will have the same phenotype because the dominant trait masks the recessive trait.
Co-dominance
In co-dominance, both traits are expressed independently of each other.
For example, if a flower exhibits co-dominance for color, you might see both blue and yellow present in the same flower.
Heterozygous individuals will display both traits.
An example of co-dominance is AB blood type, where individuals with AB blood type have both A and B glycoproteins on their blood cells.
Incomplete Dominance
Incomplete dominance results in a blending of traits.
If you blend blue and yellow, you get green.
Heterozygous individuals will display a blended phenotype.
Monohybrid vs. Dihybrid
Monohybrid: Heterozygous for one trait.
Dihybrid: Heterozygous for two traits.
Ratios
Inheritance Pattern | Genotype | Ratio |
|---|---|---|
Complete Dominance | AA, Aa, aa | 3:1 |
Incomplete/Co-dominance | AA, Aa, aa | 1:2:1 |
Dihybrid (Complete) | AABB, AABb, AAbb, AaBB, AaBb, Aabb, aaBB, aaBb, aabb | 9:3:3:1 |
Dihybrid (Incomplete/Co) | AABB, AABb, AAbb, AaBB, AaBb, Aabb, aaBB, aaBb, aabb | 9:3:3:1 |
Memorizing these ratios can be helpful, but you can also use a Punnett Square to determine the ratios.
Important Note About Dominance
Dominance does not mean prevalent. A dominant trait is not necessarily found in a large number of the population.
For example, having five fingers (polydactyly) is a recessive trait.
There's a family in Brazil where most members have six fingers and six toes, which is a dominant trait in their family.
Calculating Dihybrid Crosses
If you cross two individuals heterozygous for the yellow trait, 3/4 of the offspring will be yellow and 1/4 will be green. If you cross two individuals heterozygous for the round trait, 3/4 of the offspring will be round and 1/4 will be wrinkled.
To determine the proportion of offspring that are both yellow and round, multiply the probabilities together: 3/4 (yellow) * 3/4 (round) = 9/16
Autosomal vs. Sex-linked vs. Maternal Inheritance
Autosomal Inheritance
Autosomal inheritance involves genes located on one of the non-sex chromosomes (autosomes). Humans have 23 pairs of chromosomes, with 22 pairs being autosomes.
Sex-linked Inheritance
Sex-linked inheritance involves genes located on one of the sex chromosomes (X, Y, Z, or W).
In humans:
XX = Female
XY = Male
In chickens:
ZZ = Male
ZW = Female
Maternal Inheritance
Maternal inheritance involves genes located in the DNA found in mitochondria or chloroplasts.
Mitochondria and chloroplasts are inherited from the mother.
In plants, the pollen is the male component, and the ovule (containing the egg) is the female component.
If the mother has the trait, all offspring will have the trait. If the mother does not have the trait, none of the offspring will have the trait.
Linked Genes
Linked genes are found on the same chromosome and are inherited together.
Pedigrees
In a pedigree, if two unaffected parents have an affected child, the trait must be recessive. If the trait affects males and females equally, it is likely autosomal.
Patterns of Inheritance
Sex-Linked Recessive Inheritance
Two unaffected parents have an affected child.
More males than females are affected (e.g., five males versus three females).
A faulty X chromosome from the female parent is passed on.
Autosomal Dominant Inheritance
Every generation has the trait.
If two unaffected parents have an unaffected offspring, it suggests autosomal dominance.
Every parent with the trait passes it on to their offspring.
Mitochondrial/Chloroplastal Inheritance
All offspring are affected if the female parent is affected.
Inherited maternally through mitochondria or chloroplasts.
Chromosomal Inheritance
Crossing Over
Non-sister chromatids exchange genetic information.
Results in recombinant chromosomes.
Increases genetic diversity in gametes.
Independent Assortment
Homologous chromosomes align independently on the metaphase plate.
Maternal and paternal chromosomes can align in various combinations.
Occurs for all 23 pairs of chromosomes in humans.
Law of Segregation
Homologous chromosomes segregate and move to opposite poles during cell division.
Alleles for different traits separate from each other.
Example: An allele for "normal oal" separates from an allele for "polya."
Fertilization
Any sperm can fuse with any egg, leading to variety in offspring.
Gene Linkage and Recombination
Closely linked genes on a chromosome can be mapped using recombinant calculations.
Calculate the recombination frequency: recombinants / total.
Percent recombination indicates the distance in map units.
Example: 17% recombination means the genes are 17 map units apart.
A recombination frequency of 50% or more indicates that the genes are treated as if they are on different chromosomes due to extensive crossing over.
Laws of Inheritance
Law of Segregation
Alleles segregate from one another, ending up in different gametes.
Law of Independent Assortment
Chromosomes align independently on the metaphase plate.
Chromosomal Basis of Inheritance
Traits are located on chromosomes, which are passed down to offspring.
Genetic Disorders
Sickle Cell Disease
Homozygous recessive individuals have sickle cell disease.
Heterozygous individuals have sickle cell trait (reduced symptoms).
Homozygous dominant individuals do not have sickle cell disease.
Malaria cannot affect sickle-celled red blood cells.
Heterozygous individuals have resistance to malaria.
Tay-Sachs Disease
Autosomal recessive disorder.
Affects proteins in the brain.
Non-functional lysosomes cannot break down fats, leading to buildup in the brain.
Huntington's Disease
Autosomal dominant trait.
Neurodegenerative disease.
Symptoms appear later in life, often after passing on the trait.
Having one dominant allele results in the disease.
Chromosomal Changes: Down Syndrome
Occurs due to trisomy of the 21st chromosome (three copies instead of two).
Observed in a karyotype, which shows the chromosomes.
Caused by non-disjunction during anaphase 1, where chromosomes do not segregate properly.
Other Non-Disjunction Disorders
Klinefelter syndrome: XXY (two X chromosomes and one Y chromosome).
Turner syndrome: Only one X chromosome.
Phenotypic Plasticity
Phenotypic Plasticity: When the environment affects gene expression, leading to different phenotypes in individuals with the same genotype.
Individuals with the same genotype can show different phenotypes in different environments.
Example:
Rabbit fur color: Normally, the rabbit's extremities (ears, nose, feet) are black.
When an ice pack is applied, the new fur grows back black due to the cold environment activating those genes.
Diet can also affect phenotype, such as carotenoid intake affecting bird coloration.
Phenotype Variations and Environmental Influence
Organisms can exhibit slight differences in their phenotypes due to environmental factors. For instance, two yarrow plants with identical genotypes might display different flower colors if grown in varying soil conditions. One might be more yellow, while the other is more red, simply because of subtle differences in the nutrients they absorb from the soil.
Another example is the hydrangea, where the acidity of the soil influences flower color.
Hydrangeas in acidic soil tend to be more blue, while those in alkaline or basic soil are more likely to be pink.
Meiosis and Chromosome Number
Let's consider a multiple-choice question that deals with the mechanics of meiosis, the way that gametes are made.
Humans have a diploid number of 2N, or 46 chromosomes. What would happen if meiosis did not occur during gametogenesis?
During meiosis, a 2N cell undergoes division, resulting in 4N. If meiosis doesn't occur and two 2N cells combine (2N + 2N), the result would be 4N. Consequently, the chromosome number would double with each generation. This doubling effect could lead to an individual with 8N chromosomes.
Therefore, meiosis is essential to maintain the correct chromosome number.
Analyzing Genetic Data
Consider a scenario involving a student biology class crossing Drosophila melanogaster:
A student biology class crosses a Drosophila melanogaster having a gray body and long wings with a female having a black body and apterous wings. The following distribution of traits was observed in The Offspring. What can we conclude from this data?
Parental Traits: Gray and long (one parent) and black and apterous (other parent).
Recombinant Traits: Combinations that differ from the parental traits.
In the case of independent assortment, we'd expect a 1:1:1:1 ratio of traits if the genes were on different chromosomes. However, deviations from this ratio indicate crossing over has occurred, leading to recombinant traits.
In this instance, the genes for the two traits must be located closely on the same chromosome, meaning the recombinant traits are due to crossing over.
Free Response Question: Flower Color and Height
Let's analyze a free response question from 2016 (Question 7) that discusses flower color and height traits:
In this scenario, we examine a trait with two sets of chromosomes (2N = 4). Flower color is controlled by a single gene on chromosome one, where green (G) is dominant to purple (g). Height is controlled by a single gene on chromosome two, where dwarf (D) is dominant to tall (d).
Parental individuals with genotypes GGDD and ggdd are crossed to produce an F1 progeny.
Because the prompt gives you the traits and the letters, you have to use them to get full credit!
Constructing a Diagram of Meiosis Products
Diagram the four different products of meiosis, representing gametes with half the genetic material. Each gamete should have two chromosomes.
Chromosome Representation: Each circle represents a gamete containing one long chromosome (chromosome one) and one short chromosome (chromosome two).
Allele Distribution: Due to meiosis and independent assortment:
Two gametes will carry the dominant allele (G), and two will carry the recessive allele (g) for flower color.
Similarly, two gametes will carry the dominant allele (D), and two will carry the recessive allele (d) for height.
The four possible combinations will be: GD, Gd, gD, and gd.
Predicting Phenotypes and Ratios in a Test Cross
Now, let's cross the F1 individual with a homozygous recessive individual (ggdd).
Crossing the F1 generation with the homozygous recessive will result in:
Half green, half purple
Half dwarf, half tall
Based on that we can determine the following phenotypic ratio: 1:1:1:1 ratio meaning that we have
1/4 green dwarf
1/4 purple dwarf
1/4 green tall
1/4 purple tall
When answering these questions, be sure to write the full phenotypic ratio rather than saying one to one to one to one. On the exam, that means writing the entire answer in a complete sentence.
Impact of Genetic Linkage
If the two genes are genetically linked (located on the same chromosome), the proportions of phenotypes in a test cross would differ.
When genes are on different chromosomes, the phenotypic ratio is 1:1:1:1. If genes are linked, parental traits will be inherited together. For example, green and dwarf (GD) would be inherited together, as would purple and tall (gd).
In this case, there would be more of the parental traits.
The majority (greater than 50%) will exhibit parental phenotypes: Greater than 25% will be green dwarf. Greater than 25% will be purple tall.
Recombinant phenotypes (less than 25% each): Less than 25% will be green tall. Less than 25% will be purple dwarf.
This deviation from the 1:1:1:1 ratio indicates that genetic linkage affects trait inheritance.
Pedigree Analysis and Chromosomal Inheritance
Understanding Pedigrees
Pedigrees are diagrams that show the inheritance of a particular trait or condition through multiple generations of a family.
Individuals in a pedigree are typically numbered for easy reference. One common numbering system is to indicate the generation and individual number (e.g., 1-1, 1-2 for the first generation, then 2-1, 2-2, 2-3 for the second generation, etc.).
Meiosis and Genetic Variation
The process of meiosis ensures that the number of chromosomes does not double from parent to offspring during fertilization in eukaryotes.
During meiosis, homologous pairs of chromosomes segregate or separate in meiosis I, resulting in haploid gametes, each containing only one member of each chromosome pair.
Crossing over during meiosis can result in recombinant chromosomes that contain DNA from both parents.
Annotating Pedigrees
To annotate a pedigree, first determine the mode of inheritance of the trait. This involves figuring out whether the trait is dominant or recessive, and whether it is autosomal or sex-linked.
If unaffected parents have affected offspring, the trait is likely recessive.
If one parent passes a trait to offspring regardless of sex, it's likely autosomal.
If there's a disproportionate number of affected males, it could suggest it is sex-linked.
Example: Determining Genotypes in a Pedigree
Identify Affected Individuals: Look for individuals who express the trait in question.
Determine Mode of Inheritance: Determine if the trait is autosomal or sex-linked, and dominant or recessive.
Assign Genotypes: Use the information to deduce the genotypes of individuals in the pedigree.
For example, if a trait is autosomal recessive:
Affected individuals must be homozygous recessive (e.g., bb).
Unaffected individuals can be homozygous dominant (BB) or heterozygous (Bb).
If individuals are heterozygous, they will pass on the dominant trait to some offspring while passing on the recessive trait to other offspring.
Distinguishing Between Sex-Linked and Autosomal Traits
Sex-Linked Traits: Traits linked to sex chromosomes (typically the X chromosome).
Fathers pass on their Y chromosome to their sons.
Autosomal Traits: Traits not linked to sex chromosomes.
Chi-Square Analysis
Overview of Chi-Square Test
The Chi-Square (chi²) test is a statistical test used to determine if there is a significant difference between observed and expected results.
Steps for Conducting a Chi-Square Test
Null Hypothesis: State the null hypothesis.
The null hypothesis typically assumes that there is no significant difference between the observed and expected data.
Calculate Expected Values: Determine the expected values based on genetic predictions (e.g., using a Punnett square).
Calculate the Chi-Square Value: Use the formula:

Where:
O = Observed value
E = Expected value
Σ = Sum of all categories
Determine Degrees of Freedom (df): Degrees of freedom are calculated as the number of categories minus one.
df = n - 1
Where:
n = Number of categories
CAREFUL:
if talking about Hardy-Weinberg Equilibrium, then df must equal 1 because of 2 alleles
else: use number of different phenotypes
Find the P-Value: Use the calculated Chi-Square value and degrees of freedom to find the p-value from a Chi-Square distribution table.
Interpret the Results:
If the p-value is less than or equal to the significance level (usually 0.05), reject the null hypothesis. This indicates that there is a significant difference between the observed and expected results.
If the p-value is greater than the significance level, fail to reject the null hypothesis. This indicates that there is no significant difference between the observed and expected results.
Chi-Square Analysis
Setting Up the Problem
Cross: Wild type male x White-eyed female
Expected Ratio: 1:1:1:1 (Wild type female, White-eyed female, Wild type male, White-eyed male)
Total individuals: 100
Expected frequency for each phenotype: 25%
Calculation: 100 * (1/4) = 25
Observed Data from F2 Generation
Observed phenotypes from the F2 generation are as follows:
Wild type males: 25
Wild type females: 31
White-eyed males: 22
White-eyed females: 24
Chi-Square Calculation Table
Follow these steps to calculate the Chi-Square value:
Observed (O): The actual count from your data.
Expected (E): The count you expect based on your hypothesis.
O - E: Difference between observed and expected values.
(O - E)^2: Square the difference.
((O - E)^2) / E: Divide the squared difference by the expected value.
Phenotype | Observed (O) | Expected (E) | O - E | (O - E)^2 | ((O - E)^2) / E |
|---|---|---|---|---|---|
Wild type males | 25 | 25 | 0 | 0 | 0 |
Wild type females | 31 | 25 | 6 | 36 | 1.44 |
White-eyed males | 22 | 25 | -3 | 9 | 0.36 |
White-eyed females | 24 | 25 | -1 | 1 | 0.04 |
Total | 1.84 |
The Chi-Square value (χ²) is the sum of the last column, which is 1.84.
Degrees of Freedom
Calculate degrees of freedom (df):
df = number of classes - 1
In this case:
df = 4 - 1 = 3
We have four classes of individuals: wild type male, wild type female, white-eyed male, and white-eyed female.
Using the Chi-Square Table
Find the Critical Value: Look up the critical value in the Chi-Square table. Use a p-value of 0.05 and the calculated degrees of freedom.
Critical Value: With df = 3 and p = 0.05, the critical value from the table is 7.81.
Interpreting the Chi-Square Value
Compare Calculated Value to Critical Value: Compare the calculated Chi-Square value (1.84) to the critical value (7.81).
Decision:
If the calculated value is less than the critical value, fail to reject the null hypothesis.
If the calculated value is greater than the critical value, reject the null hypothesis.
Null Hypothesis: A statement of no effect or no difference. The goal of hypothesis testing is to determine whether there is enough evidence to reject the null hypothesis.
In this case, 1.84 < 7.81, so we fail to reject the null hypothesis. This suggests that the observed data is consistent with the expected ratio, and the parents' genotypes are likely X^E X^E and X^e Y.
Key Takeaways
Failing to reject the null hypothesis doesn't prove it's correct, it just means there isn't enough evidence to say it's wrong.
The Chi-Square test helps determine if deviations from expected results are due to chance or a real effect.
Additional Formulas
Percent Change
The formula for percent change is:
Formula: ((Final - Initial) / Initial )* 100
Make sure you know how to calculate this, as it may be relevant to lab questions.
Map Units
The formula for calculating map units is not provided on the formula sheet, so be sure to study it separately.