knowt logo

Complex Genetic Disorders

LOs:

  • appreciate how complex genetic disorders result from an interaction of genetic and environmental factors

  • understand importance of epidemiology and sample collection in a study

  • know the main methods used to identify risk/susceptibility genes

  • be familiar with some of the example disorders and the genes and pathological pathways identified

Definitions:

Epidemiology = study of how often diseases occur in different groups of people and why

Notes:

3: Family history is often one of the biggest risk factors for disease as it indicates genetic contribution. However it doesn’t explain incidence fully as environment/lifestyle/life experience also important.

Common diseases of later life inc ischaemic heart disease, cancers, MS and Alzheimers.
Neuropsychiatric disorders inc bipolar/manic depression, epilepsy, alcoholism and schizophrenia

4: Key properties of common, complex genetic disorders include:

  • partially genetic = partially heritable (+ environment)

  • risk and susceptibility does not guarantee illness - variants of genes increase risk but don’t definitively mean condition

  • multiple genes can cause illness across the population

  • different combinations of genes cause illness in different individuals/families

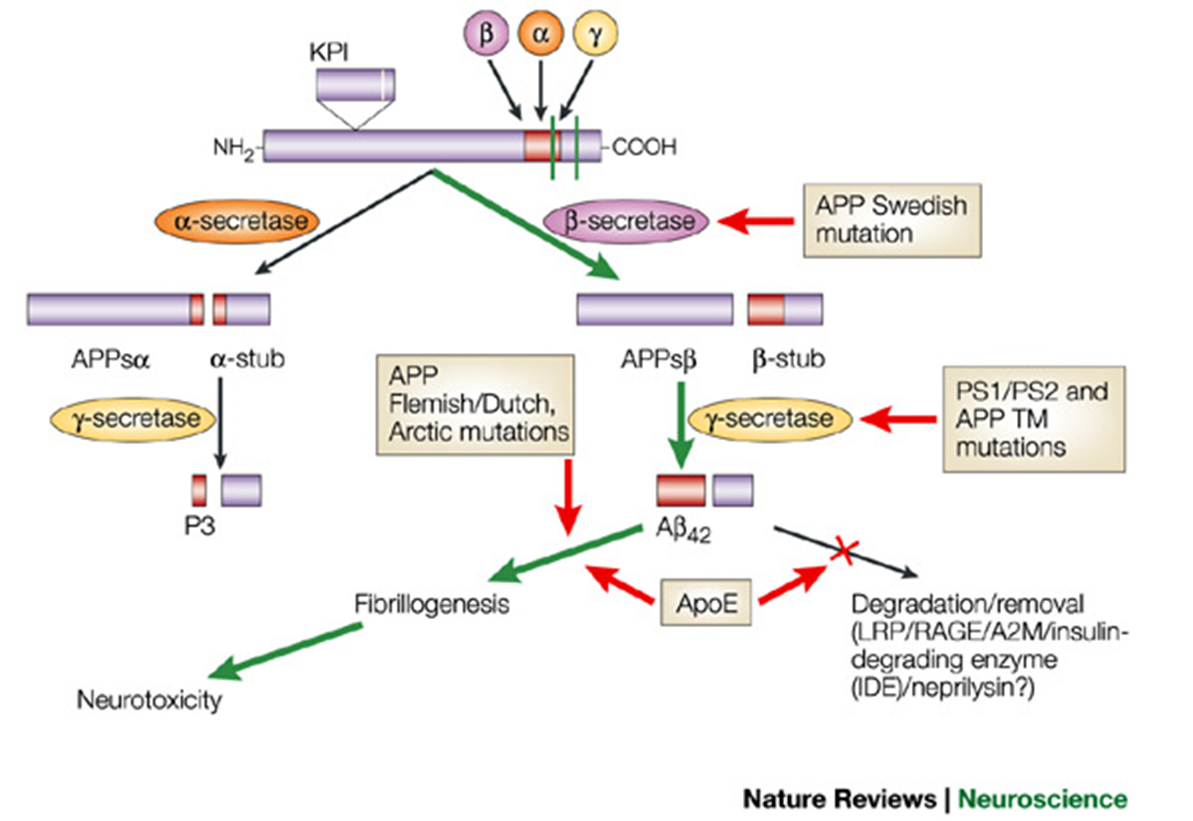
  • familial forms sometimes observed: major gene effect indicated but may be unique to family

  • quantitative or descriptive phenotyping problems - eg how to phenotype schizophrenia?

5: Common complex disorders are the chief cause of morbidity and mortality in the developed world, making them a major economic drain on healthcare providers such as the NHS.
Once genetic factors are identified it’s easier to determine causes inc biological and environmental factors, as well as develop new medications. Identifying genetic causes allows individuals with increased susceptibility to be identified so they can be continually monitored, have lifestyle changes suggested and prophylactic treatment given eg statins for heart disease

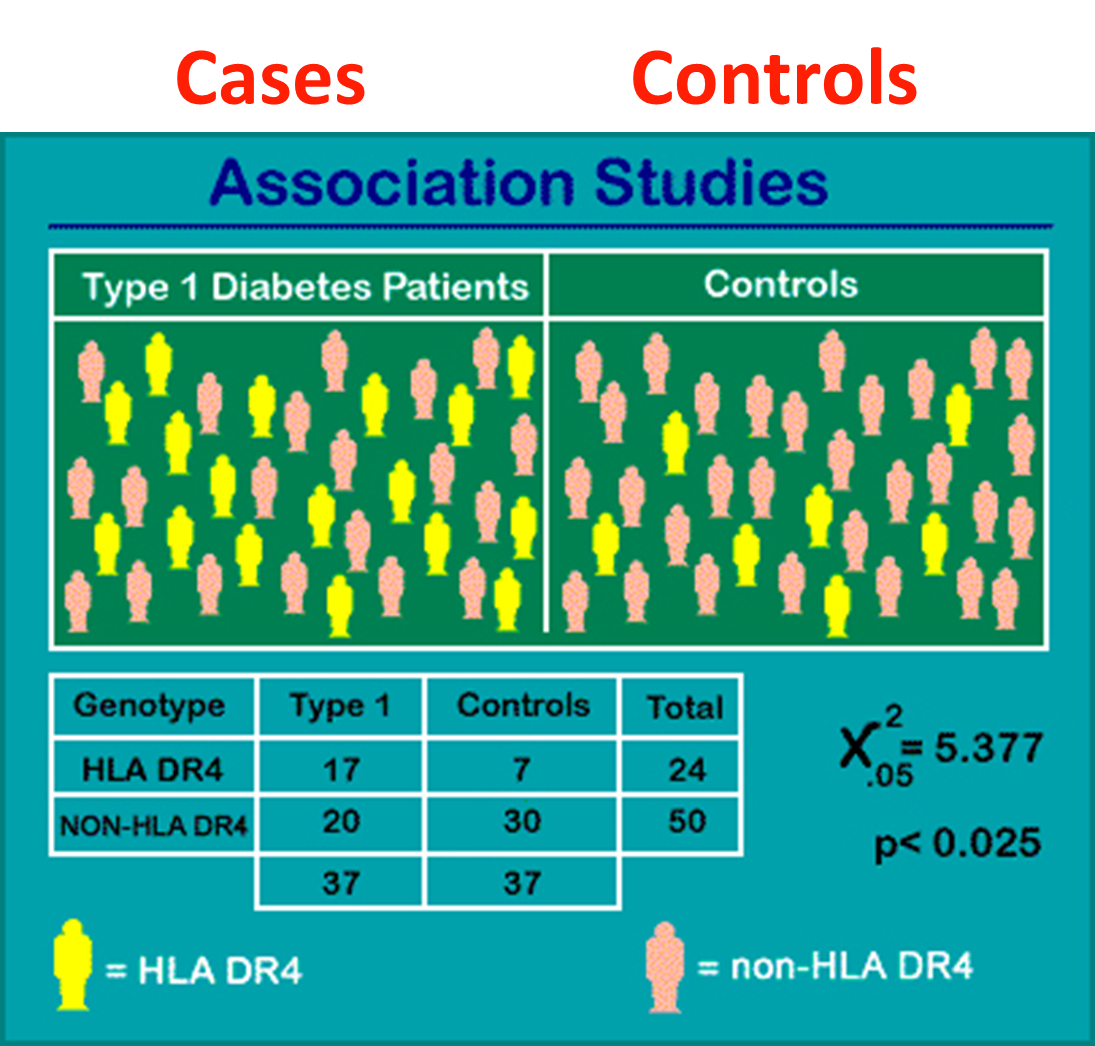
6: To identify genes involved in complex disorders the following are required:

  • suitable population to study and their DNA

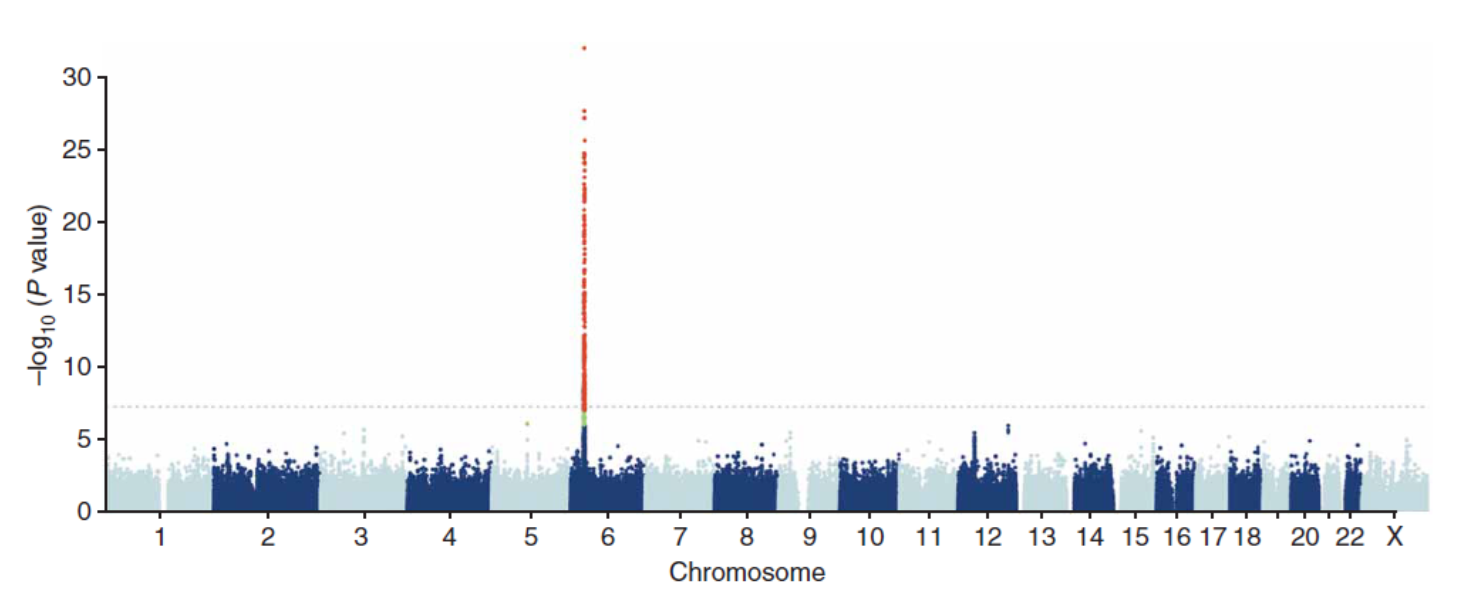
  • understanding of genetic architecture of disorder

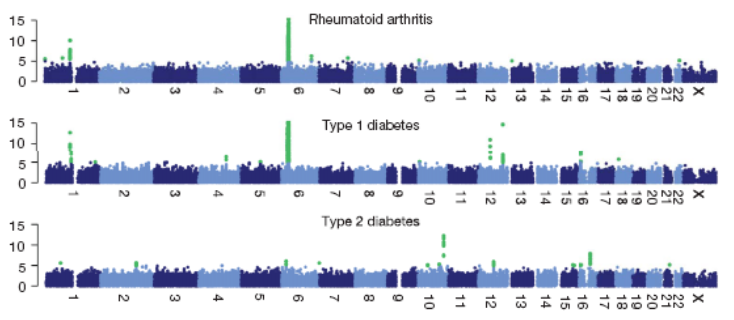
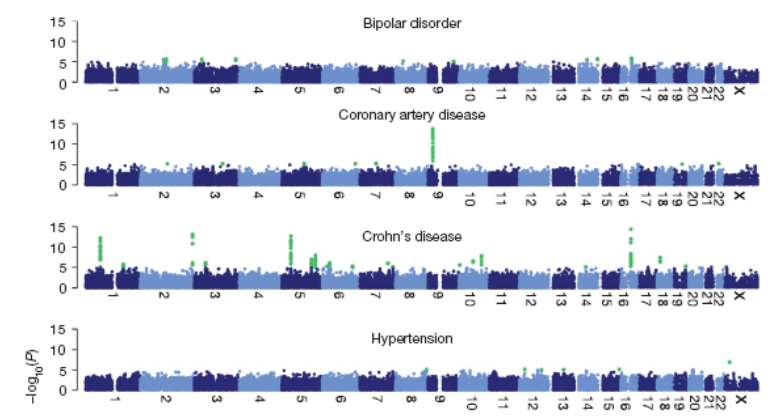
  • suitable method based on genetic architecture

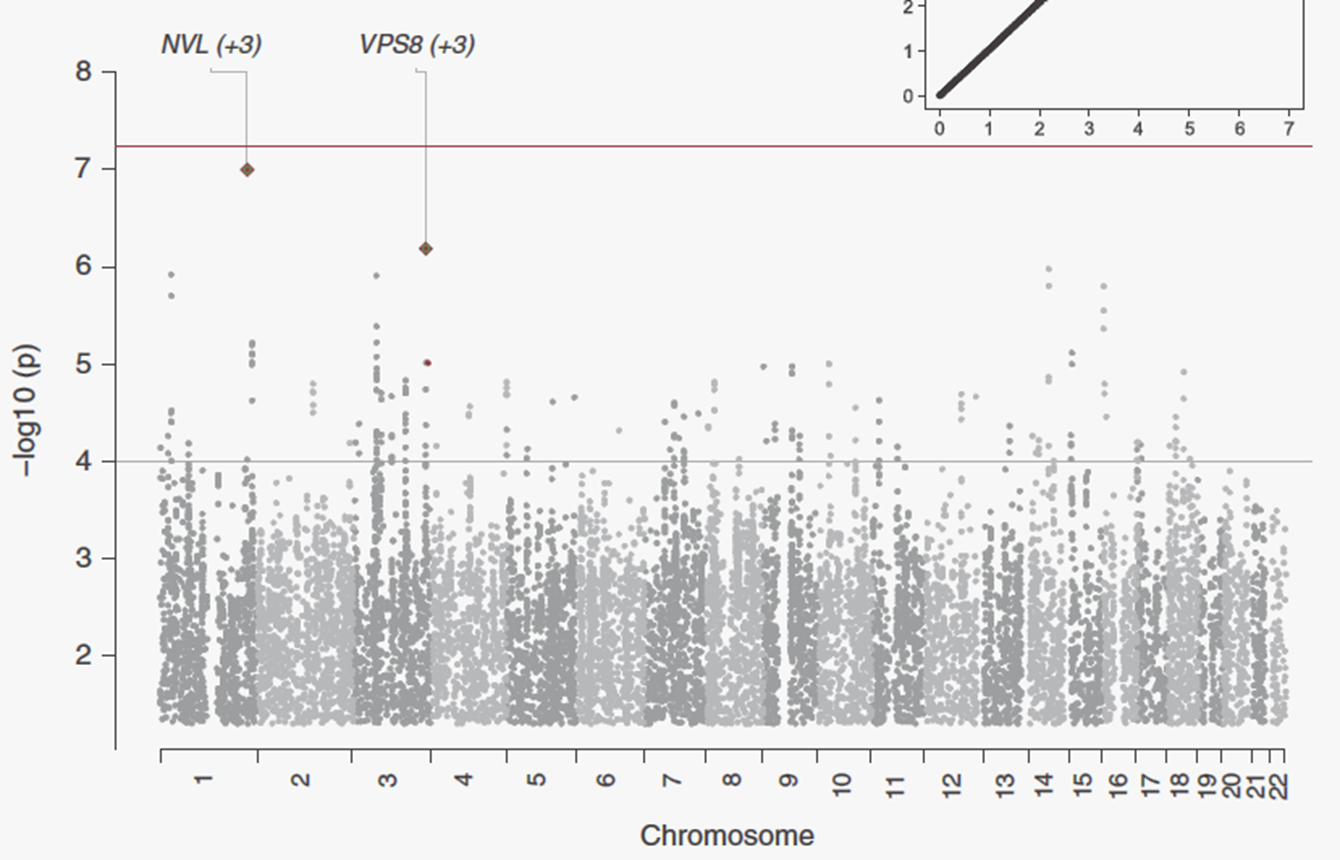
7: Population/individuals studied can be:

  • special cases referred to consultant (chromosome abnormality?)

  • families with high density of cases (gene of major effect with rare variant?)

  • case vs healthy control cohorts (generally collected by research clinicians)

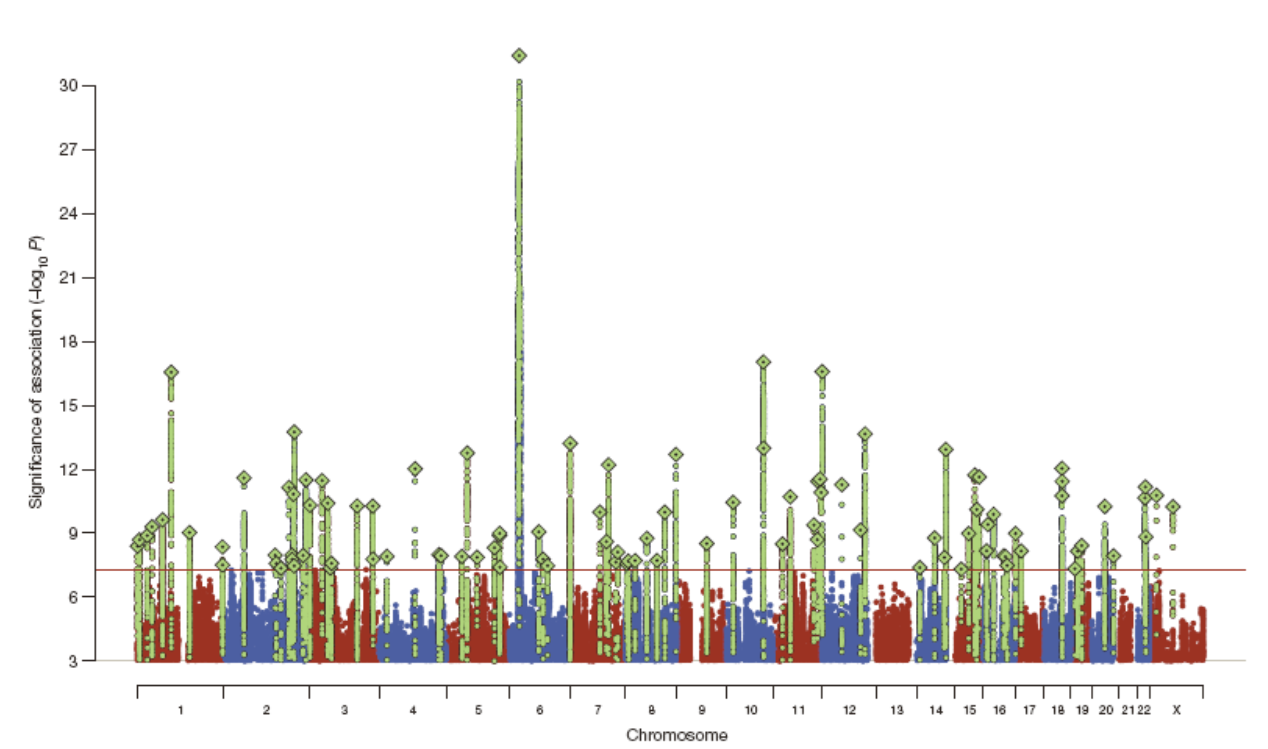
  • non-selective whole population/isolates for prospective studies

8: Large population studies: complex genetic disorders require the study of large population groups to gain statistical power.

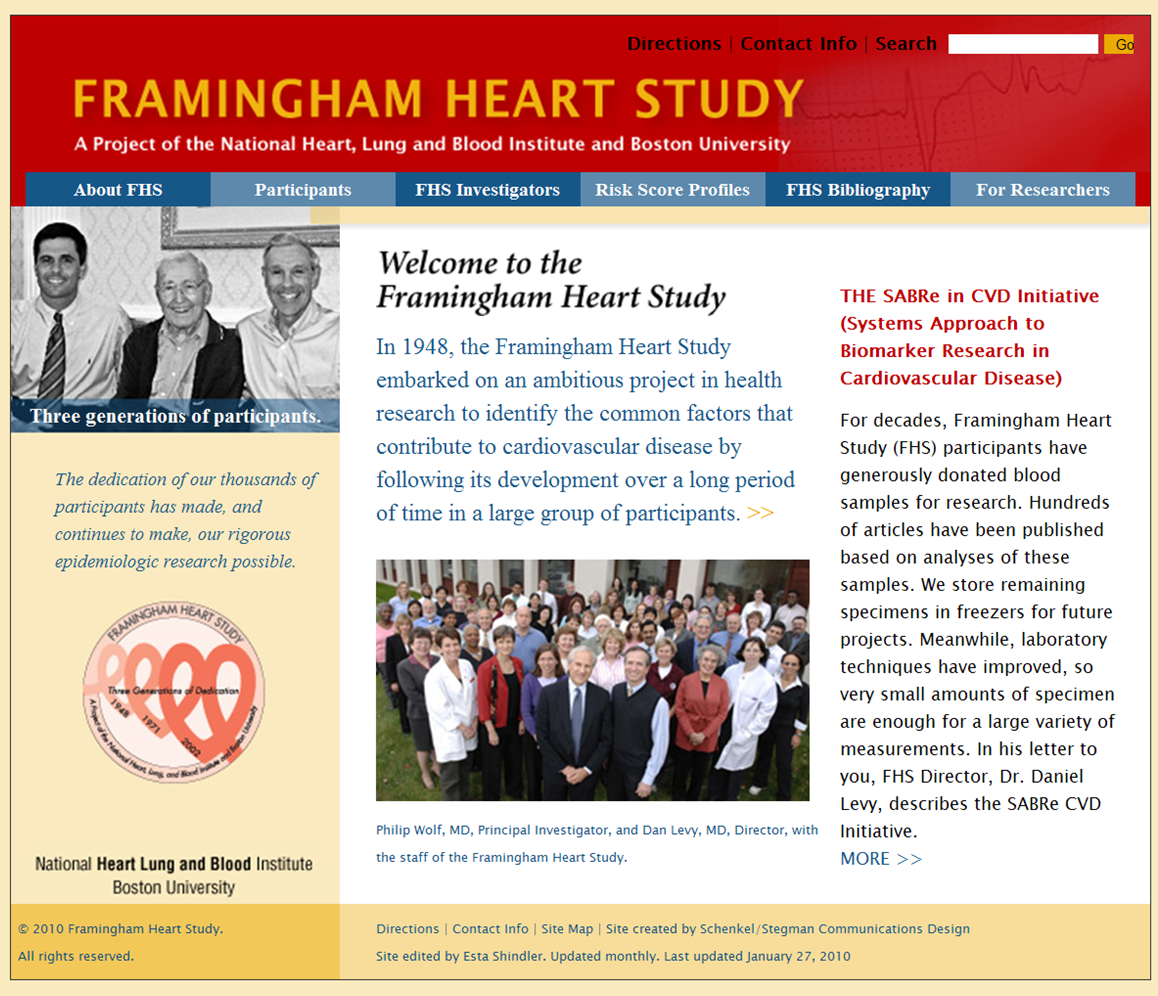
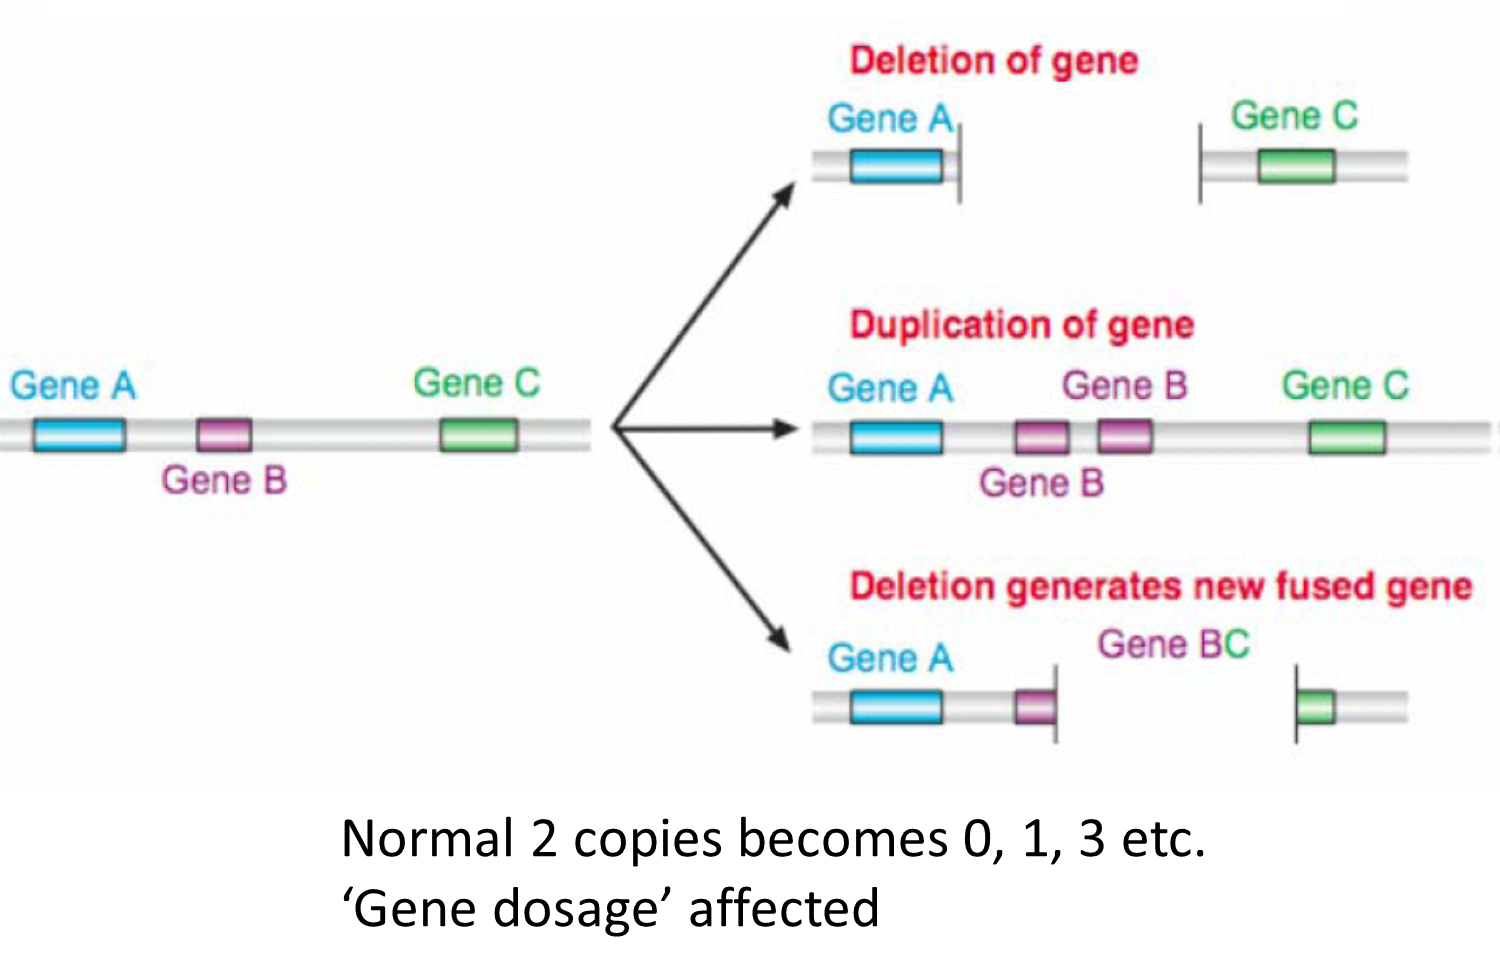
Framingham heart study involved monitoring entire town daily, formed part of evidence for smoking and cholesterol as heart attack risk factors
9: Biobank is a collection of info in england on different illnesses, can be used to collect data but not statistically accurate/valid
Generation scotland - 30000 people signed up to give blood and answer questionnaires for scientists to study

10: Population isolates are genetically simpler, homogenous, exhibit the founder effect and have good family records eg Icelandic (huge family records going back hundreds of years), Finnish (initial settlement which later spread out - Founder effect), Amish, Orkney, Croatians, Hutterites, Sardinian and Jewish communities

11: Epidemiology and twin studies can help to understand the genetic architecture of the disease being studied as twin studies help understand genetic contribution to illness as opposed to environmental.

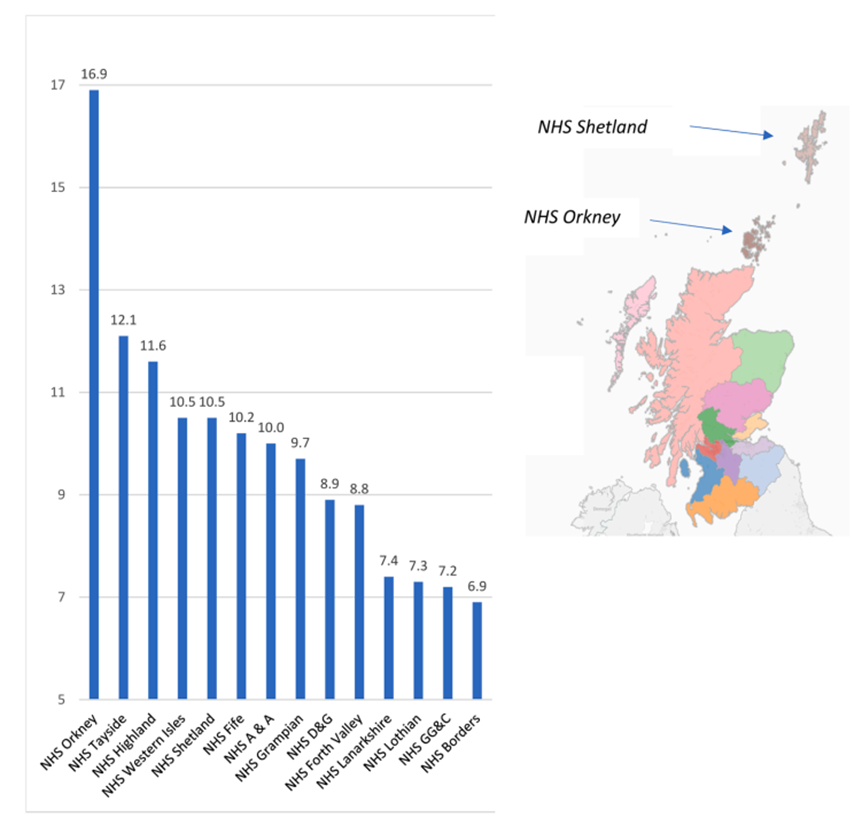
12: Genetic epidemiology can link particular populations with genetic risk for conditions. This can help population healthcare and scientist understanding. Below = Edi uni study on MS, further north west you go = higher incidence of MS with highest incidence in Orkney. Hypothesis that further north = vitamin D deficiency which could contribute to MS.
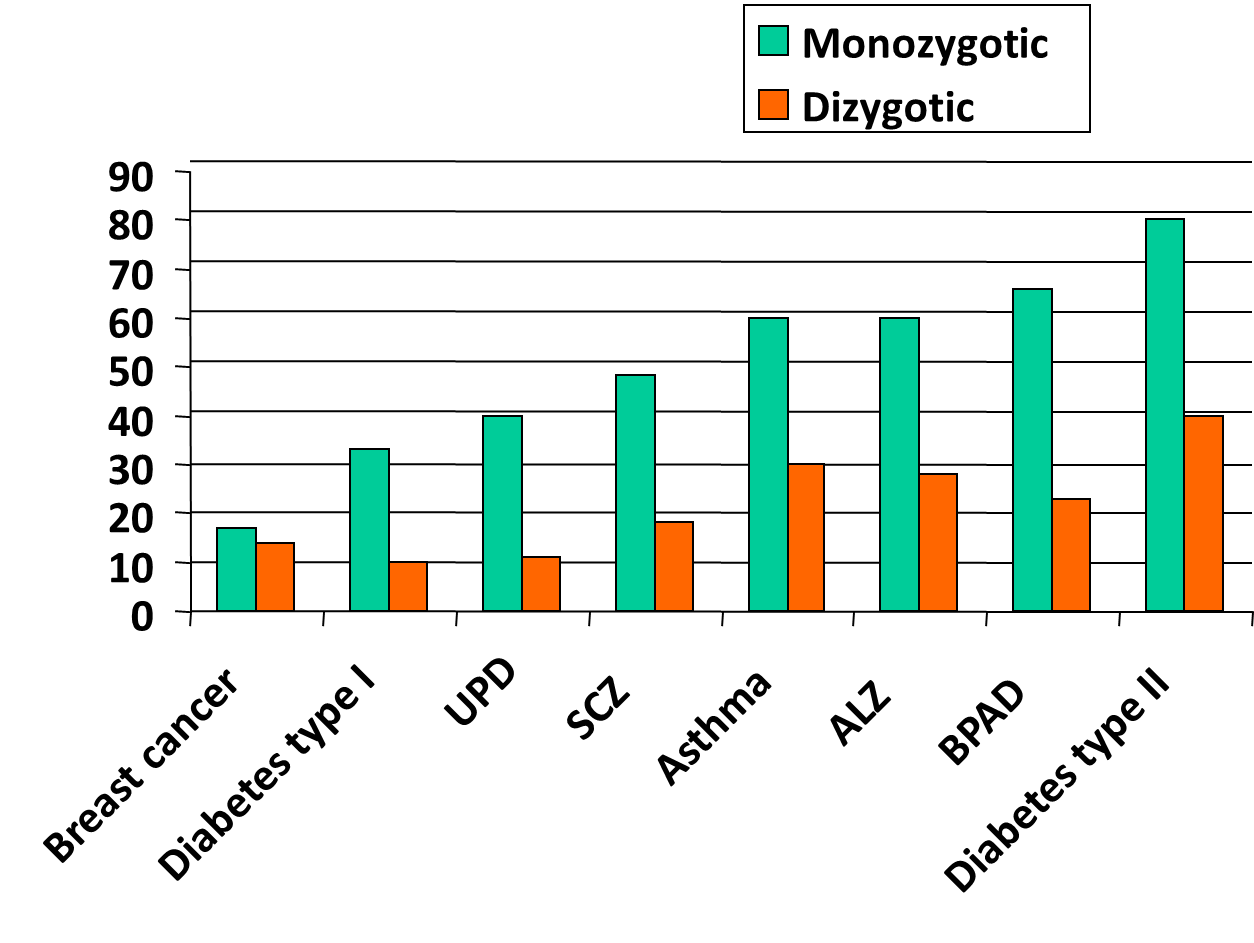
13: Concordance rates in twins allow us to observe the genetic traits of certain disorders - if one twin has condition, what is risk of other twin getting it? Shown below for identical (monozygotic) and non identical (dizygotic). T1 diabetes autoimmune, could be triggered by virus
14: Relative risk is the ratio of frequency in relatives of affected person to frequency in general population. For example, in insulin dependent diabetes mellitus (type 1), the frequency in signals of affected individuals is 6% and the frequency in the general population is 0.4%.
Relative risk = 6/0.4 = 15.
Cystic fibrosis RR = 500 - entirely genetic disorder, probs shouldn’t use RR to measure it. RR can be used to show genetic marker effect rather than relatedness

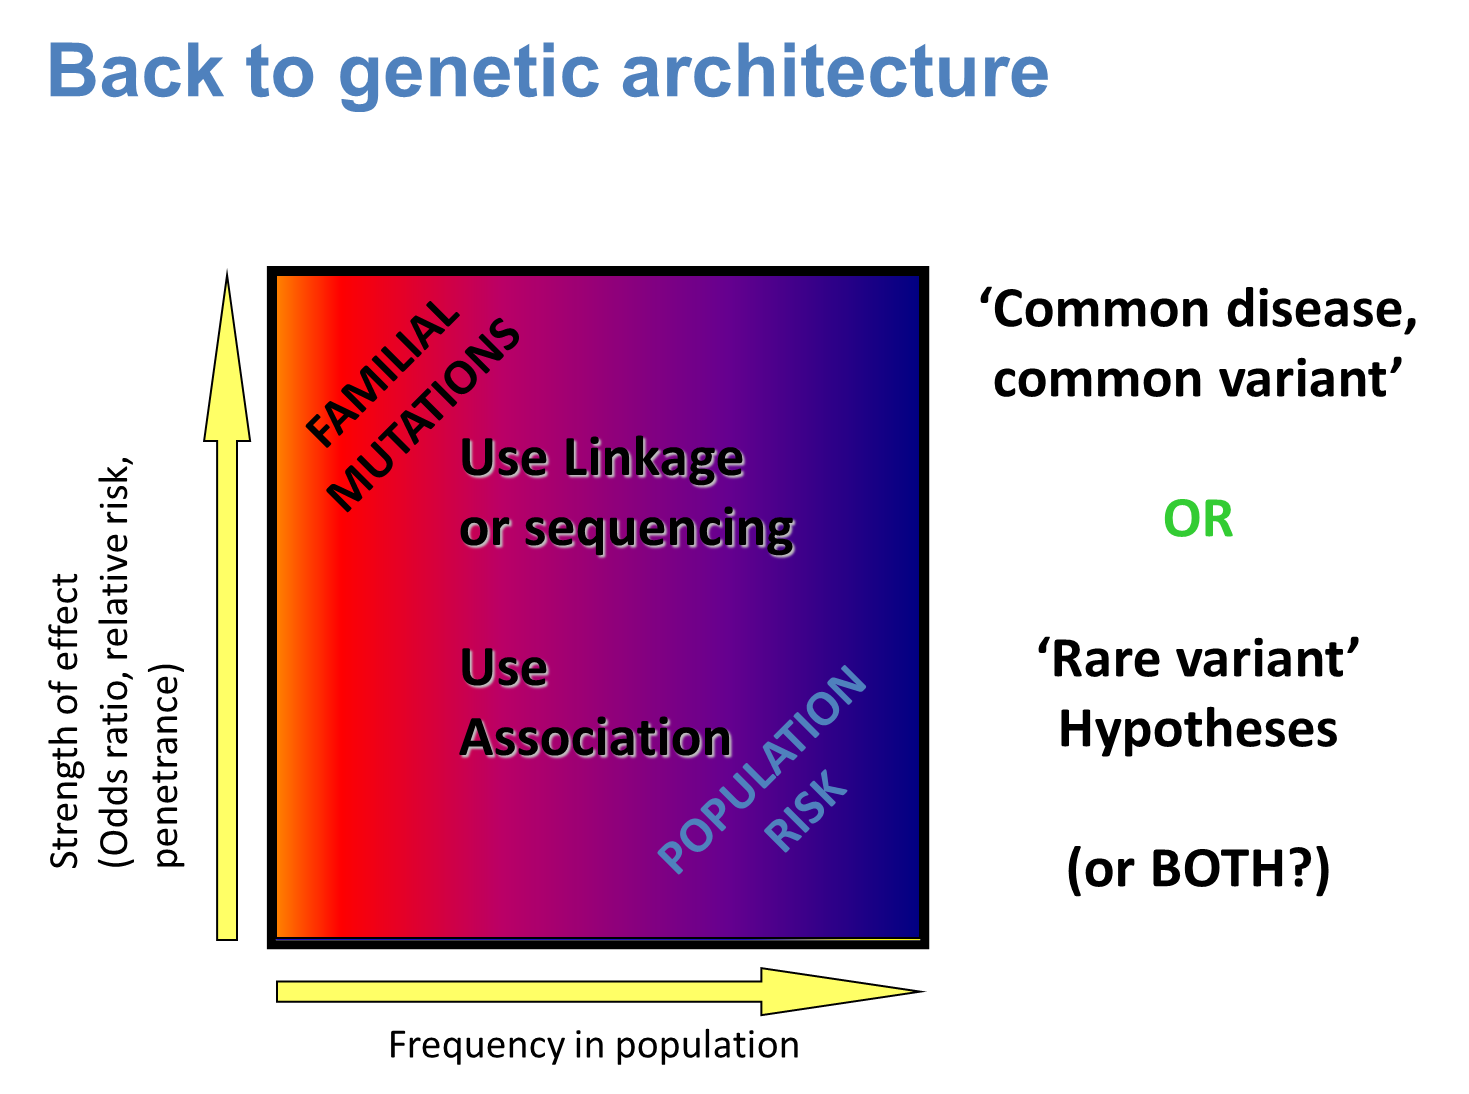
15: 2D plot shows frequency of disorder in the population and the strength of the effect eg common and less powerful (population risk eg heart disease) or rare and more powerful (familial mutations eg Huntingtons)
16: Appropriate method must be selected.

This may be:

1) linkage - like in simple genetic disorders (used for rare mutations where few genes are involved overall)
2) case control association studies (used for common mutations where many genes are involved overall in the condition)
3) cytogenetics/CNVs
4) resequencing and personal genomics
3 and 4 are used for rare mutations where there are many genes involved overall

17: An example where linkage is used is Alzheimer’s. Alzheimer’s is the most common form of dementia (loss of cognitive abilities). It affects 7-10% of over 65s and incidence increases dramatically over age. The majority of cases are sporadic but some are familial with early onset.

18: Parametric linkage analysis identified 3 genes from familial samples:

  • amyloid precursor protein gene (APP) on chromosome 21

  • presenilin 1 on chromosome 14

  • presenilin 2 on chromosome 1

19: Alzheimers mainly a population risk but there’s a genetic component too. A 4th AD risk gene was identified via non-parametric linkage analysis. The study involved 32 families, and 87/293 of the individuals suffered from AD. The risk gene was ApoE4. ApoE4 is one of 3 alleles of ApoE which encodes apolipoprotein E and is associated with late onset AD

20: In 2024, ApoE4 was classed as a strong genetic cause.
ApoE4 homozygotes:

  • begin depositing amyloid plaques from age 55

  • symptoms start around 65 years old

  • mild cognitive impairment diagnosis around age 72

  • dementia diagnosis around age 74, death around age 77

These characteristics happen 7 to 10 years earlier in ApoE4 people than in people without it.

21: Identified genes/proteins begin to fit into a pathological model
22: Case control association studies compare allele frequencies in healthy vs diagnosed populations allow us to observe if common SNPs influence risk and whether an SNP allele is seen more frequently in cases vs controls (biased distribution). However it must be ensured that stratification doesn’t confound the study - make sure the population being studied is uniform and only difference is whether they have the disease or not

23: Difference in allele frequency at a particular locus. Observing HLA DR4 SNP in type 1 diabetes patients. Stats test = chi squared
24: Case control association study format can be small scale to large scale. In the past a single candidate gene would have been selected for study, with a few hundred individuals studied - often nothing was found, subjectivity problems etc. Nowadays genome chips (microscope slides containing fixed DNA) can be used to screen 1 million + SNPs ‘tagging’ most of the variation across most genes in the genome. This method was applied to tens of thousands of individuals in the genome wide association study (GWAS). GWAS is hypothesis free - objective, looking at EVERYTHING. Has to be thresholds in place to ensure false positives are ignored

25: Manhattan plots (called this due to skyscraper peaks) of GWAS data and genome-wide significance show each individual SNP locus in millions (each little dot) on the x axis and -log10 p value for association with illness on the y axis. A p value of 10^-8 is considered genome wide significant. Shown is the flucloxacillin side effect risk for DILI (drug induced liver injury). Grey line = threshold, red line only thing above threshold - DILI SNP on chromosome 6 (MHC HLA region)
26: GWAS approach often gives very vague findings eg in major depression as there are so many different lifestyle differences and genetic differences as well as other environmental factors
27:

28: Many disorders have benefitted from GWAS analysis eg chronic IBDs Crohn’s and ulcerative colitis. Mucosal immune responses to commensal gut flora is dysregulated in genetically susceptible individuals. GWAS analysis has discovered around 100 gene alleles associated with IBDs. Large collaborative sample sets were used with 2 lots of 20000 cases and similar healthy controls.

29: The biology of IBD is emerging showing the involvement of the gut barrier, IL23 signalling and Th17 cells due to GWAS. There has been a clear overlap with other autoimmune inflammatory disorders including ankylosing spondylitis, psoriasis, systemic lupus erythematosus (SLE) and type 1 diabetes.

30: Very large GWAS sample sizes have been required for schizophrenia to give useful results - complex genetics require big sample numbers to give results. Combining sample sets in meta analyses is necessary for complex disorders eg schizophrenia.

31: large peak = MHC - immune component to schizophrenia?

32: Copy number variation: a new form of rare variant and its role in disease =

33: possible structural rearrangements:

34:

  • estimated 5 to 25% of the human of the human reference (average) genome is copy number variable - deviating from 2

  • each person has approx 1500 common inherited CNVs, average size 20kb therefore 30 million bases of CNVs per person

  • most CNVs harmless variation - copy number polymorphisms

  • some reflect natural selection, others contribute to disease

35:

Cytogenetics is vital to understanding ASD biology. Occurs in 1% of all births and are poorly understood neurodevelopmental disorders involving

  • repetitive stimming

  • communication deficits

  • socialisation deficits

Severe forms accompanied by language regression, seizures and low IQ

37: Some autism CNVs identified in multiple unrelated individuals - good evidence of genetic component

38: different copy numbers of 16p11.2 in different individuals with autism - some have copies deleted whereas others have more than 2 copies

39: Genetic studies of CNVs in autism have shown to code for proteins involved in synaptic connections

41: The remaining genetic contribution to disease is rare SNPs. Rare (<5% coding SNPs affect protein function. NGS is underway to find them as they have greater effect on individual risk.

42: Large genome wide association study in age related macular degeneration highlights rare and common variant contributions
Study involved 16144 patients and 17832 controls and identified common variants. Very rare coding variants (<0.1%) in CFH, CFI and TIMP3 suggest causal roles for these genes as does splice variant in SLC16A8.

43: CFH = complement factor H

Complex Genetic Disorders

LOs:

  • appreciate how complex genetic disorders result from an interaction of genetic and environmental factors

  • understand importance of epidemiology and sample collection in a study

  • know the main methods used to identify risk/susceptibility genes

  • be familiar with some of the example disorders and the genes and pathological pathways identified

Definitions:

Epidemiology = study of how often diseases occur in different groups of people and why

Notes:

3: Family history is often one of the biggest risk factors for disease as it indicates genetic contribution. However it doesn’t explain incidence fully as environment/lifestyle/life experience also important.

Common diseases of later life inc ischaemic heart disease, cancers, MS and Alzheimers.
Neuropsychiatric disorders inc bipolar/manic depression, epilepsy, alcoholism and schizophrenia

4: Key properties of common, complex genetic disorders include:

  • partially genetic = partially heritable (+ environment)

  • risk and susceptibility does not guarantee illness - variants of genes increase risk but don’t definitively mean condition

  • multiple genes can cause illness across the population

  • different combinations of genes cause illness in different individuals/families

  • familial forms sometimes observed: major gene effect indicated but may be unique to family

  • quantitative or descriptive phenotyping problems - eg how to phenotype schizophrenia?

5: Common complex disorders are the chief cause of morbidity and mortality in the developed world, making them a major economic drain on healthcare providers such as the NHS.
Once genetic factors are identified it’s easier to determine causes inc biological and environmental factors, as well as develop new medications. Identifying genetic causes allows individuals with increased susceptibility to be identified so they can be continually monitored, have lifestyle changes suggested and prophylactic treatment given eg statins for heart disease

6: To identify genes involved in complex disorders the following are required:

  • suitable population to study and their DNA

  • understanding of genetic architecture of disorder

  • suitable method based on genetic architecture

7: Population/individuals studied can be:

  • special cases referred to consultant (chromosome abnormality?)

  • families with high density of cases (gene of major effect with rare variant?)

  • case vs healthy control cohorts (generally collected by research clinicians)

  • non-selective whole population/isolates for prospective studies

8: Large population studies: complex genetic disorders require the study of large population groups to gain statistical power.

Framingham heart study involved monitoring entire town daily, formed part of evidence for smoking and cholesterol as heart attack risk factors

9: Biobank is a collection of info in england on different illnesses, can be used to collect data but not statistically accurate/valid
Generation scotland - 30000 people signed up to give blood and answer questionnaires for scientists to study

10: Population isolates are genetically simpler, homogenous, exhibit the founder effect and have good family records eg Icelandic (huge family records going back hundreds of years), Finnish (initial settlement which later spread out - Founder effect), Amish, Orkney, Croatians, Hutterites, Sardinian and Jewish communities

11: Epidemiology and twin studies can help to understand the genetic architecture of the disease being studied as twin studies help understand genetic contribution to illness as opposed to environmental.

12: Genetic epidemiology can link particular populations with genetic risk for conditions. This can help population healthcare and scientist understanding. Below = Edi uni study on MS, further north west you go = higher incidence of MS with highest incidence in Orkney. Hypothesis that further north = vitamin D deficiency which could contribute to MS.

13: Concordance rates in twins allow us to observe the genetic traits of certain disorders - if one twin has condition, what is risk of other twin getting it? Shown below for identical (monozygotic) and non identical (dizygotic). T1 diabetes autoimmune, could be triggered by virus

14: Relative risk is the ratio of frequency in relatives of affected person to frequency in general population. For example, in insulin dependent diabetes mellitus (type 1), the frequency in signals of affected individuals is 6% and the frequency in the general population is 0.4%.
Relative risk = 6/0.4 = 15.
Cystic fibrosis RR = 500 - entirely genetic disorder, probs shouldn’t use RR to measure it. RR can be used to show genetic marker effect rather than relatedness

15: 2D plot shows frequency of disorder in the population and the strength of the effect eg common and less powerful (population risk eg heart disease) or rare and more powerful (familial mutations eg Huntingtons)

16: Appropriate method must be selected.

This may be:

1) linkage - like in simple genetic disorders (used for rare mutations where few genes are involved overall)
2) case control association studies (used for common mutations where many genes are involved overall in the condition)
3) cytogenetics/CNVs
4) resequencing and personal genomics
3 and 4 are used for rare mutations where there are many genes involved overall

17: An example where linkage is used is Alzheimer’s. Alzheimer’s is the most common form of dementia (loss of cognitive abilities). It affects 7-10% of over 65s and incidence increases dramatically over age. The majority of cases are sporadic but some are familial with early onset.

18: Parametric linkage analysis identified 3 genes from familial samples:

  • amyloid precursor protein gene (APP) on chromosome 21

  • presenilin 1 on chromosome 14

  • presenilin 2 on chromosome 1

19: Alzheimers mainly a population risk but there’s a genetic component too. A 4th AD risk gene was identified via non-parametric linkage analysis. The study involved 32 families, and 87/293 of the individuals suffered from AD. The risk gene was ApoE4. ApoE4 is one of 3 alleles of ApoE which encodes apolipoprotein E and is associated with late onset AD

20: In 2024, ApoE4 was classed as a strong genetic cause.
ApoE4 homozygotes:

  • begin depositing amyloid plaques from age 55

  • symptoms start around 65 years old

  • mild cognitive impairment diagnosis around age 72

  • dementia diagnosis around age 74, death around age 77

These characteristics happen 7 to 10 years earlier in ApoE4 people than in people without it.

21: Identified genes/proteins begin to fit into a pathological model

22: Case control association studies compare allele frequencies in healthy vs diagnosed populations allow us to observe if common SNPs influence risk and whether an SNP allele is seen more frequently in cases vs controls (biased distribution). However it must be ensured that stratification doesn’t confound the study - make sure the population being studied is uniform and only difference is whether they have the disease or not

23: Difference in allele frequency at a particular locus. Observing HLA DR4 SNP in type 1 diabetes patients. Stats test = chi squared

24: Case control association study format can be small scale to large scale. In the past a single candidate gene would have been selected for study, with a few hundred individuals studied - often nothing was found, subjectivity problems etc. Nowadays genome chips (microscope slides containing fixed DNA) can be used to screen 1 million + SNPs ‘tagging’ most of the variation across most genes in the genome. This method was applied to tens of thousands of individuals in the genome wide association study (GWAS). GWAS is hypothesis free - objective, looking at EVERYTHING. Has to be thresholds in place to ensure false positives are ignored

25: Manhattan plots (called this due to skyscraper peaks) of GWAS data and genome-wide significance show each individual SNP locus in millions (each little dot) on the x axis and -log10 p value for association with illness on the y axis. A p value of 10^-8 is considered genome wide significant. Shown is the flucloxacillin side effect risk for DILI (drug induced liver injury). Grey line = threshold, red line only thing above threshold - DILI SNP on chromosome 6 (MHC HLA region)

26: GWAS approach often gives very vague findings eg in major depression as there are so many different lifestyle differences and genetic differences as well as other environmental factors

27:
28: Many disorders have benefitted from GWAS analysis eg chronic IBDs Crohn’s and ulcerative colitis. Mucosal immune responses to commensal gut flora is dysregulated in genetically susceptible individuals. GWAS analysis has discovered around 100 gene alleles associated with IBDs. Large collaborative sample sets were used with 2 lots of 20000 cases and similar healthy controls.

29: The biology of IBD is emerging showing the involvement of the gut barrier, IL23 signalling and Th17 cells due to GWAS. There has been a clear overlap with other autoimmune inflammatory disorders including ankylosing spondylitis, psoriasis, systemic lupus erythematosus (SLE) and type 1 diabetes.

30: Very large GWAS sample sizes have been required for schizophrenia to give useful results - complex genetics require big sample numbers to give results. Combining sample sets in meta analyses is necessary for complex disorders eg schizophrenia.

31: large peak = MHC - immune component to schizophrenia?
32: Copy number variation: a new form of rare variant and its role in disease =

33: possible structural rearrangements:
34:

  • estimated 5 to 25% of the human of the human reference (average) genome is copy number variable - deviating from 2

  • each person has approx 1500 common inherited CNVs, average size 20kb therefore 30 million bases of CNVs per person

  • most CNVs harmless variation - copy number polymorphisms

  • some reflect natural selection, others contribute to disease

35:

Cytogenetics is vital to understanding ASD biology. Occurs in 1% of all births and are poorly understood neurodevelopmental disorders involving

  • repetitive stimming

  • communication deficits

  • socialisation deficits

Severe forms accompanied by language regression, seizures and low IQ

37: Some autism CNVs identified in multiple unrelated individuals - good evidence of genetic component

38: different copy numbers of 16p11.2 in different individuals with autism - some have copies deleted whereas others have more than 2 copies

39: Genetic studies of CNVs in autism have shown to code for proteins involved in synaptic connections

41: The remaining genetic contribution to disease is rare SNPs. Rare (<5% coding SNPs affect protein function. NGS is underway to find them as they have greater effect on individual risk.

42: Large genome wide association study in age related macular degeneration highlights rare and common variant contributions
Study involved 16144 patients and 17832 controls and identified common variants. Very rare coding variants (<0.1%) in CFH, CFI and TIMP3 suggest causal roles for these genes as does splice variant in SLC16A8.

43: CFH = complement factor H

robot