5.1: Probability Rules
Learning Objectives:9
1. Apply the rules of probabilities
2. Compute and interpret probabilities using the empirical method
3. Compute and interpret probabilities using the classical method
4. Use simulation to obtain data based on probabilities
5. Recognize and interpret subjective probabilities
Introduction to Probability
Probability measures how likely it is that a certain random event will occur.
in essence, probability is about predicting outcomes/patterns in situations where we don't know exactly what will happen right now, but do have an idea of how things will turn out if we repeat them enough.
Probability = ‘P’
What situations do you typically use Probability in?
In experiments that yield random short-term outcomes.
Probability reflects the long-term of an outcome in situations where the results are uncertain in the short term
Demonstrating Probability in real life situations:
Imagine flipping a coin. For any single flip, you can’t say for sure whether it’ll be heads or tails—that’s the uncertainty in the short term. But if you flip it hundreds or thousands of times, you expect heads and tails to show up roughly equally. So, probability lets us predict that over many flips, each side has about a 50% chance of showing up.
Why is this concept useful?
This concept is useful because, even though we can’t control or predict every outcome, we can understand the likelihood of each possibility based on the bigger picture. Probability helps us navigate that balance between short-term randomness and long-term patterns. The long-term proportion in which a certain outcome happens is equivalent to the probability of that certain outcome
** “Random event” is also called ‘random phenomenon’ or ‘chance behavior’.
The Law of Large Numbers
the more someone conducts an experiment or trial, the more likely the proportion of a random event occurring becomes more accurate (or gets closer to the true probability of the outcome)
experiment is any process that can be repeated in which the results are uncertain.
event (of a probability experiment) is a collection of outcomes from probability experiment
Event = ‘E’
Events may include only one outcome.
Events with one outcome are called “simple events”
Simple event = ei
illustration: e1 = x, e2 = x, …. e4 = x
^ See it is being used to define one event occurring at a time.
Events with more than one outcome are just called “events”
What is a “Sample Space” in Probability?
Sample Space (of a probability experiment) is a collection of all possible outcomes.
Sample Space = S
S = { (x) , (x) , (x) , (x) … (x) }
x = all possible event outcomesbvnvnmmjv b
EXAMPLE Identifying Events and the Sample Space of a Probability Experiment:
“Consider the probability experiment of having two children.”
(a) Identify the outcomes of the probability experiment.
For each child, there are typically two outcomes—boy (B) or girl (G). Since there are two children, you have a total of four possible combinations of gender for each child:
e1 = boy, boy, e2 = boy, girl, e3 = girl, boy, e4 = girl, girl
(b) Determine the sample space.
Combine Each Outcome for Two Children. Since you have two children, each with two possible outcomes, the sample space will include all combinations of these outcomes. Here’s how you can pair each possible outcome of the first child with each possible outcome of the second child:
S = { (boy, boy), (boy, girl), (girl, boy), (girl, girl) }
(c) Define the event E = “have one boy”.
Identify Outcomes with Exactly One Boy.
BG (first child is a boy, second child is a girl)
GB (first child is a girl, second child is a boy)
The event E is the subset of the sample space containing only the outcomes that meet the "one boy" criterion:
E = {(boy, girl), (girl, boy)}
Apply the Rules of Probabilities
The Two Cornerstone Rules of Probabilities
1. The probability of any one event, P(E) ,must be greater than or equal to 0 and less than or equal to 1
That is, 0 ≤ P(E) ≤ 1
Everyday Language: Probability must be inclusive; not greater than the number 1 or less than 0
2. All probabilities add up to 1 in a sample space)
S = {e1, e2, …, en}, then P(e1) + P(e2) + … + P(en) = 1
Everyday Language: ??
The Probability Model
(In a probability experiment) Model that consists of all possible outcomes and each one’s probability.
Must satisfy the two cornerstones of probabilities.
EXAMPLE: Is it a Probability Model?
In a bag of peanut M&M milk chocolate candies, the colors of the candies can be brown, yellow, red, blue, orange, or green. Suppose that a candy is randomly selected from a bag. The table shows each color and the probability of drawing that color. Verify the chart below is a probability model.
Color | Probability |
Brown | 0.12 |
Yellow | 0.15 |
Red | 0.12 |
Blue | 0.23 |
Orange | 0.23 |
Green | 0.15 |

Determining Impossible, Certainty, and Unusual Events:
if P(E) = 0
the event is impossible
if P(E) = 1
the event is certain
if P(E) has a ⬇ probability
the event is unusual
Computing and Interpreting Probabilities Using the Empirical Method
Computing Probabilities (Using the Empirical Approach)
The probability of an E is approximately the number of times event E is observed divided by the number of trials in the experiment.”
So literally the relative frequency of an Event

EXAMPLE Interpreting Probabilities Using the Empirical Approach:
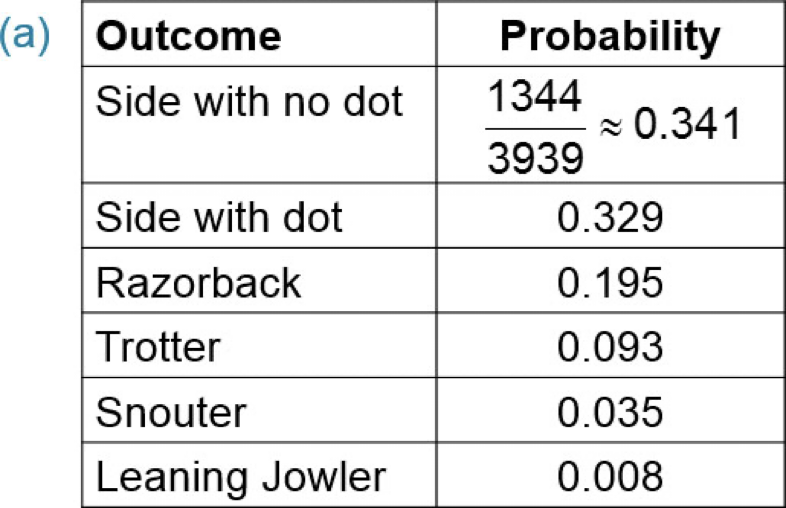
Pass the PigsTM is a Milton-Bradley game in which pigs are used as dice. Points are earned based on the way the pig lands. There are six possible outcomes when one pig is tossed. A class of 52 students rolled pigs 3,939 times. The number of times each outcome occurred is recorded in the table at right.
Outcome | Frequency |
Side with no dot | 1344 |
Side with dot | 1294 |
Razorback | 767 |
Trotter | 365 |
Snouter | 137 |
Leaning Jowler | 32 |
( a ) Use the results of the experiment to build a probability model for the way the pig lands.
So find RF of literally each event
Add up all frequencies of each event outcomes
Divide each Event frequency by that total

( b ) Estimate the probability that a thrown pig lands on the “side with dot”.

The probability a throw results in a “side with dot” is 0.329. Out of 1000 throws of the pig, we would expect about 329 to land on a “side with dot”.
( c ) Would it be unusual to throw a “Leaning Jowler”?
In respect to the other probabilities, it would be unusual to throw a Leaning Jowler”. We can expect to obtain a Leaning Jowler about 8 times (0.008) out of 1,000 throws.
How to use Minitab to compute probabilities:
Input category names into one column.
Input frequencies into the next column.
In the column after the, enter a name (having to do with probability)
Then go to the calculator (Calc > Calculator…)
“Store result in” should be your probability column.
Your expression should be
“frequency variable” / sum(”frequency variable”)
Don’t literally type in “frequency variable”. It’s whatever you named it.
Compute and Interpret Probabilities Using the Classical Method
This method requires EQUALLY LIKELY OUTCOMES
equally likely outcomes = when each simple event has the same probability of occurring.
If an experiment has n equally likely outcomes and if the number of ways that an event E can occur is m, then the probability of E, P(E) is…

So, if S is the sample space of the experiment, then…
EXAMPLE Computing Probabilities Using the Classical Method
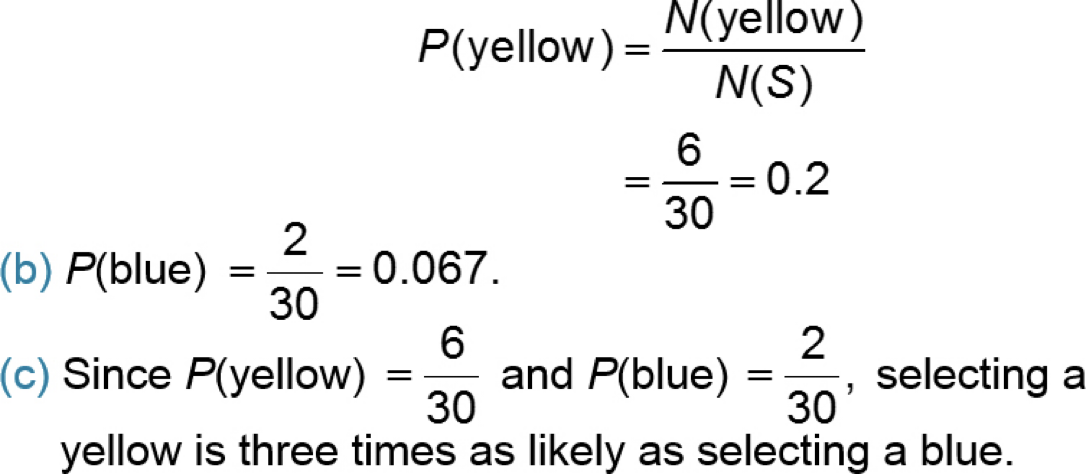
Suppose a “fun size” bag of M&Ms contains 9 brown candies, 6 yellow candies, 7 red candies, 4 orange candies, 2 blue candies, and 2 green candies. Suppose that a candy is randomly selected.
(a) What is the probability that it is yellow?
0.2
(b) What is the probability that it is blue?
0.067
(c) Comment on the likelihood of the candy being yellow versus blue.
yellow is 3 times more likely to be selected than blue.
Answers in detail:
(a) There are a total of 9 + 6 + 7 + 4 + 2 + 2 = 30 candies, so N(S) = 30.

Recognize and Interpret Subjective Probabilities
The subjective probability of an outcome is a probability obtained on the basis of personal judgment.
For example, an economist predicting there is a 20% chance of recession next year would be a subjective probability.
SUMMARY: Empirical, Subjective, and Classical Probabilities:
Empirical probability is based on observed data from an experiment, while classical probability relies on theoretical assumptions/practical reasoning where all outcomes are equally likely, and subjective probability is based on personal belief or intuition about the likelihood of an event occurring, with no formal calculations involved.
Key points:
Empirical Probability: "what we see happen”
Calculated by performing an experiment and observing the frequency of a specific outcome.
Example: Tossing a coin 100 times and finding the probability of getting heads by dividing the number of heads by the total number of tosses.
Classical Probability: "what we expect to happen based on theory"
Assumes all possible outcomes are equally likely and calculated based on the number of desired outcomes divided by the total number of possible outcomes.
Example: The probability of getting heads on a fair coin toss is 50% because there are two equally likely outcomes (heads or tails).
Subjective Probability: “what someone thinks will happen”
Based on an individual's personal opinion or belief about the likelihood of an event happening, without relying on concrete data or calculations.
Example: Estimating the probability of a specific team winning a sports game based on your personal knowledge and gut feeling.
Match these probabilities with their type: Empirical, Classical, or Subjective?
Experts claim there is an 80% chance the war in Ukraine will still be going on a year from now.
Subjective
The probability of rolling a die and getting a 1 is 1/6.
Classical
Last year, I bought 8 houseplants and 2 of them died. This year, I expect the probability that any given houseplant will die is 0.25.
Empirical
**Note that sometimes Empirical and Subjective are difficult to distinguish, but empirical is based on results of “equivalent past experiments” while subjective is more of an educated guess.
