BIOL 3410 Exam 3 Review
Exam 3 covers lectures “Introduction to Ecology” through “Trophic Interactions”.
Introduction to Ecology
Objectives:
Define ecology
Understand abundance and distribution and the distinction between habitat and niche.
Explain the rules of nature - conservation of energy, conservation of mass, and evolution.
Describe hierarchy of ecological organization.
Understand that organisms play diverse roles in ecology.
Describe approaches to studying ecology:
direct observation of nature
manipulative experiments
microcosm and lab experiments
ecological gradients
models
Ecology - scientific study of the abundance and distribution of organisms in relation to other organisms and environmetnal conditions
Habitat - place, or physical setting, in which an organism lives
Potential niche - range of abiotic and biotic conditions that an organisms can tolerate
Realized niche - range of abiotic and biotic conditions that an organism occurs
Distribution - geographic area where individuals of a species are present
Abundance - total number of individuals in a population that exists within a defined area
The Rules of Nature:
Conservation of energy (including carbon) - energy cannot be created or destroyed, but rather just changes form
Conservation of mass - mass cannot be created or destroyed, but rather just changes form
Evolution
Biotic and abiotic factors limit distribution and abundance
Biotic - living factors of an environment (i.e. organisms and interactions between them)
Abiotic - non-living factors of an environment (i.e. climate, soil, water availability, and physical conditions)
Hierarchy of Ecological Organization:
Individual - a living organism
Population - individuals of the same species living in a particular area
Community - all populations of species living together in a particular area
Ecosystem - one or more communities of living organisms interacting with their nonliving physical and chemical environments
Landscape - multiple ecosystems that are connected by the movement of individuals, populations, matter, and energy
Biosphere - all the ecosystems on Earth
Interactions Between Species:
Type of Interaction | Species 1 | Species 2 |
Predation/Parasitoidism | + | - |
Parasitism | + | - |
Herbivory | + | - |
Competition | - | - |
Mutualism | + | + |
Commenalism | + | 0 |
Types of Consumers:
Herbivore - organisms that consume producers
Predator - organisms that kill and eat other organisms
Parasitoid - organisms that lay eggs in or on another animal
Parasite - live in or on a host organisms
Climate & World Biomes
Objectives:
Distinguish between climate and weather
Explain features of Earth-Sun movement and how they influence climate and seasonality
Explain features of atmosphere and ocean processes and their function in energy redistribution globally, including:
the greenhouse effect
the Hadley cell and ITCZ
ocean surface and deep currents
Describe the world’s major biomes and their relation to climate
Weather - short-term variation in light, temperature, wind, humidity, etc.
Climate - long-term average of weather (may include seasonality)
Albedo - the fraction of solar energy reflected by a surface
The Earth is tilted 23.5 degrees, causing an uneven distribution of sunlight and causing seasons.
Earth’s Greenhouse Effect - incoming solar radiation is partially captured and re-emitted by greenhouse gases in the atmosphere, which helps to regulate the planet's temperature, warming the plant and creating a stable environment for life through processes such as trapping heat and reducing temperature fluctuations.
Wavelengths/Electromagnetic Radiation:
The temperature of a body determines wavelengths of emitted energy.
Solar radiation his high energy (short wavelength) → penetrates the atmosphere
Earth emits low-energy (long wavelength) → absorbed by the atmosphere
Radiations:
X & gamma → <300 nm; 1% of total form sun
UV → 300-400 nm; 8%
Visible → 400-700 nm; 40%
Near-Infrared → 700-1500 nm; 40%
Lower energy → >1500 nm; 11%
Hadley Circulation - hot, moist air rising and cool, dry air sinking, causing a circulation of the air
Influenced by the Coriolis effect (spinning)
Cells:
Polar Cell - pole to 60 degrees
Ferrel Cell - 60 degrees to 30 degrees
Hadley Cell - 30 degrees to 0 degree (equator)
InterTropical Convergence Zone (ITCZ) - is due to uneven heating (tilt/rotation)
Shifts seasonally
Leads to seasonality of precipitation in many places
Two rainy seasons near the equator
Ocean surface currents transport energy on a short time scale.
Deep ocean currents transport energy on a large time scale.
Thermohaline circulation - ocean water moves due to density differences associated with temperature and salinity
Atmospheric and oceanic circulation determine climate — energy distribution, redistribution, and resulting global air and ocean circulation control general climate patterns:
Tropics are warm and moist
30 degres N and S are dry and hot
Poles are dry and cold
Europe is warmer than North America at the same latitude
Pacific Northwest is cool and moist
The Middle East and Saharan Afric are hot and dry
Convergent Evolution - often caused by a similar climate
World biomes are determined by climate.
The productivity of wold biomes depends on climate.
9 Major Biomes:
Tundra and boreal forest - plant productivity is energy limited
Tundra - short statured herbaceous plants and shrubs
Boreal - evergreen and deciduous forest that regularly burns
Temperate rainforest and temperate seasonal forest - plant productivity is seasonally energy limited and they are highly productive; evergreen and deciduous forest
Tropical Rainforest (jungle) - highly productive and very high biodiversity
Savanna - seasonally dry
Woodland/shrubland - hot dry summers and mild wet winters; drought tolerant grasses, shrubs, and small trees
Temperate Grassland - productivity depends on rain (varies greatly); evolution of grazing
Subtropical (Cold) Desert - very dry (sometimes years without rain); plants are highly specialized to deal with drought
Climate Change
Objectives:
Understand forcing agents for climate change including time scales relevant to evolution.
Explain the greenhouse effect and how we are changing it.
Examine evidence of change in these climate features:
surface air T, surface ocean T
precipitation, snow cover
land and sea ice
sea level rise
Explain how proxies are used to understand past climate:
tree rings, ice cores, ocean sediments
Understand that human actions impact future climate (and what models suggest might happen).
Forcing agents that influence climate:
Earth-Sun geometry
Greenhouse gases
Land-use (albedo) change — how much sunlight is reflected
Volcanic activity (sulfur dioxide aerosols)
Solar activity (minor changes)
Greenhouse gases - absorb and emit strongy in the infrared region
From most to least important radiative effect — H2O - CO2 - CH4 - N2O - CFCs
Observed changes include temperature, precipitation and atmospheric moisture, snow cover, sea level, climate variability and extreme events, and biological systems
Z-score (standard score) - allows data from different locations to be combined, removes the mean, and scales by standard deviation
dimensionless
→ z-score
→ observed value
→ mean of the population
→ standard deviation of the population
Temperature change is statistically significant.
The global average air temperature has risn ~1.0 degrees Celcius above the pre-industrial baseline.
Climate proxy records are derived from:
Ice cores - record of past climate
Tree rings
Historical data
etc.
Milankovitch cycles - change in Earth-Sun geometry
Currently, due to climate change…
glaciers are melting
there is a winter snow drought
sea ice is decreasing
ice caps are melting
sea level is rising
atmospheric CO2 is rising
Relative to global net photosynthesis, the scale of fossil fuel energy use is 3 times larger.
There is a seasonal cycle in atmospheric CO2 due to photosynthesis and respiration of land ecosystems.
Acclimation to Variable Environments
Objectives:
Understand the distinction between regulators and conformers.
i.e body T of endotherms and ectotherms
Explain phenotypic plasticity.
Define and identify homeostasis, acclimation, developmental plasticity, and avoidance.
Recognize examples of phenotypic responses to environmental stress such as…
physiology/biochemistry
morphology
behavior
avoidance
Evolution - change in allele trequency of generations
Phenotypic Plasticity - a single genotype with variation in phenotype
Same genes, different traits/characteristics
2 Ways to Cope with a Changing Environment:
Regulator | Conformer | |
energy required | high | low |
food required | more | less |
growth rate | faster | slower |
thermal niche | narrower | wider |
fitness | ??? | ??? |
Responses to Environmental Variations:
Homeostasis - maintenance of a nearly constant internal environment within a varying external environment
Quick, short-term reversible responses; behavioral
Acclimation - reversible phenotypic change in an individual organism in response to changing environmenta conditions
Long-term (slow) reversible responses
Developmental Plasticity - differences in phenotypic traits for a given genotypes under different environmental conditions
Slow and irreversible
Avoidance (of adverse environments) - two different types; can be relatively slow or quick and reversible or permanent
Migration - seasonal movement of animals from one region to another
Dormancy - dramatic reduction of metabolic processes to rely on storage
Microhabitat - specific location within a habitat that typically differs in environmental conditions form other parts of the habitat
Population Growth & Regulation
Objectives:
Define population ecology.
Explain why populations can grow rapidly under ideal conditions.
Compare and contrast exponential and logistical population growth.
State and interpret the elements of the equations for exponential and logistical population growth.
Identify factors that contribute to density dependent growth.
Explain carrying capacity.
Describe what happens if a population overshoots carrying capacity.
Population Ecology - the study of how and why the number of individuals in a population changes over time
Exponential Growth Model:
→ population size
→ population growth rate (change in size over time)
→ change in population size
→ change in time
→ births per capita
→ deaths per capita
→ per capita population growth rate
The per capita population growth (r) describes the rate of population change.
Exponential model:
exponential growth → b>d (or r>0)
no growth → (or )
exponential decline → b<d (or r<0)
Population size will be regulated or will level at some point in time due to interactions between individuals and the environment (biotic and/or abiotic factors).
The exponential growth model assumes…
essential resources are unlimited.
the environment is constant (with minimal predation).
However, as the density of a population increases…
fecundity (birth) decreases
mortality (death) increases
Logistical Growth Model:
→
→ carrying capacity of a population
The carrying capacity () describes the upper size limit of a stable population.
As approaches , the term approaches zero, slowing population growth.
,
When is low relative to , the term is close to 1.0 and the population growth follows the exponential model ().
Density Independent - factors that limit population size regardless of the population’s density
Overshoot - when a population grows beyond carrying capacity
Die-off - a substantial decline in density that typically goes well below the carrying capacity
can change depending upon how far the population overshot it and how fast the resource can bounce back.
Carbon is Energy
Objectives:
Understand the importance of photosynthesis for life.
Understand the ecological equivalence of energy and organic carbon.
Explain the distribution of biomass carbon across taxa.
Explain the basic ecosystem carbon cycle (GPP, NPP, respiration).
Distinguish autotrophic and heterotrophic respiration.
Explain the ecological importance of decomposition.
Know that these processes occur in terrestrial and aquatic environments.
Photosynthesis:
Major Drivers of Photosynthesis:
Climate, biome type, and time since disturbance (long-term)
Sunlight
Water
Temperature
Season length
Nutrients
Light is attenuated by water.
Ocean photosynthesis productivity is the highest in shallow coastal water.
Photosynthesis rate depends strongly on nitrogen content.
Worldwide primary productivity depends on the climate.
Carbon Cycle:
GPP → Gross Primary Production (Total Photosynthesis)
→ plant respiration
NPP → Net Primray Production (Net carbon gain by photosynthesis after plant respiration)
NPP varies seasonally.
Only ~1% of solar energy is converted by photosynthesis (GPP).
~60% is lost to plant respiration, yielding ~40% as NPP.
NPP is the food/energy source for all living things.
Autotrophic Respiration - respiration by plants
Heterotrophic Respiration - respiration by other organisms
Growth Respiration - the cost of growth is similar among plant species and plant parts
Maintenance Respiration:
Maintenance Respiration - cost of maintaining living tissue
i.e. protein turnover, membrane repair, etc.
Rates are primarily controlled by…
protein content — high nitrogen tissues have high
temperature — high T means high turnover
drought — synthesis of osmotic compounds
Ion uptake respiration () → the energy cost of taking up ions in the roots
Will correlate with NPP
Respiration rate is directly related to tissue N in plants.
Decomposition and cycling of organic material occurs in all biomes (both terrestrial and aquatic).
Decomposition - physical and chemical breakdown of detritus
Soil Organic Matter (SOM, SOC) - complex mix of dead organic matter
Labile - organic compound that is easily decomposed (i.e. sugars, aminos)
Recalcitrant - organic compound that is resistant to decomposition
Trophic Interactions
Objectives:
Understand that ecological communities are functionally structured.
Define and recognize consumption, assimilation, production, and trophic efficiency.
Contrast assimilation efficiencies of carnivores and herbivores.
Contrast production efficiencies of endotherms and ectotherms.
Describe the significance of trophic efficiencies in an ecosystem.
Explain the concept of keystone species.
Ecological Community - groups of taxa that interact with each other and the environment
Community - all populations of different species that occupy a given area, thus interacting either directly or indirectly
consumption efficiency
Consumption Efficiency - amount ingested over amount produced by herbivores
assimilation efficiency
Assimilation Efficiency - amount digested over amount ingested
Average animal/bacteria are mostly protein.
Average plant/algae are mostly carbohydrates.
Energy flow between trophic levels → assimilation efficiency is higher for animal food than plant food (indigestible cellulose and lignin)
Carnivores → ~70-90%
Herbivores → ~20-60%
production efficiency
Production Efficiency - conversion of assimilated food into new biomass
(growth and reproduction) / (energy assimilated)
The energy flow between trophic levels (production efficiency) depends on the metabolic rate of the consumer.
Ectotherms → ~10-40%
Endotherms → ~<5%
trophic (ecological) efficiency
Trophic Efficiency - overall efficiency of energy transfer between trophic levels
(consumer biomass) / (prey biomass)
percent of energy in the prey that is converted into consumer biomass
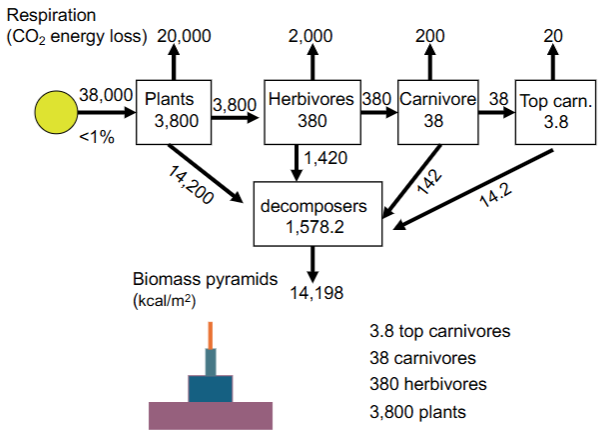
Average is ~10%
~90% is lost at each trophic level
Biomass & Energy in Terrestrial & Aquatic Ecosystems:
Terrestrial - most of the energy and standing biomass is in producers
Aquatic - most of the energy is in producers and most of the biomass is in top predators
The relative turnover rate of trophic levels differ.