Chapter 21
- Complex traits are influenced by multiple genes, interactions, variation in environment, and interaction between alleles and environment
- Analyzing quantitative trait variation
- Factors causing continuous variation of quantitative traits- number of genes that determine the trait and genetic and environment factors that affect penetrance and expressivity of genes
- Goal of quantitative effects from the environmental effects
- Studies of dandelions can help sort out the effects of genes vs the environment
- Goal is to compare influence of genes and environment on length of stem at flowering
- Environmental Variance
- most dandelion seeds arise from mitotic divisions (all seeds from single plant are genetically identical)
- grow in variable environment, such as a hillside
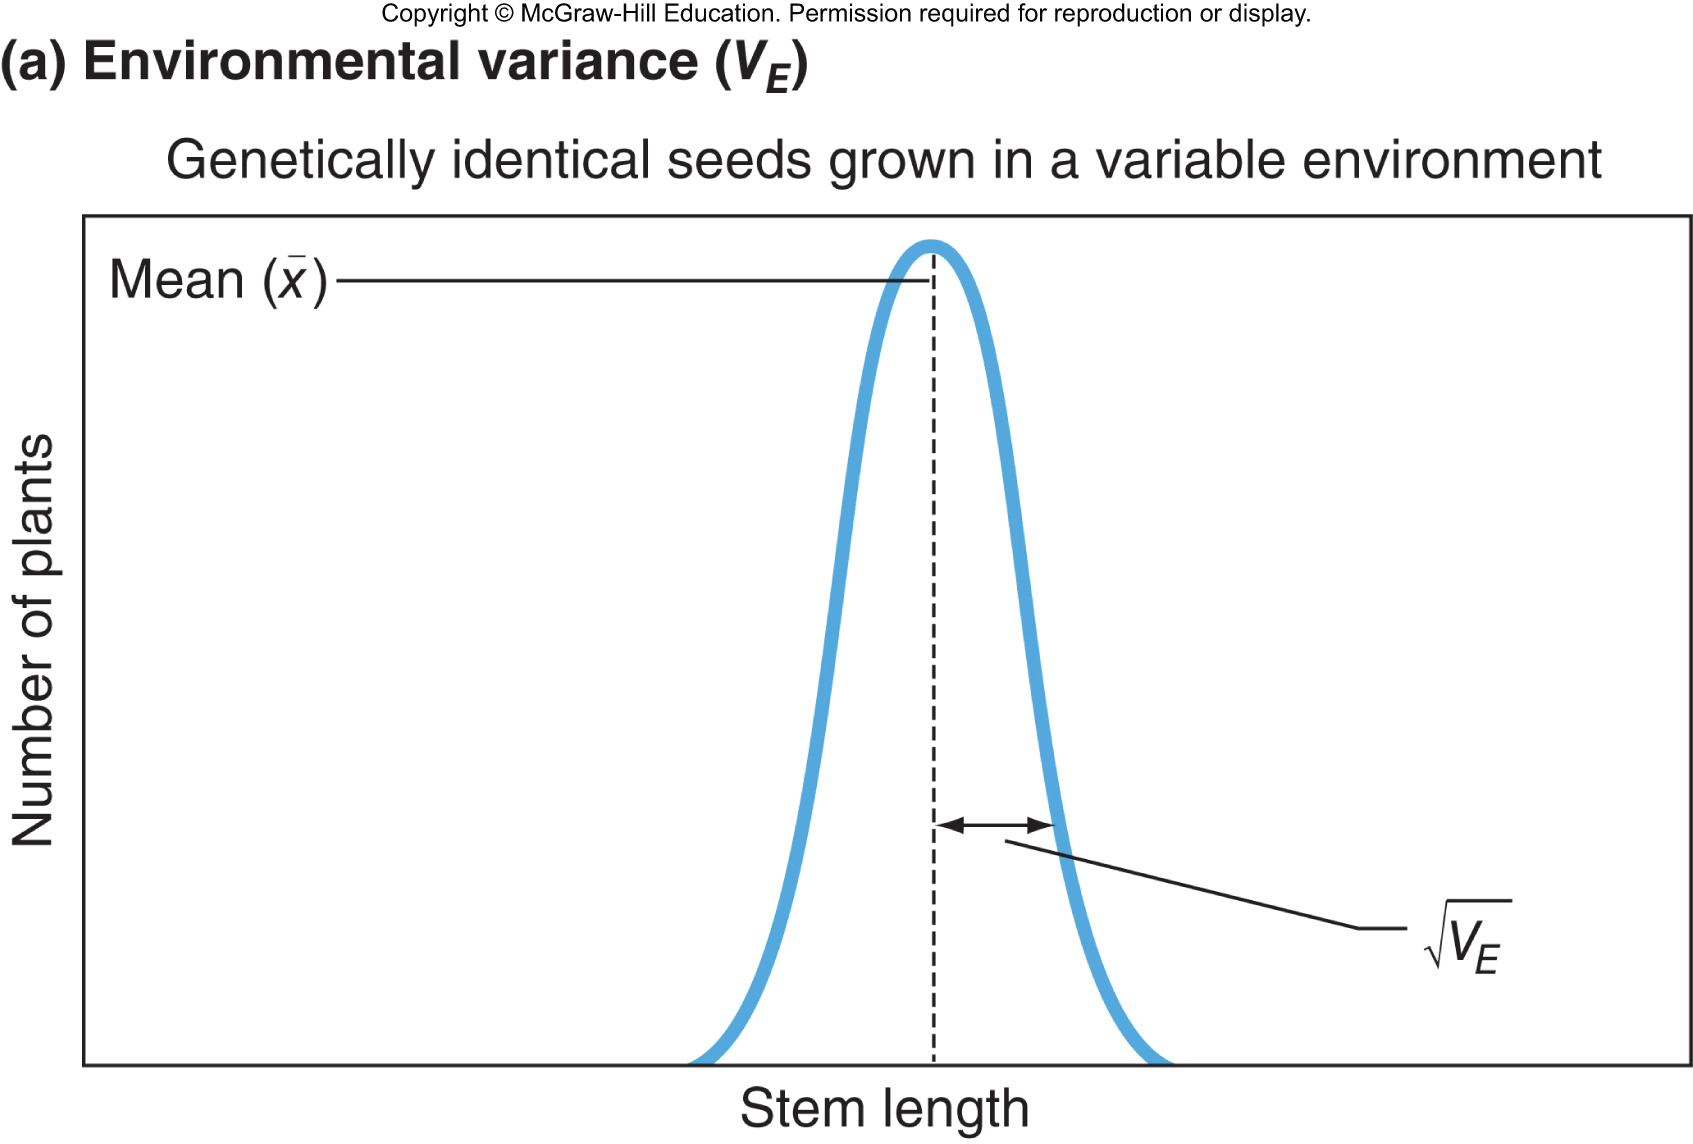
- Genetic Variance
- to calculate genetic variance- keep environment constant by growing genetically different seeds in a greenhouse
- Total Phenotypic Variance
- grow genetically diverse seeds on a hillside
- total phenotype variance= genetic variance + environmental variance
- wider graph
- Heritability- proportion of phenotypic variance due to genetic variance
- Heritability of a trait is the porportion of total phenotypic variance to genetic variation (VG/VP)
- broad sense variability is measured only when comparing identical twins to each other
- Equations
- VP = VE + VG
- VG = VA + VD + VI
- VA = Variance due to additive genetic effects
- VD = Variance due to dominance effects
- VI = Variance due to loci interaction
- Narrow-sense
- VA/VP
- VA/(VA+VD+V1+VE)
- narrow sense heritability looks at the additive variance
- genetic relatedness- average fraction of common alleles at all genetic loci shared by relatives
- only 1 allele at any given locus is shared
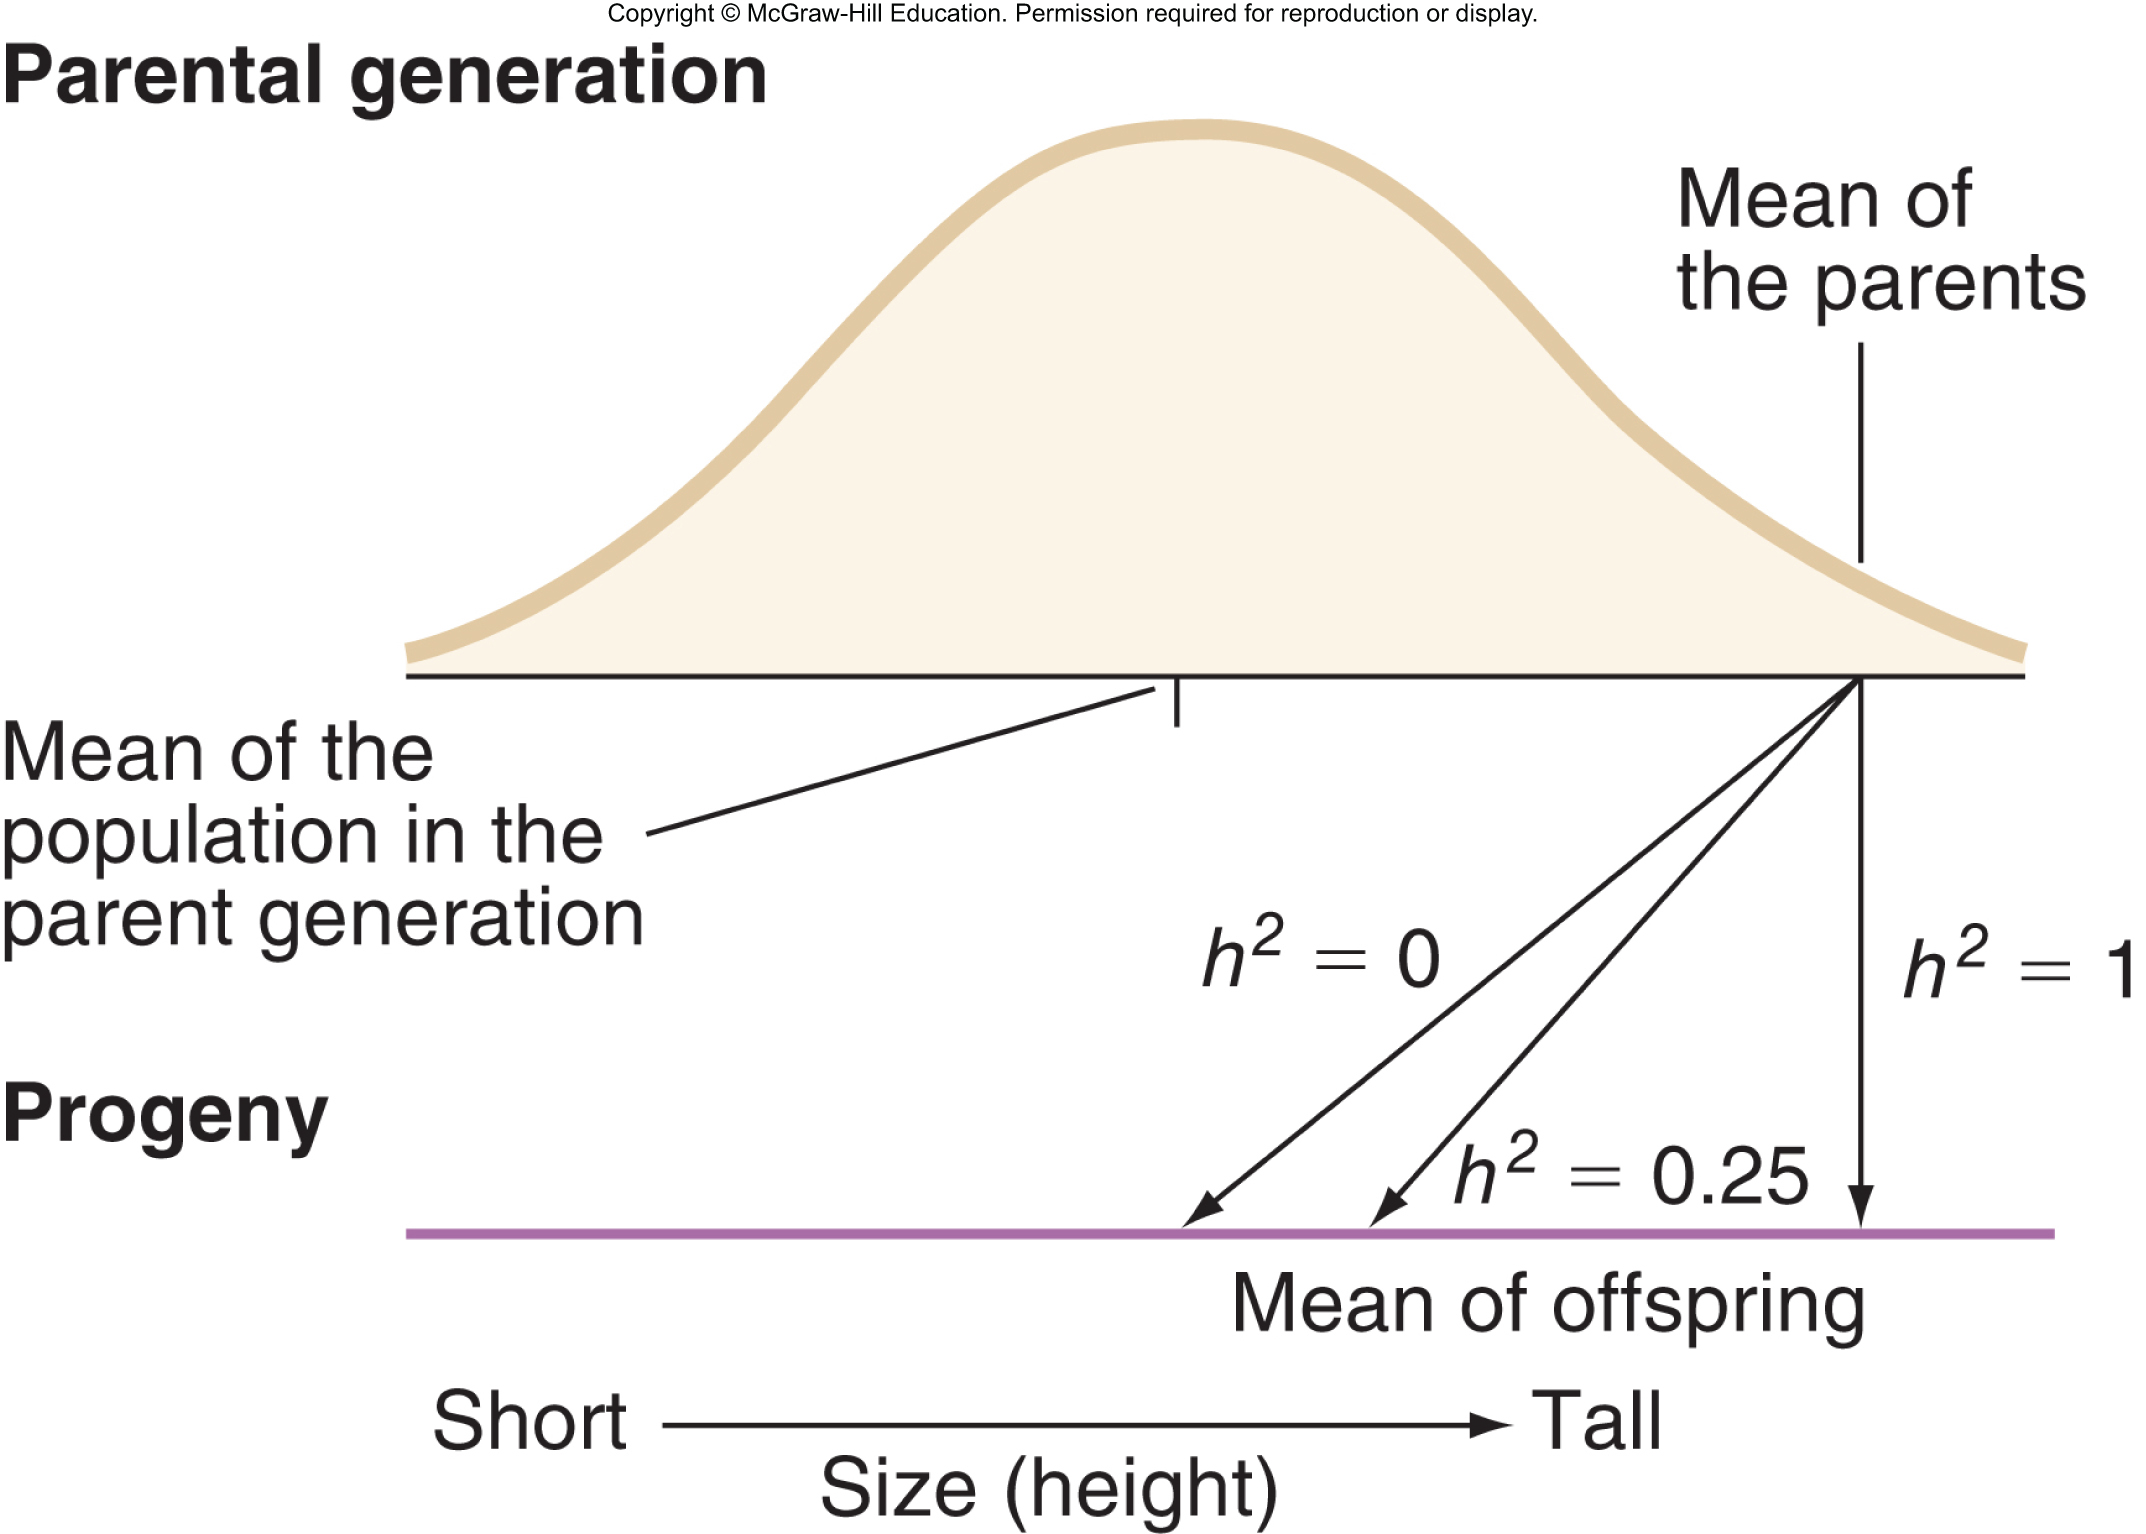
- Relationship between heritability and mean phenotypic values of parents, offspring, and overall population
- Measuring the heritability of bill depth in populations of Darwin’s finches
- Geospiza fortis on Daphne Major in the Galapagos Islands
- correlation between beak size of offspring and the average of parents’ beak size
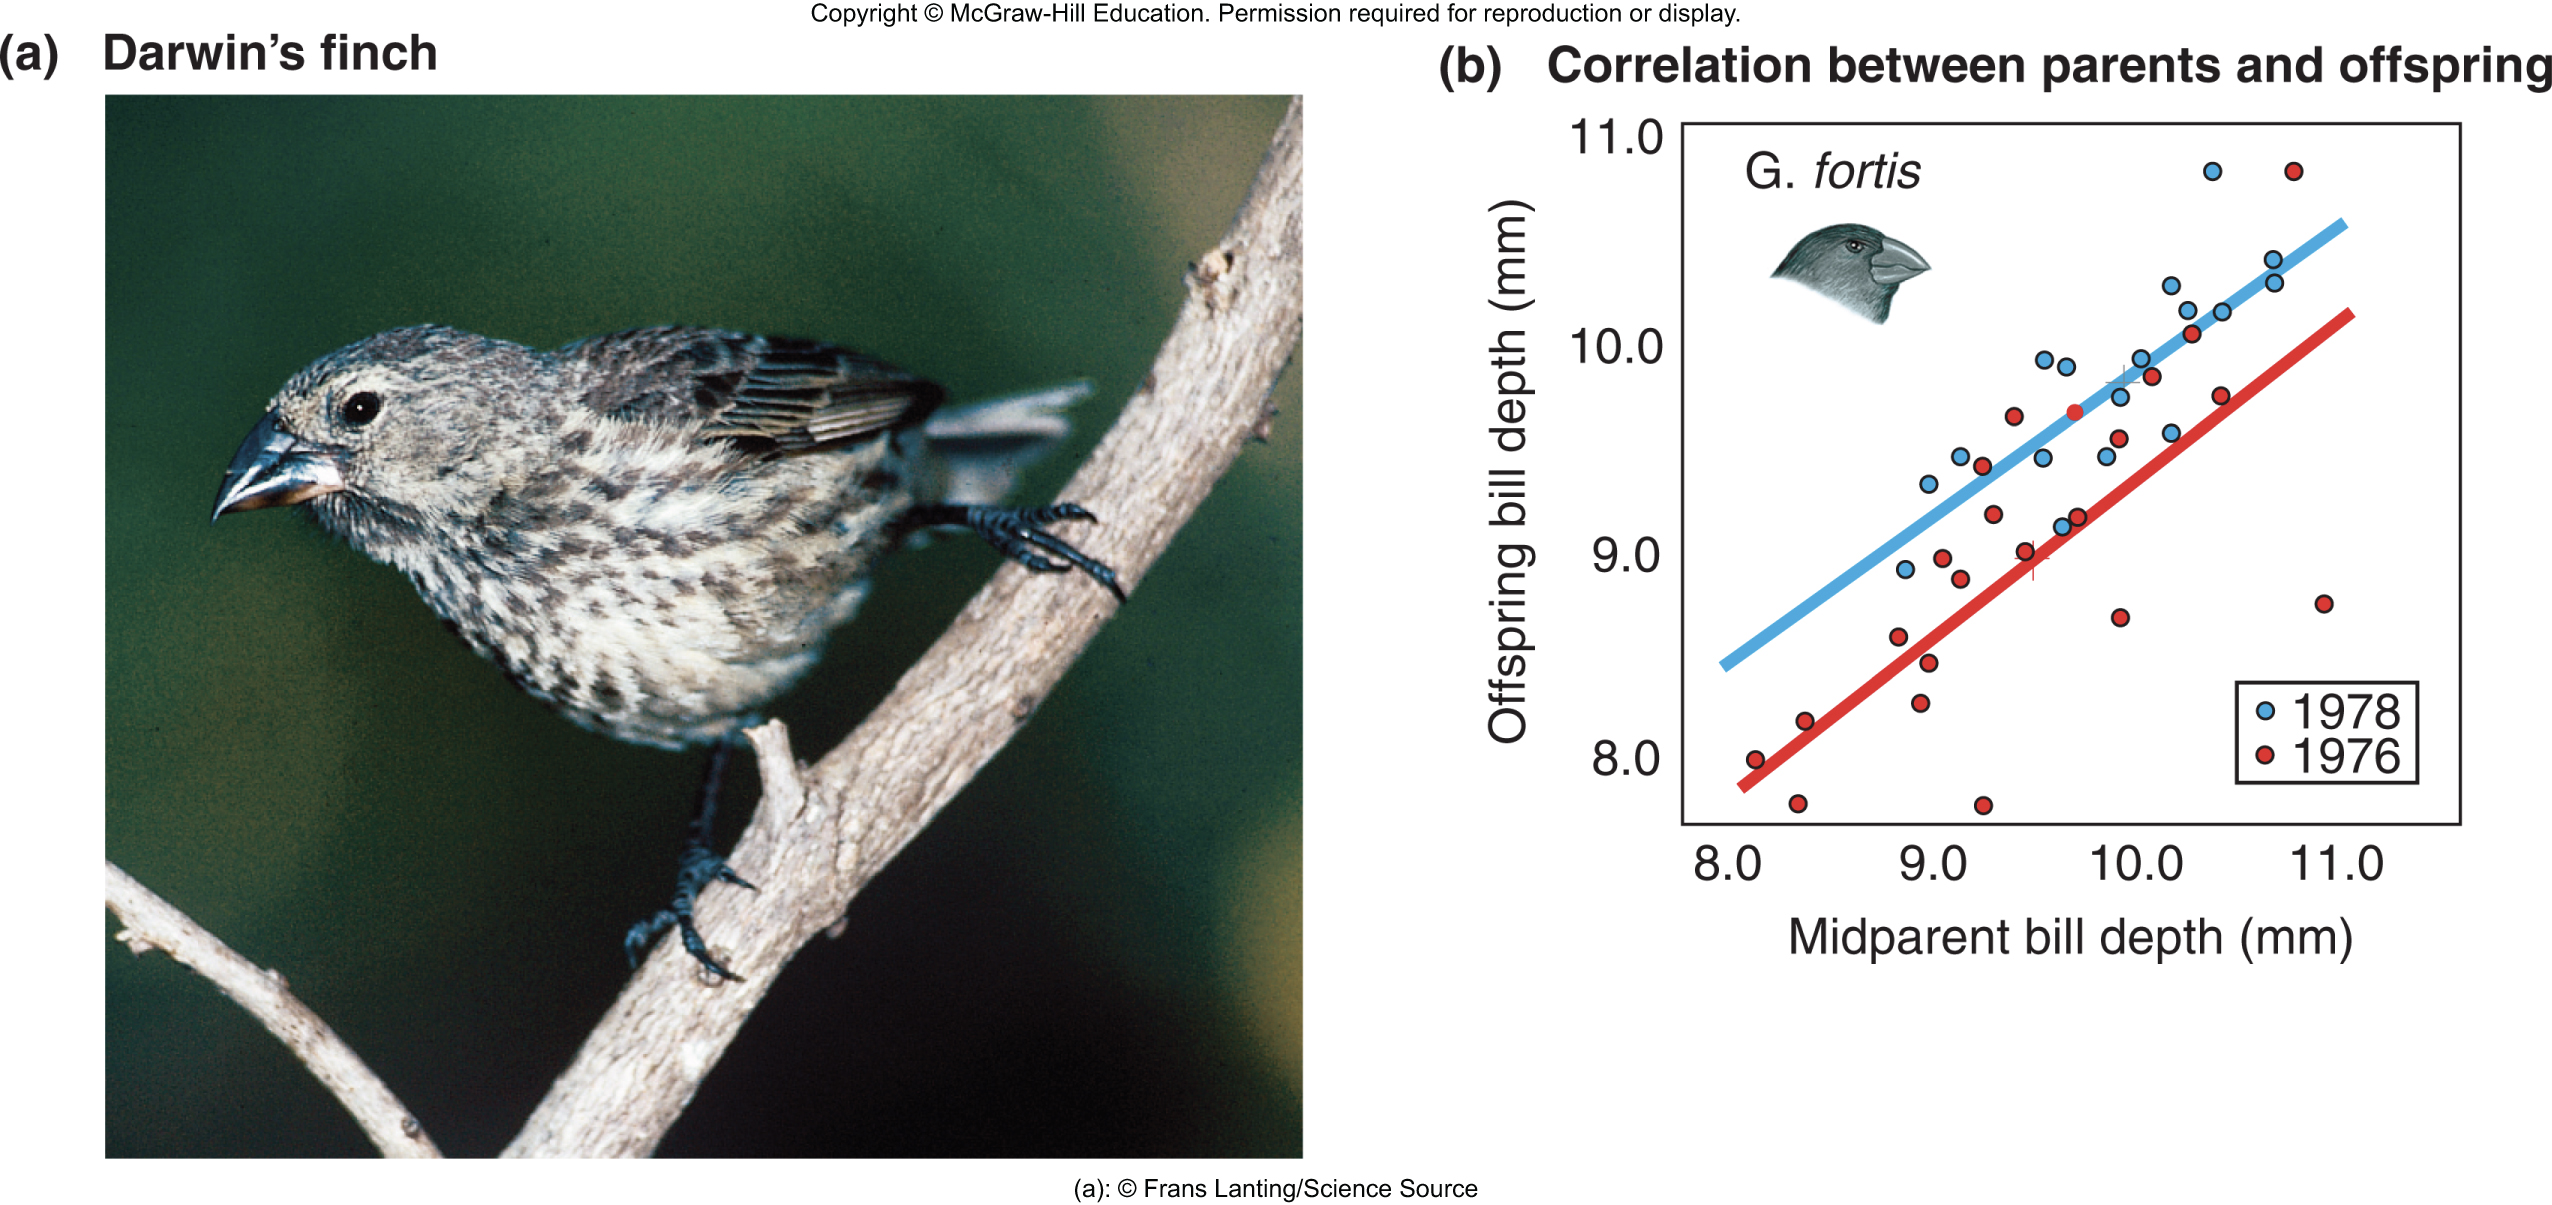
- Results in finch populations had no environmental or genetic effects
- if environment had no effect- heritability would be 1
- if no genetic contribution- heritability would be 0
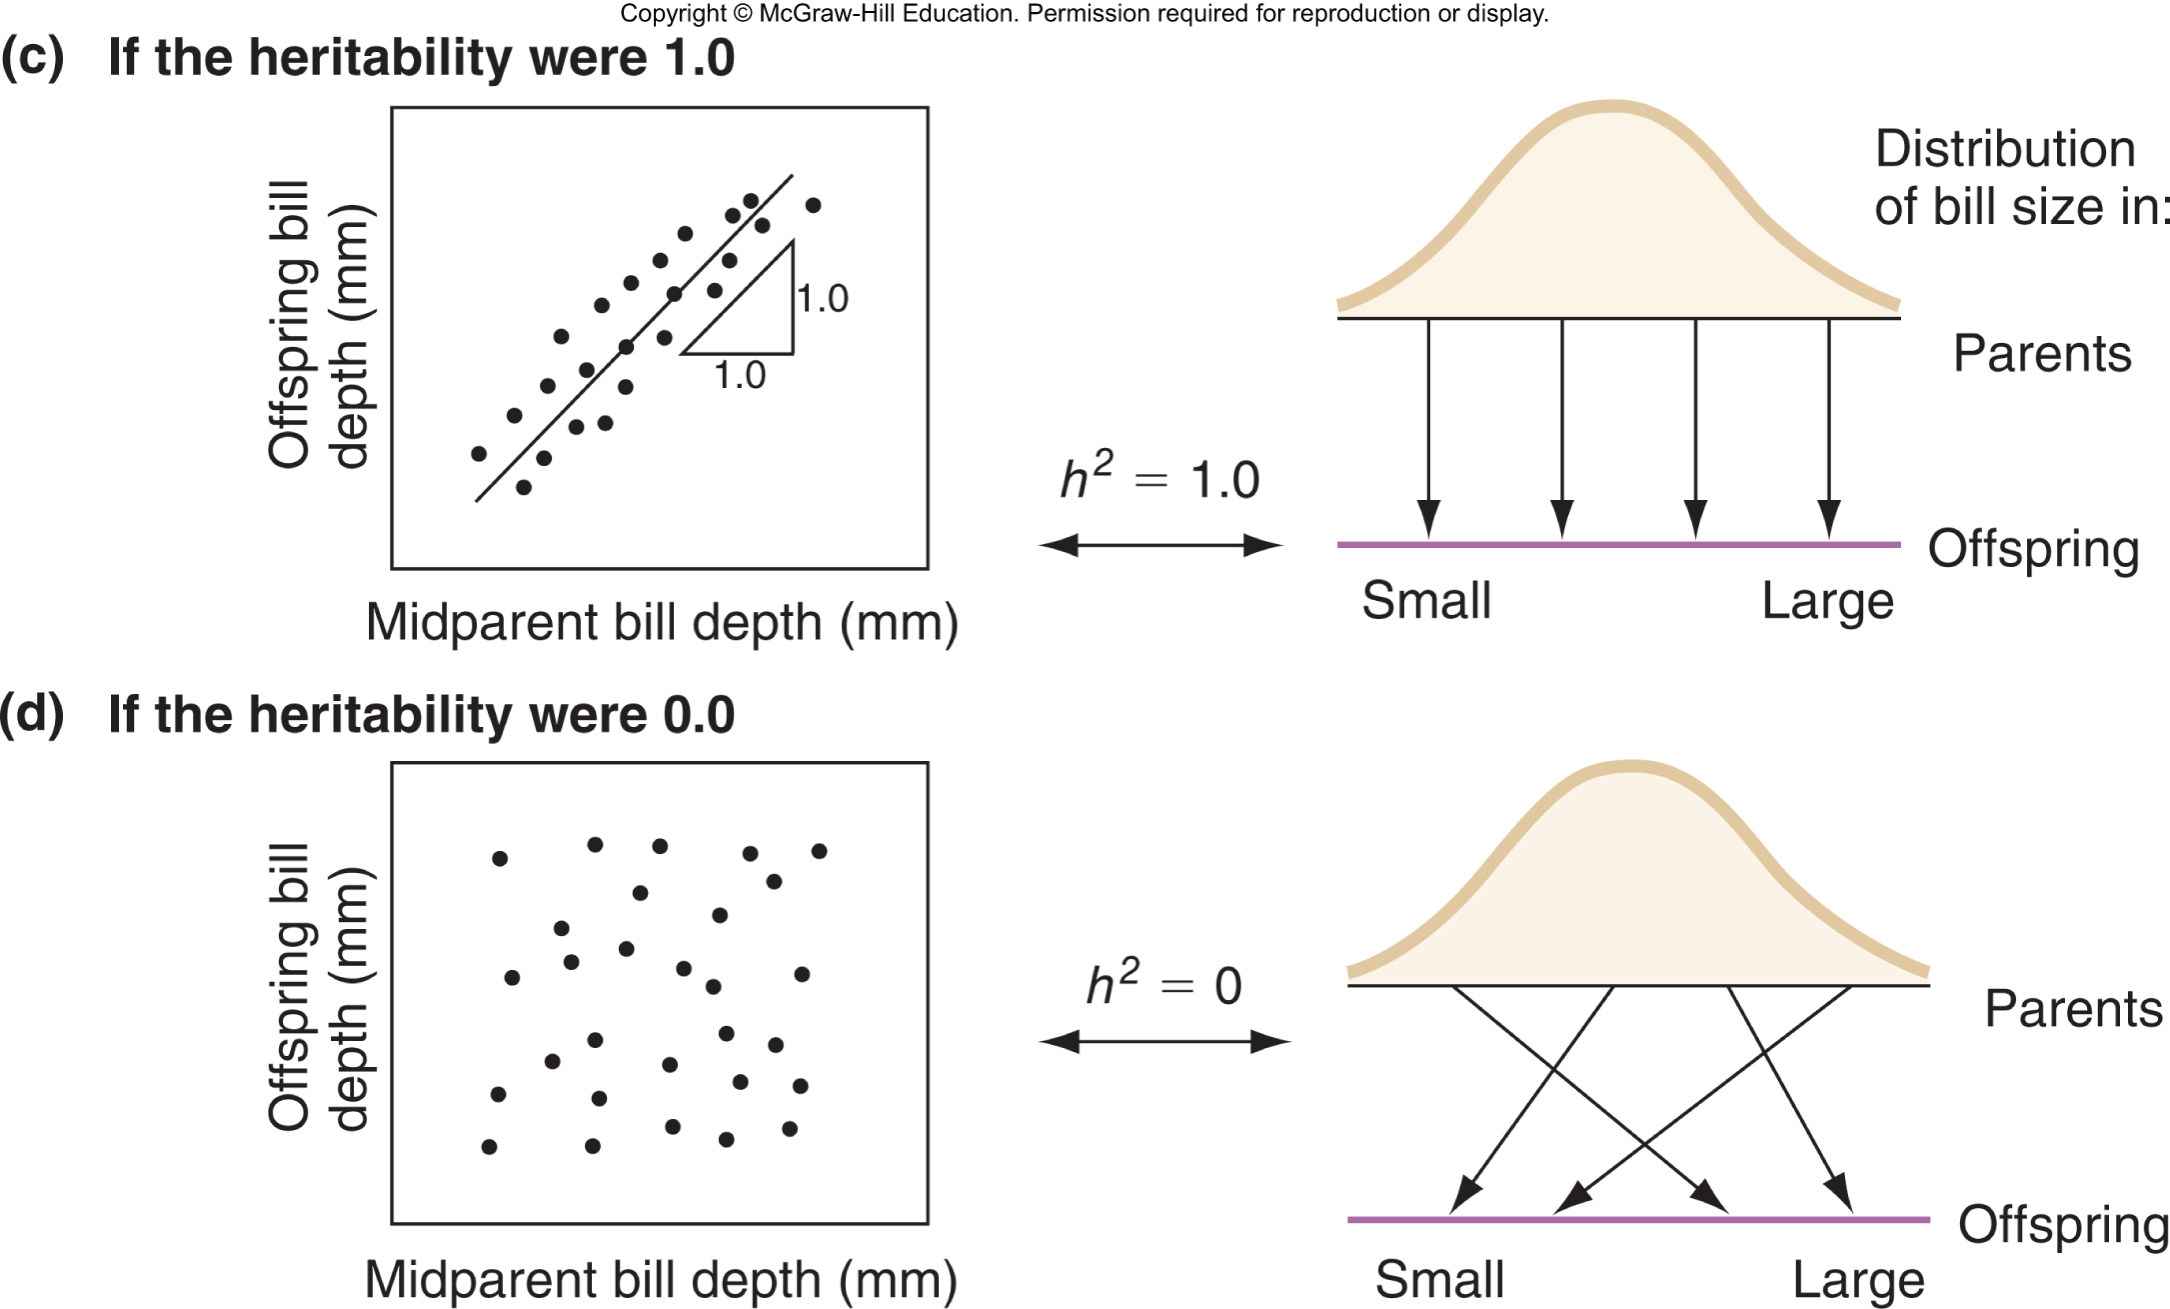
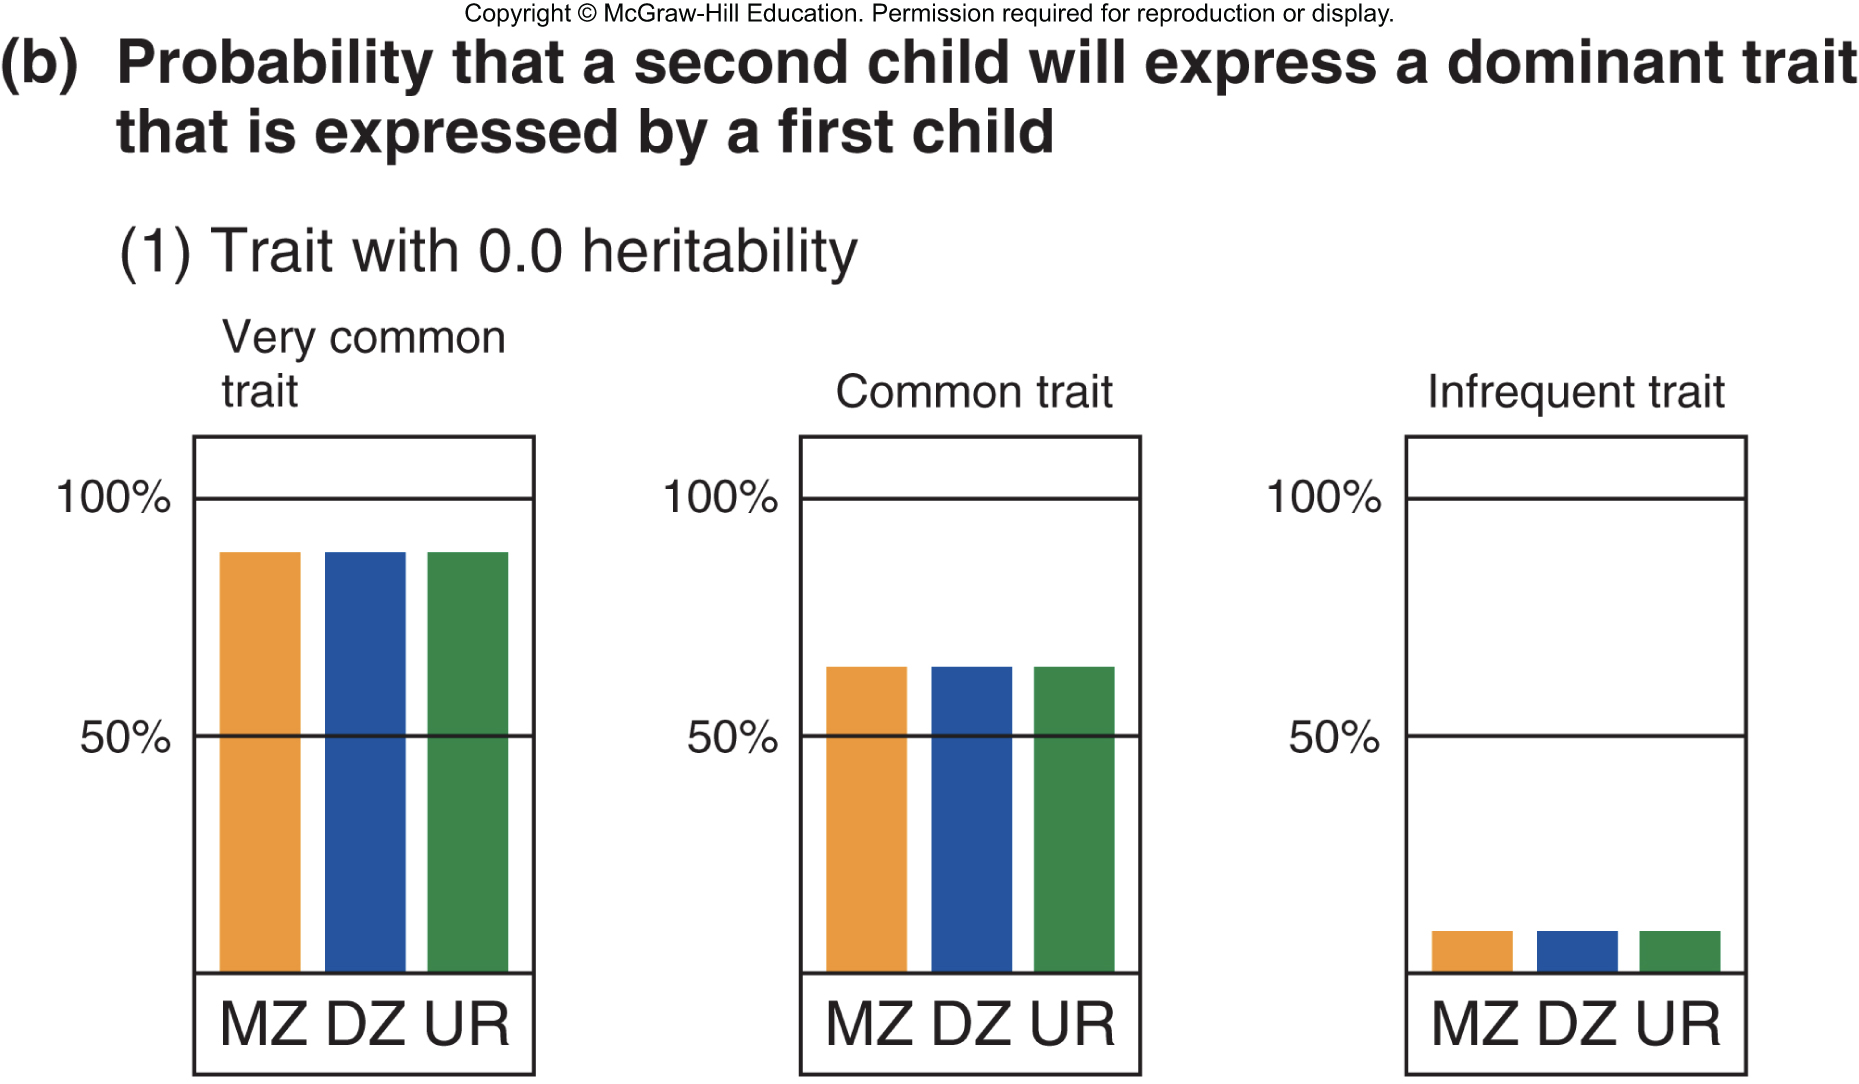
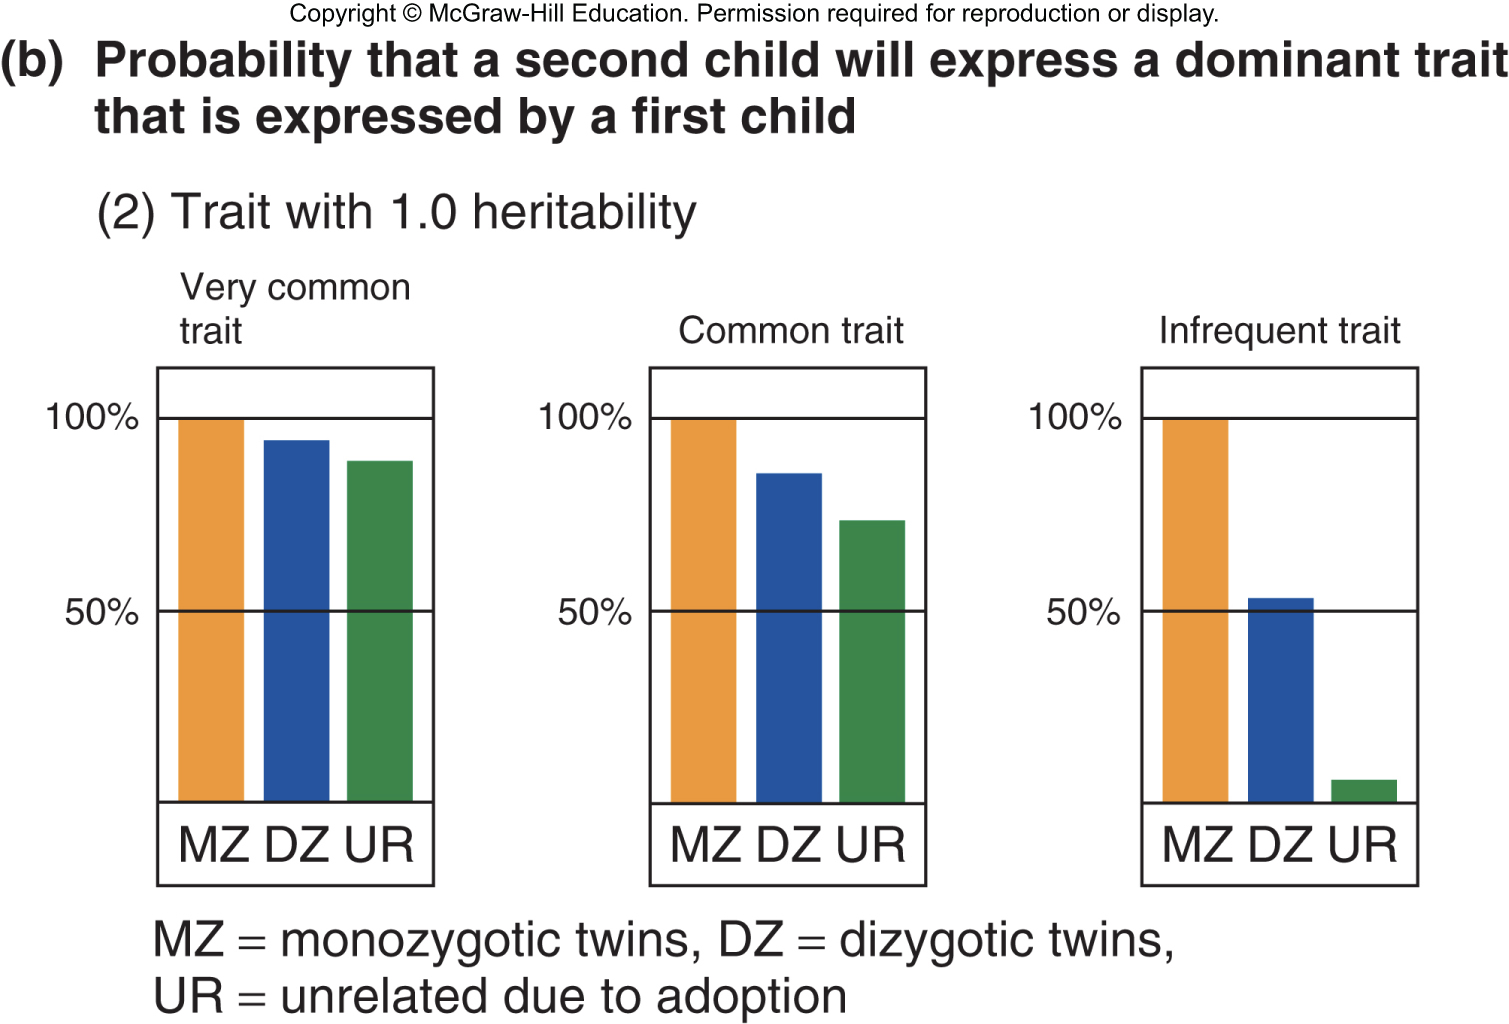
- Concordance of a trait in two children raised in the same family
- heritability 0- no differences observed between monozygotic, dizygotic, or unrelated by adoption
- if heritability is 1- differences would be observed in monozygotic, dizygotic, or unrelated by adoption
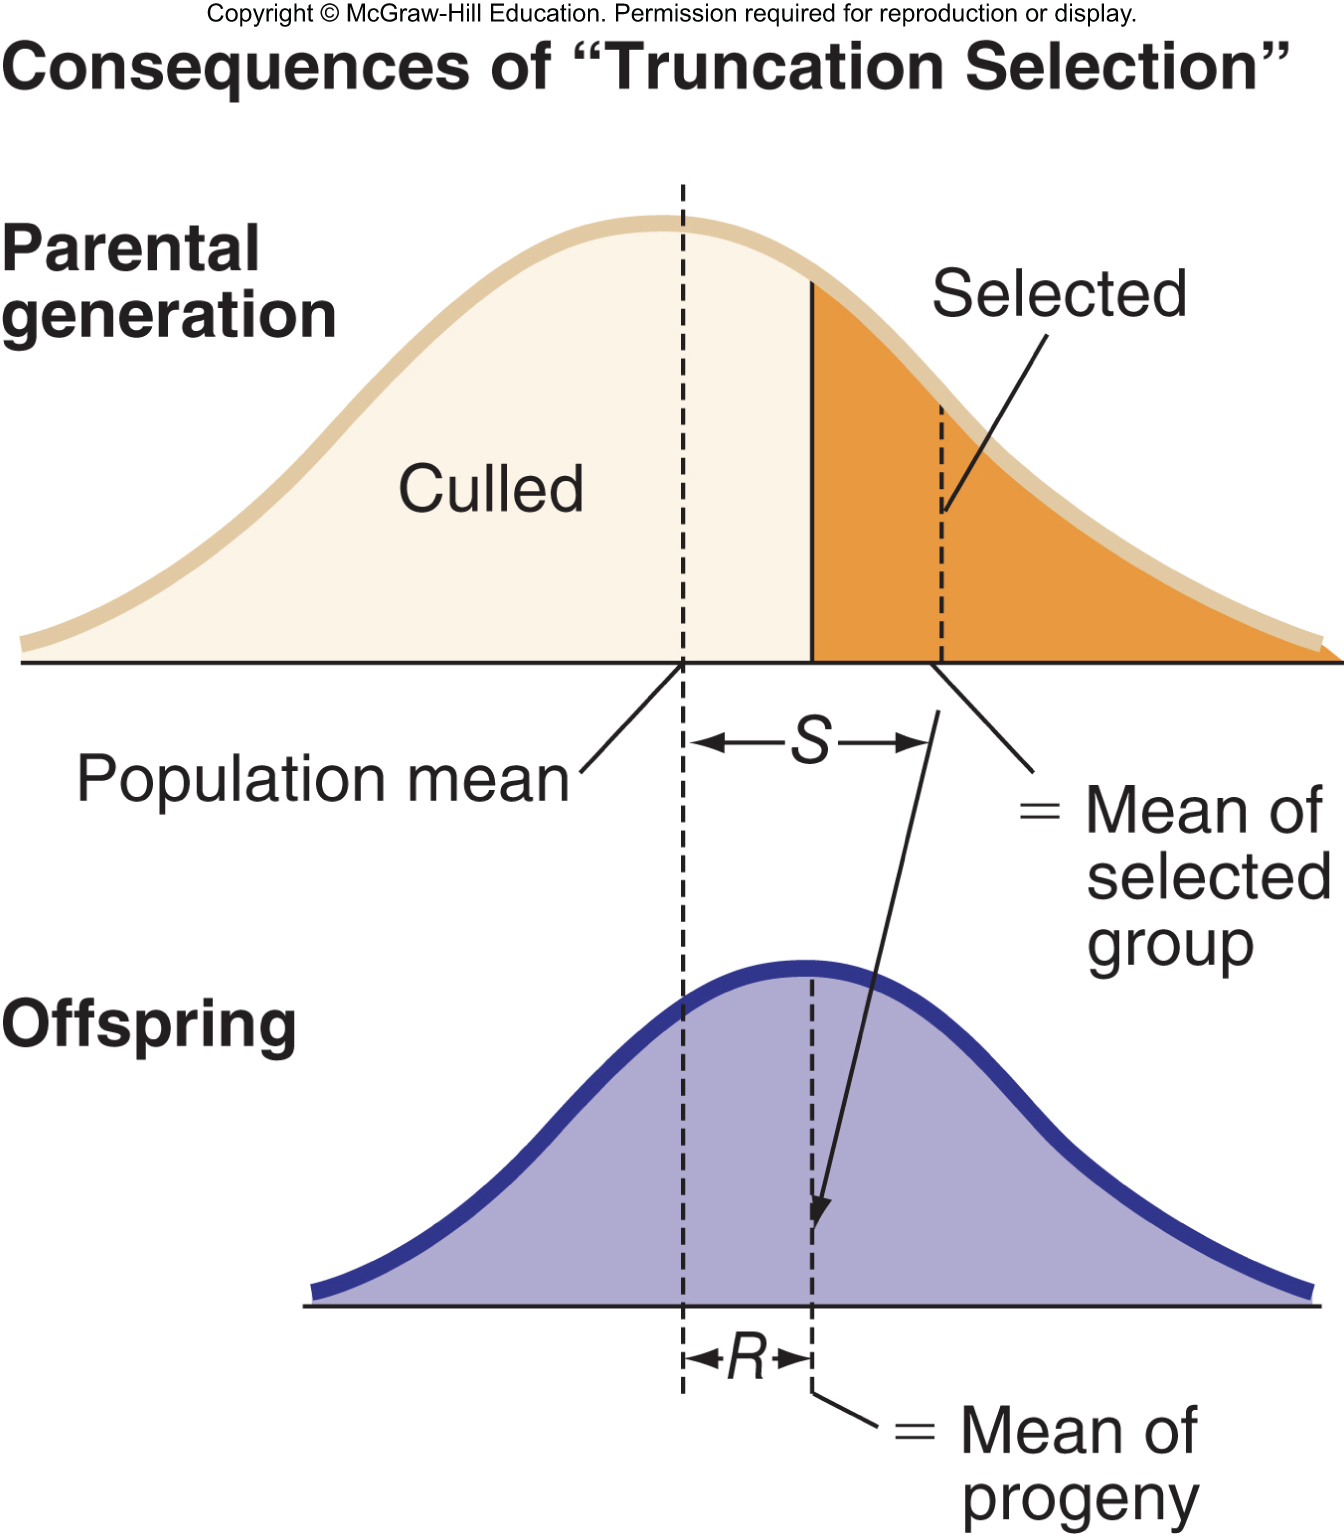
- A trait’s heritability determines its potential for evolution
- selection differential (S)- difference between value for this trait in the parents and value for this trait in the entire population (breeding and non-breeding)
- Response to selection (R)- amount of change in the mean value of a trait that results from selection
- R=h^2S
- Two approaches for mapping QTLs
- Quantitative trait loci- genes that contribute to complex traits
- mapping QTLs depends on producing individuals with different genetic compositions
- Direct QTL mapping- requires crosses between individuals that differ in the phenotype of interest
- Association mapping- takes advantage of the hisotry of a random breeding population
- Direct QTL mapping- looks for joint segregation of the phenotype and genetic markers
- rough mapping:
- cross individuals showing 2 extremes of a phenotype
- identify DNA markers that segregate with phenotype
- markers strongly correlated with phenotype are likely to be near genes that influence the trait
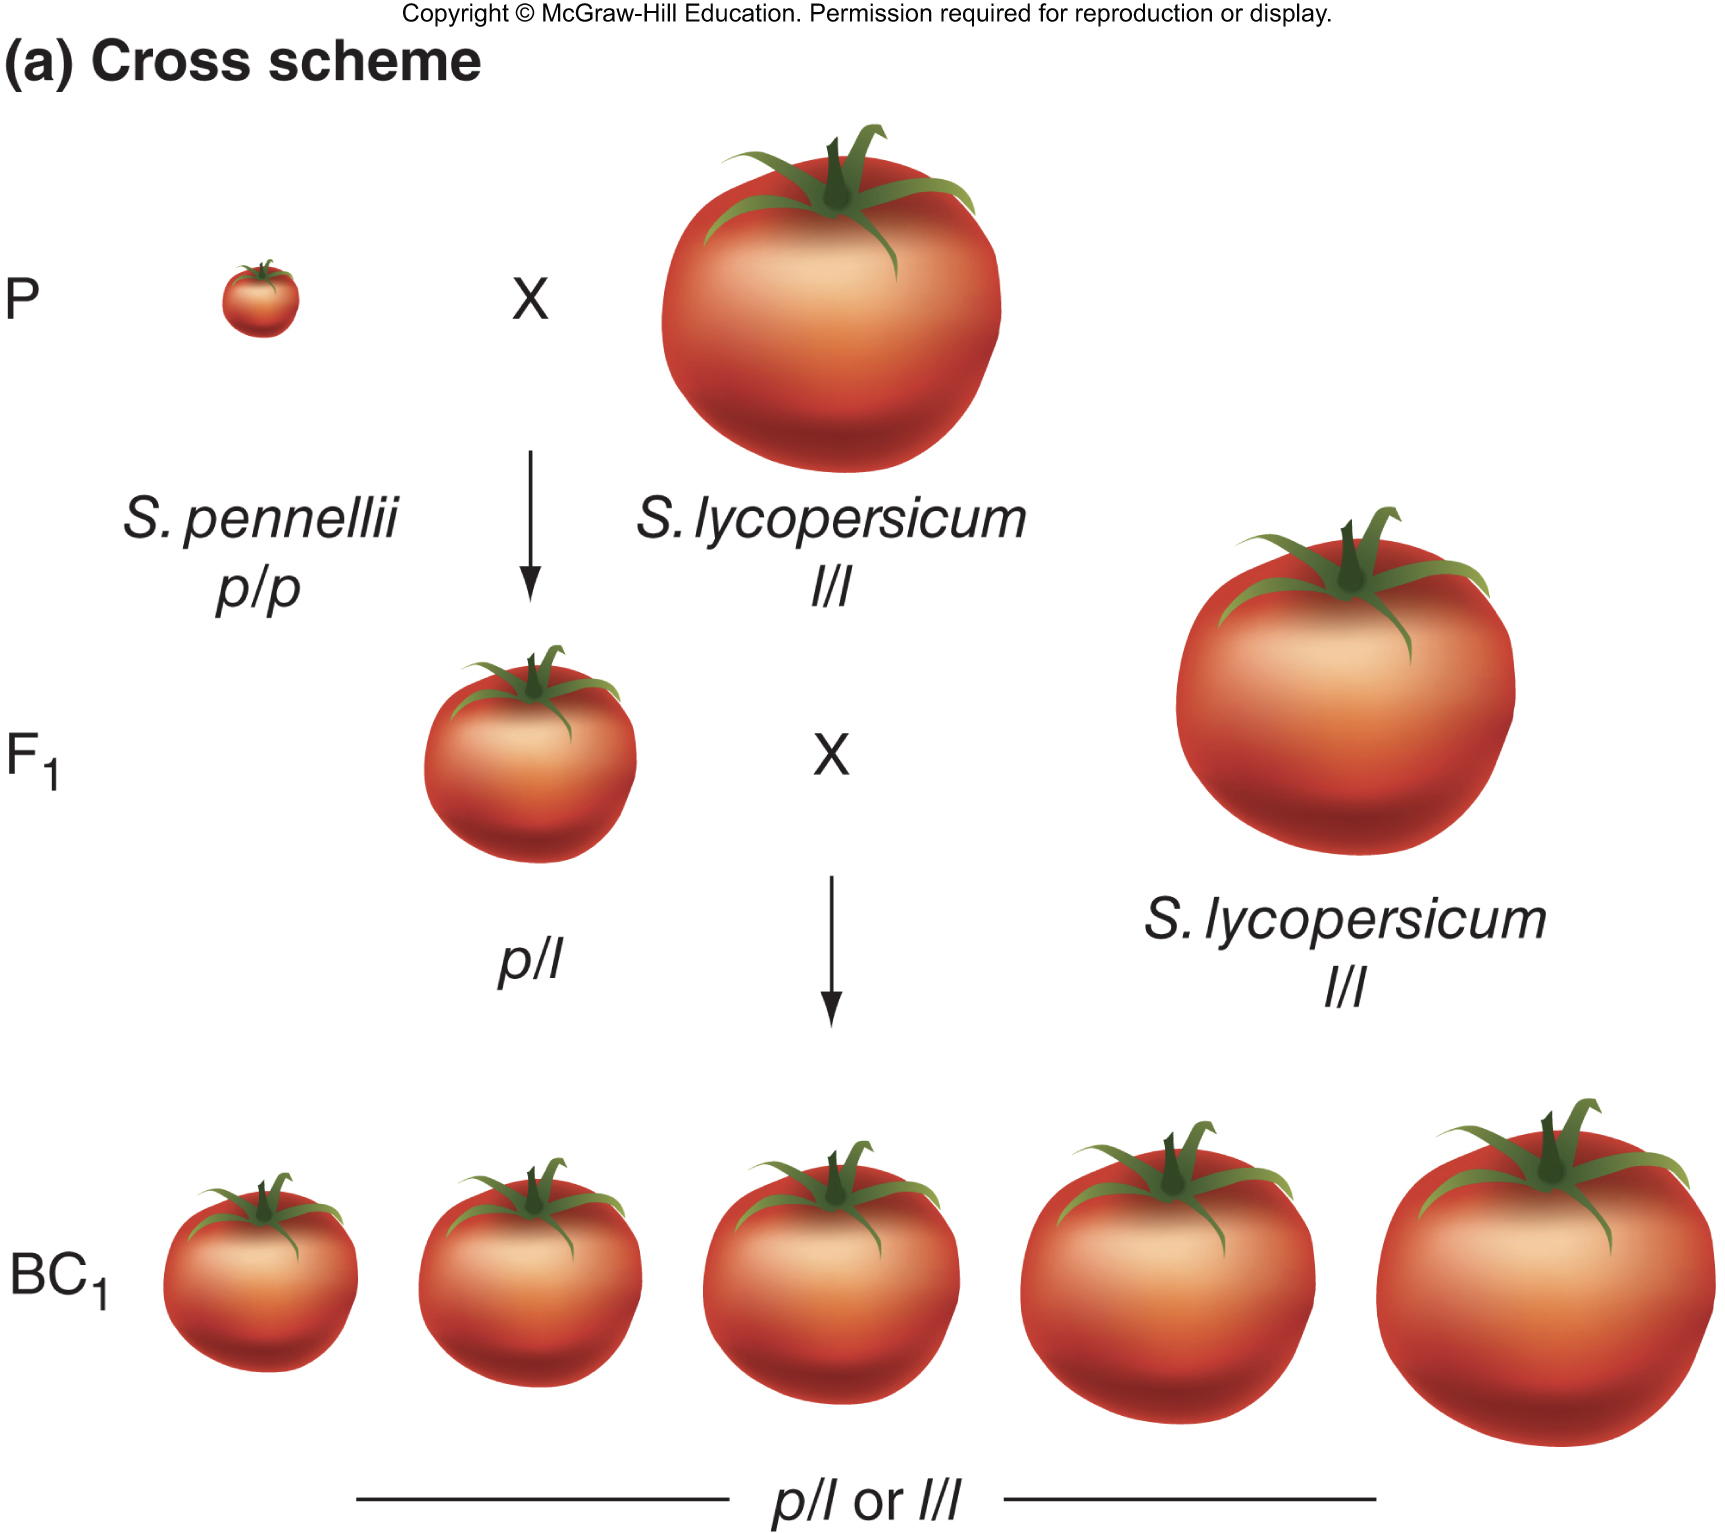
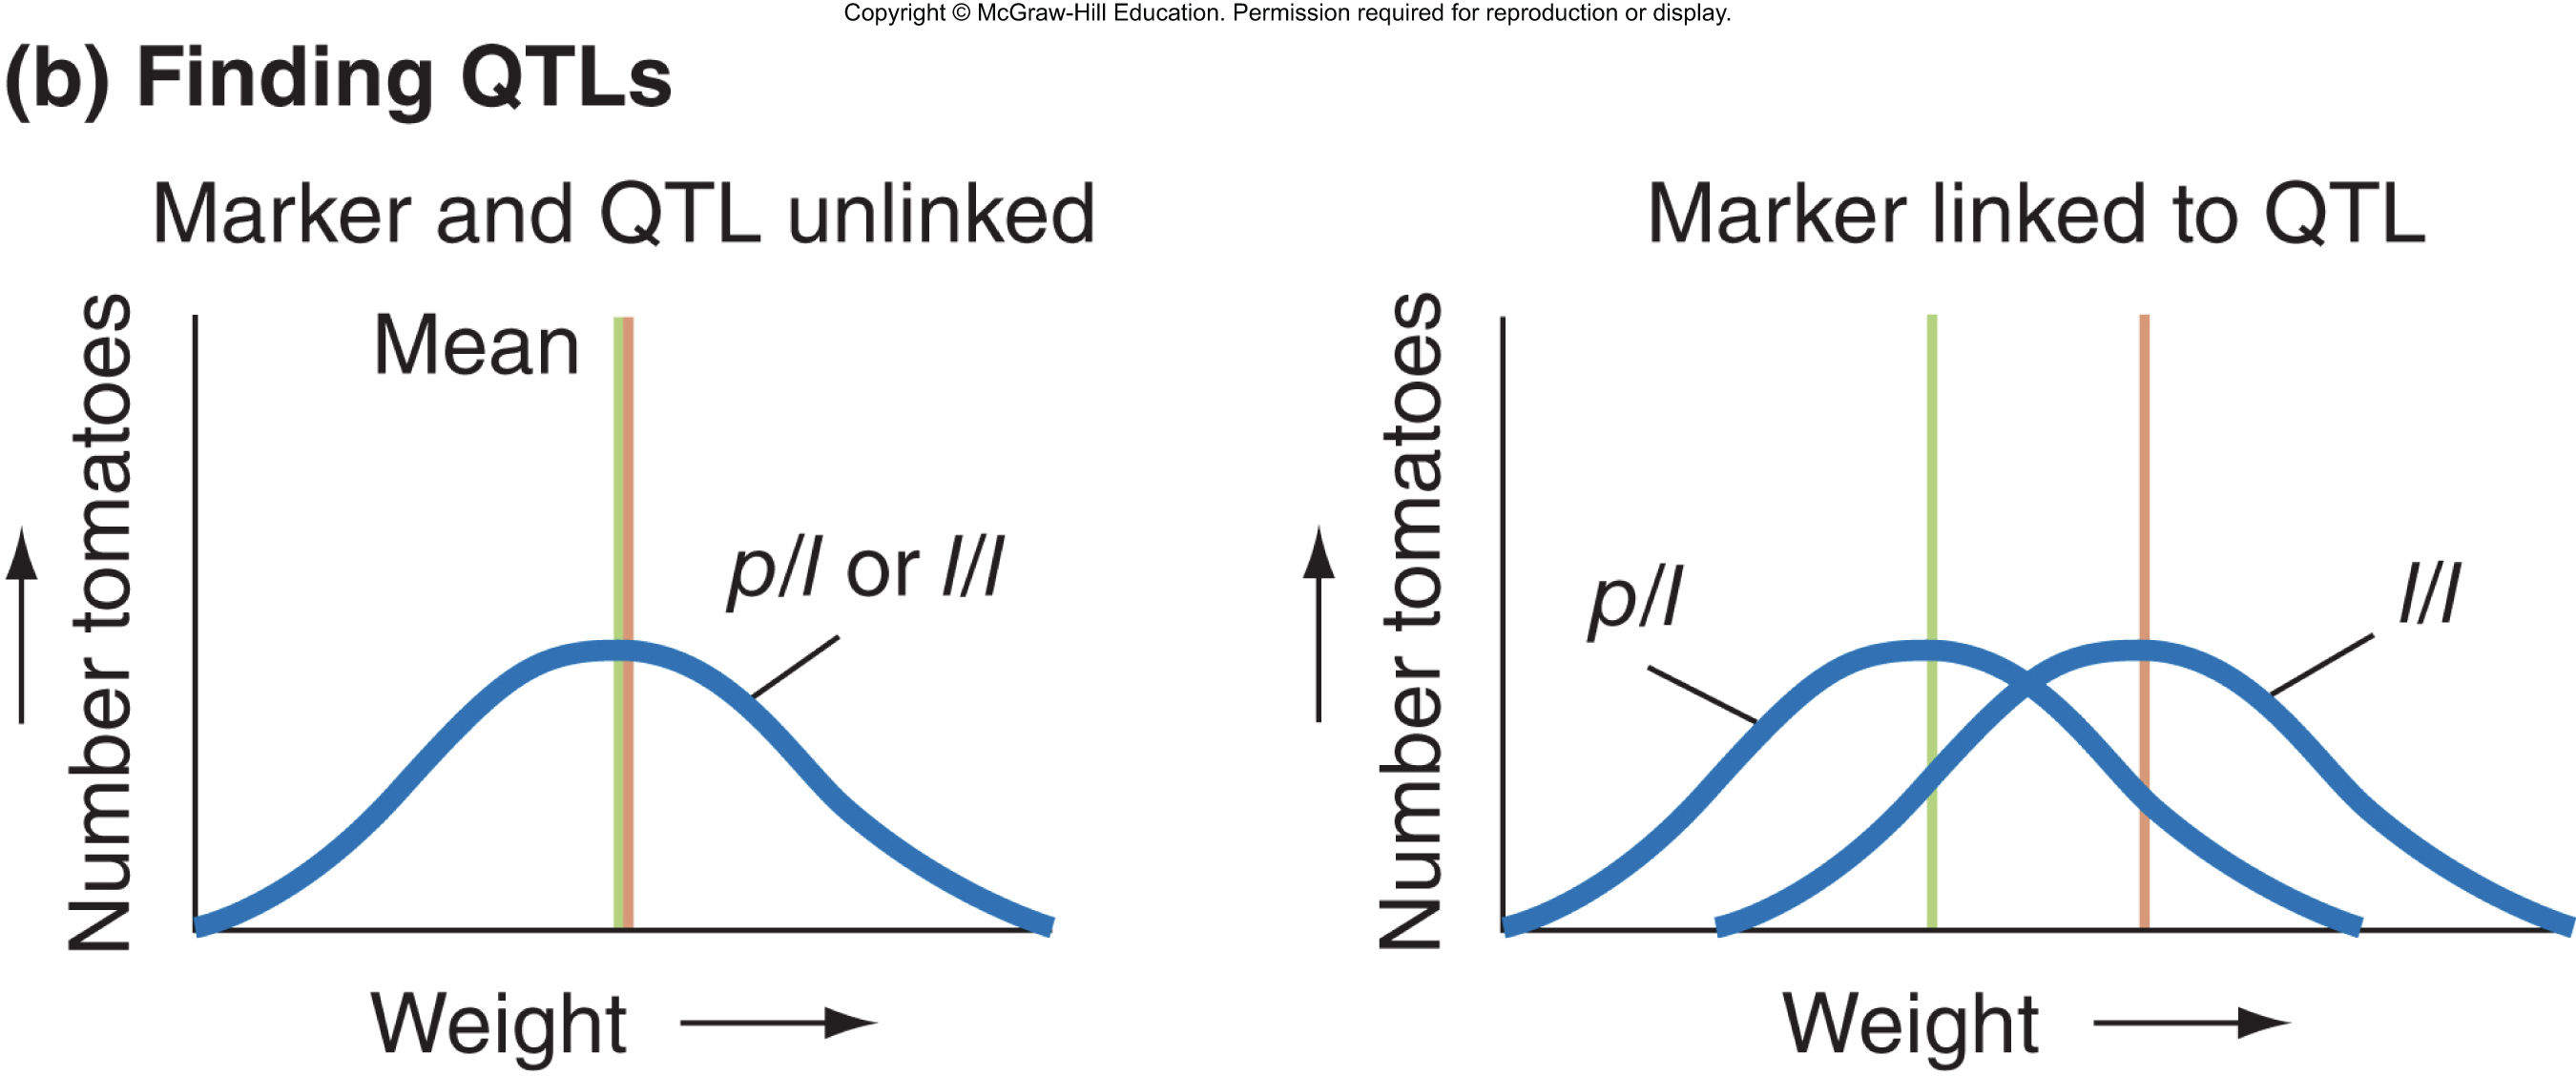
- Rough mapping- involved in tomato fruit size
- start with isogenic large (l) and small (p) tomato strains
- BC1 generation has many sizes due to variation at many genes
- at each gene, the backcross generation consists of p/l and l/l individuals
- QTLs identified based on correlation with phenotype
- genotyped and measured weight of hundreds of tomatoes
- differences in mean weight of l/l and p/l for a given marker indicates the marker is linked to a QTL
- Genome-Wide Association Studies have identified genes that control only a fraction of the total trait variation
- most variation has occurred recently due to population growth
- recent variation hasn’t spread widely around the globe
- acquisition of huge amounts of data is necessary