KINE 433 EXAM 2
SKELETAL MUSCLE
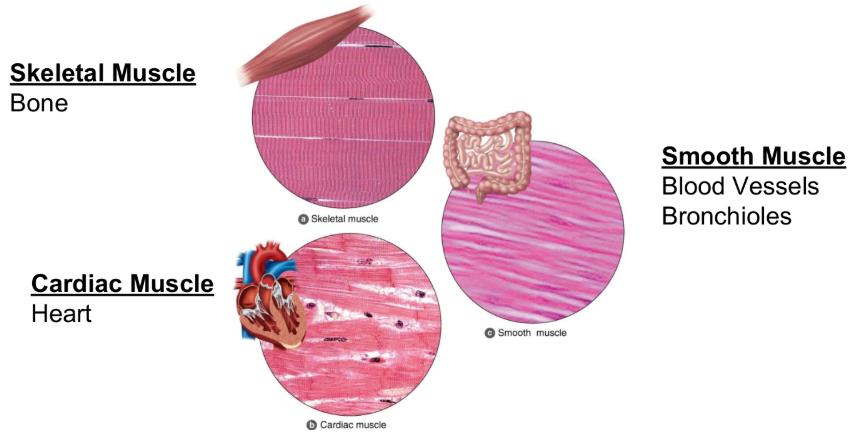
Types of Muscle
Skeletal Muscle
Bone
Cardiac Muscle
Heart
Smooth Muscle
Blood Vessels
Bronchioles
Key Points
Cardiac / Smooth Muscle
Involuntary & Regulated by ANS
Skeletal Muscle
Voluntary & Regulated by CNS
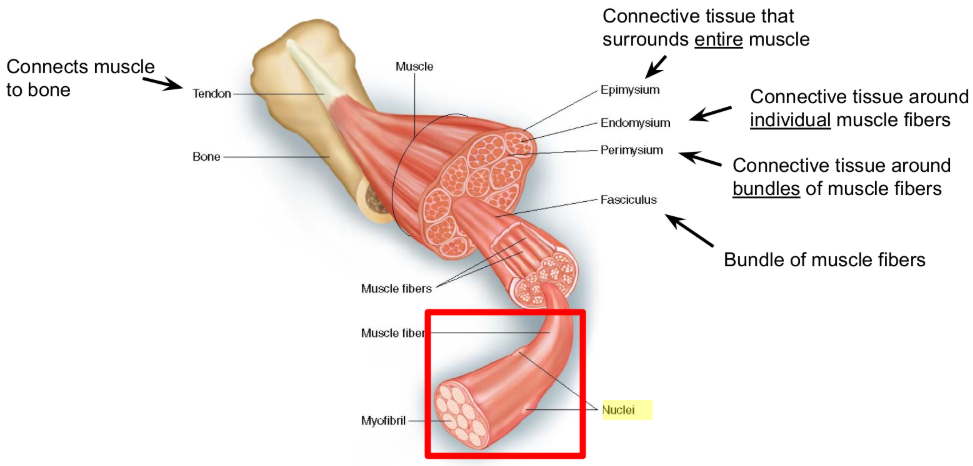
Basic Structure
Key Points
Muscle is composed of many muscle fibers
Muscle fibers vary in contractile & metabolic properties
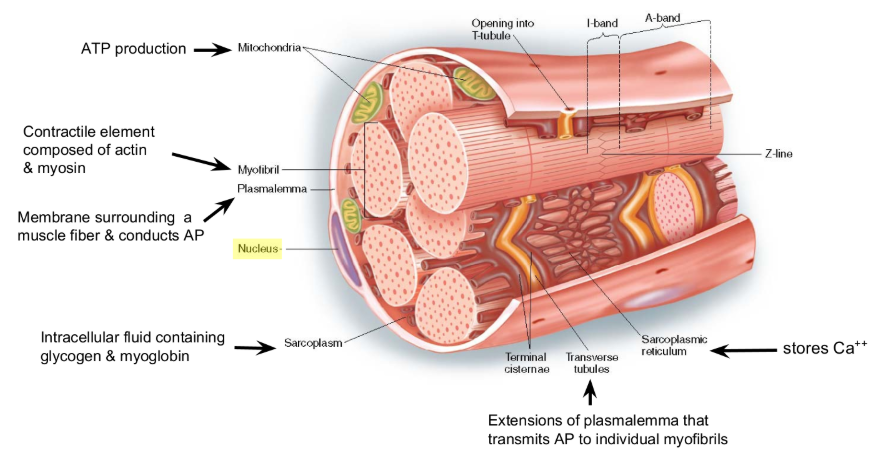
Muscle Fiber
Key Points
Muscle Fibers are multinucleated
QUESTION
what is a sarcomere?
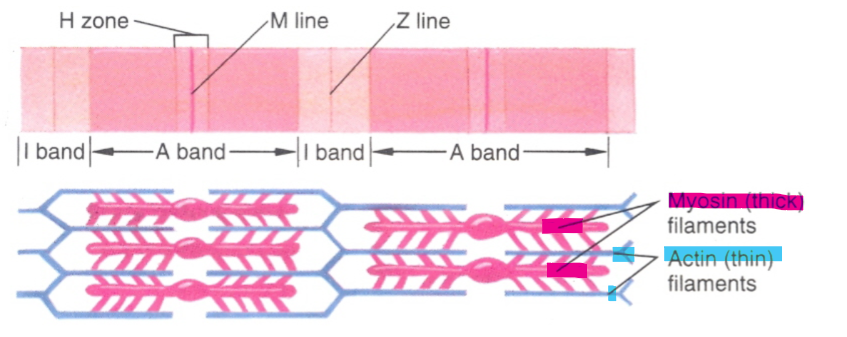
Sarcomere
SIDE NOTE
Wherever Actin is, the darker it is / the less light received
Key Points
Sarcomere
Contractile unit of a muscle fiber
Thick filaments
Composed of Myosin
Thin filaments
Composed of Actin, Tropomyosin, & Troponin
QUESTION
how is contraction initiated?
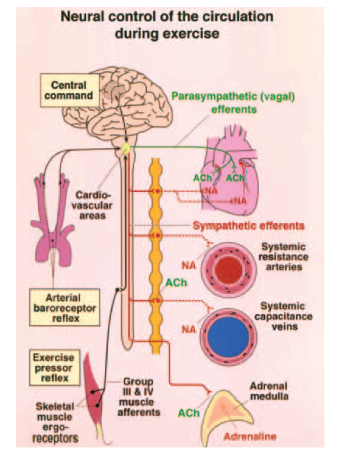
Central Command (CC)
Review
CC originated in the brain
CC activates muscle, CV system, and respiratory systems simultaneously
QUESTION
How does CC lead to muscle excitation
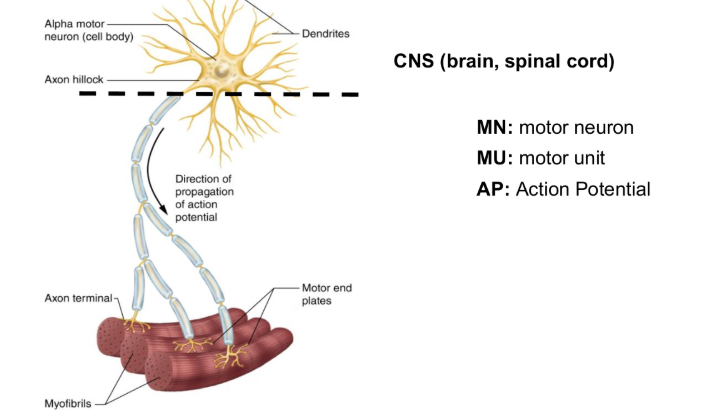
Motor Unit
Key Points
The alpha-Motor Neuron (a-MN) carries AP from CNS to muscle fibers
An a-MN plus all muscle fibers it innervates is a Motor Unit (MU)
QUESTION
how does this lead to contraction?
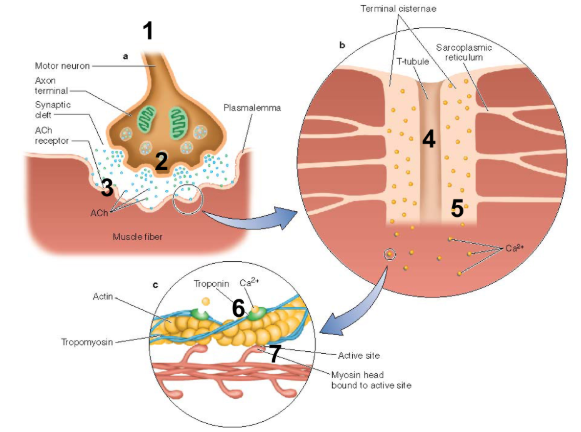
Excitation-Contraction Coupling
Key Points
STEP 1 = CC
AP Starts in the brain
STEP 2 = Neuromuscular Junction (NMJ)
a-MN releases acetylcholine (ACh)
STEP 3 = Nicotinic Receptors
ACh binds to nicotinic receptors
STEP 4 = T-Tubules
AP travels down the T-Tubules
STEP 5 = Sarcoplasmic Reticulum (SR)
SR releases Ca2+
STEP 6 = Troponin
Ca2+ binds troponin & pulls tropomyosin off active sites
STEP 7 = Myosin Head
myosin head binds actin & tilts
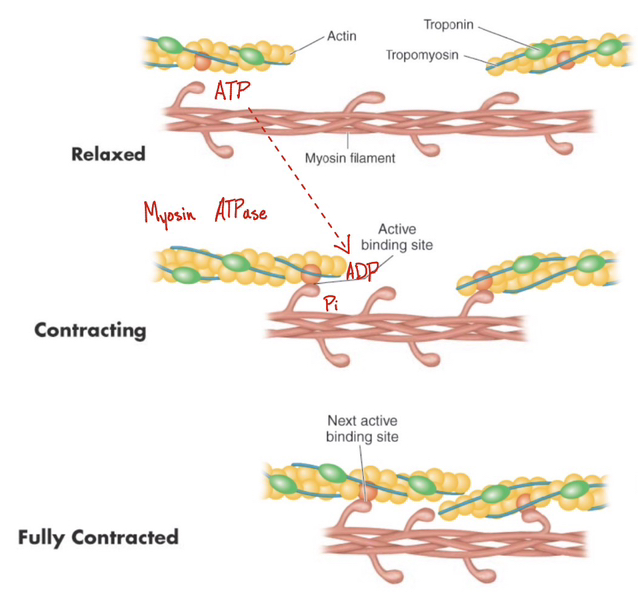
Muscle Contraction
Relaxed
Active site blocked
ATP bound to myosin
pink bulbs in photo are ATP
No force generated
Contracting
Active site exposed
ATP Hydrolyzed
Myosin head attaches
Fully Contracted
Pi released (power stroke)
ADP released
New ATP binds
Myosin head detaches
How does Contraction Stop?
CC is removed, ACh degraded, & Ca2+ is pumped out
Fiber Types ( Slow vs. Fast Twitch )
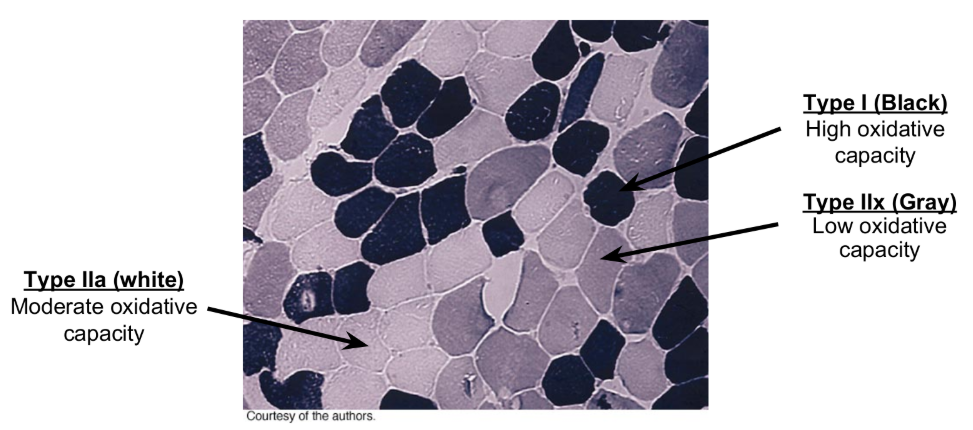
Key Points
Type I (Black)
High Oxidative Capacity
High mitochondrial & capillary density
Type IIa (White)
Moderate Oxidative Capacity
Intermediate mitochondrial & capillary density
Type IIx (Gray)
Low Oxidative Capacity
Low mitochondrial & capillary density
Classify Muscle Fibers
by using the type of Myosin ATPase
SIDE NOTE
Chemical staining in the photo due to Myosin ATPase present
World Class sprinters would have more type IIx than World class marathon runners having Type I
Gel Electrophoresis
gel like substance that uses an electrical current to pull out the proteins
to determine the amount in the muscle
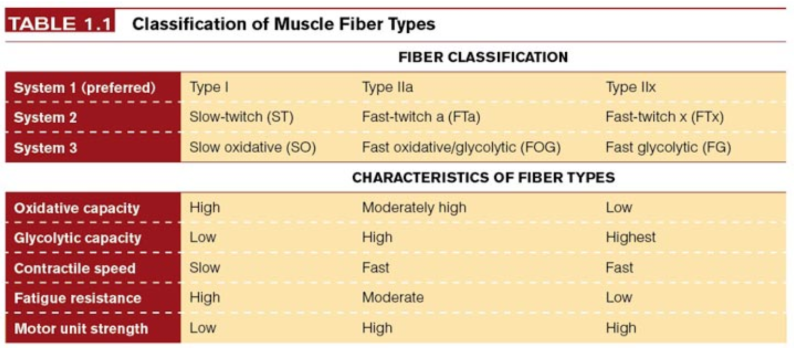
Fiber Types - Classification & Characteristics
Type I
~50% of fibers in most muscle
Type IIa
~45% of fibers in muscle
Type IIx
~5% of fibers in muscle
SIDE NOTE
System 3 is more descriptive version of the classification that led to the simple system 1
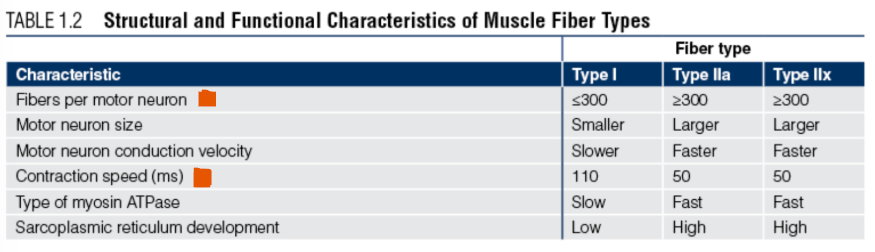
Fiber Types - Structural and Functional Characteristics
Key Points
Force is high in Type II MU
Velocity is high in Type II MU
If Force is High and Velocity is high
Power is high in Type II MU
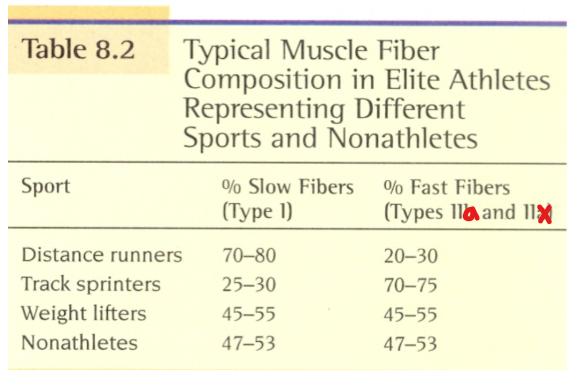
Fiber Types in Athletes
Key Points
Endurance Athletes
have high % Slow Twitch (ST) fibers
Power Athletes (Sprinters)
have high % Fast Twitch (FT) fibers
METABOLISM
Introduction
QUESTION
What are the primary fuels for exercise?
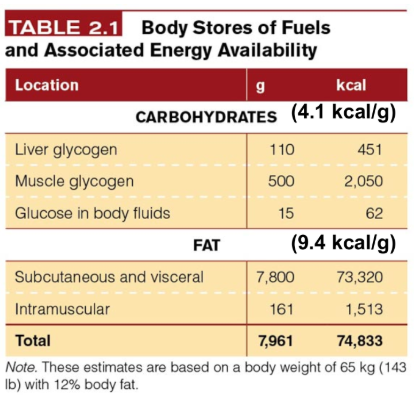
Fuels for Exercise (1/3)
Key Points
1 g of Carbohydrates = 4.1 kcal/g
1 g of Fat = 9.4 kcal/g
Fat is the preferred fuel of the muscle
We have lots of it
yields more kcal/g
Problem?
Rate of ATP production from Fat is slow
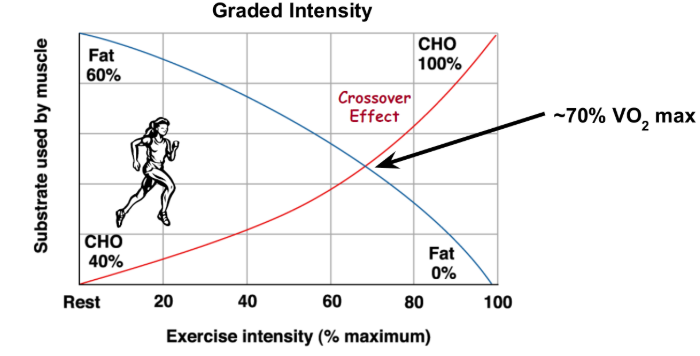
Fuels for Exercise (2/3)
Key Points
Crossover Effect
the shift from Fat to CHO metab.
Occurs because
Fat metabolism is slow
Recruitment of Type II fibers
increase in lactate production
LA inhibits fat metabolism
lipolysis
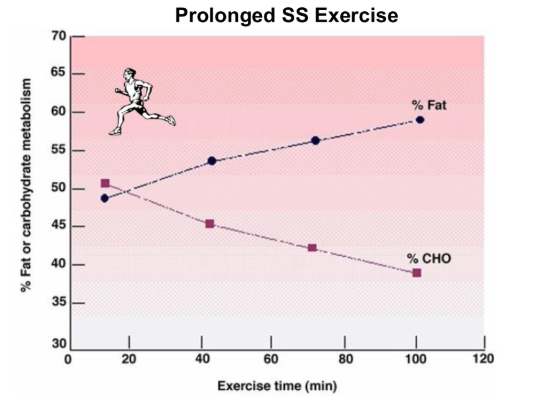
Fuels for Exercise (3/3)
Key Points
Note the shift to fat metabolism in prolonged
LA doesn’t increase during low intensity exercise
no LA to inhibit fat metabolism
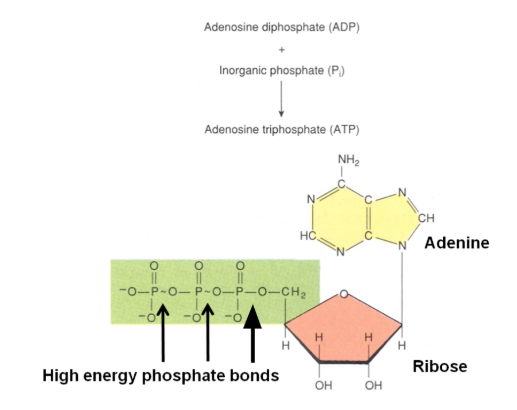
ATP (1/2)
Note
ATP is the most important energy carrying molecule
Energy is stored in phosphate bonds
Yellow
Nucleotide - Adenine
Red
Sugar - Ribose
QUESTION
How is energy released from ATP?
myosin cross bridge
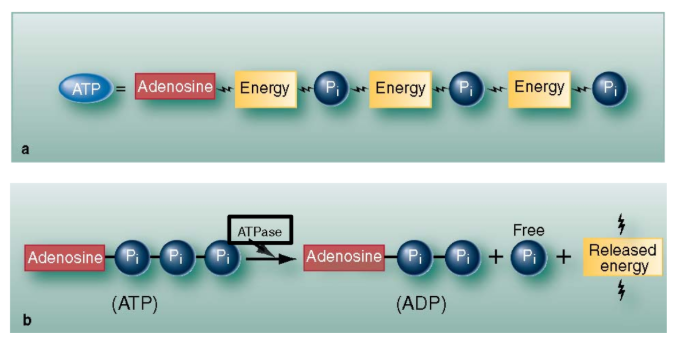
ATP (2/2)
Key Points
Adenosine
combination of Adenine and Ribose
one of the key bridges between metabolic and cardiac
ATPases split phosphate off ATP molecule
The reaction releases energy
Myosin ATPase is essential to cross-bridge cycling
QUESTION
Where does ATP come from?
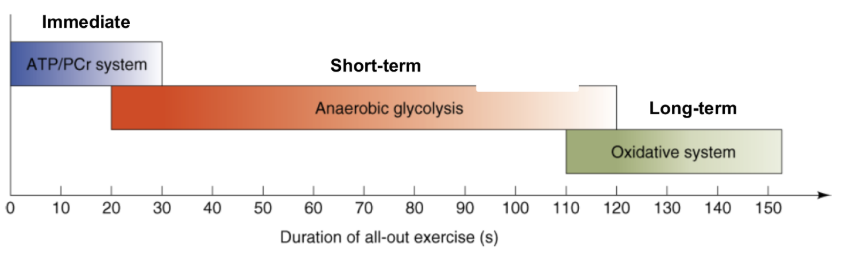
Energy Systems
Note
ATP-PCr System
immediate energy system
dominant 1-15 seconds
Glycolytic System
Short-term energy system
dominant 15-120 seconds
Oxidative System
long-term energy system
dominant beyond 2 minutes
QUESTION
How do these systems work?
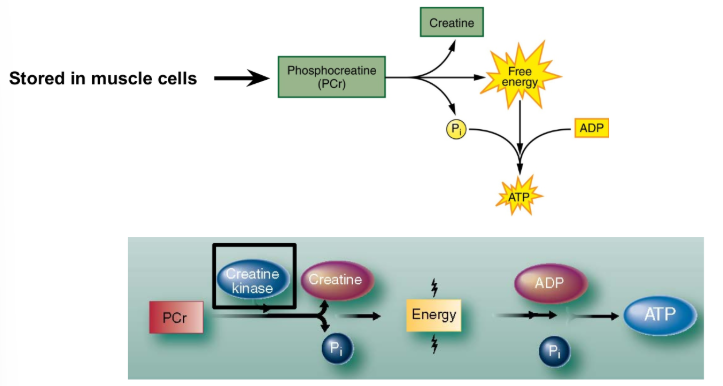
ATP-PCr System (1/2)
Key Points
Creatine Kinase
catalyzes the split of PCr to Creatine and Phosphate
Reaction occurs in the cytoplasm (non-oxidative)
catalyzed by Creatine Kinase (CK)
Energy from Phosphocreatine (PCr) is not used directly
Energy is used to make ATP
QUESTION
How effective is the ATP-PCr System?
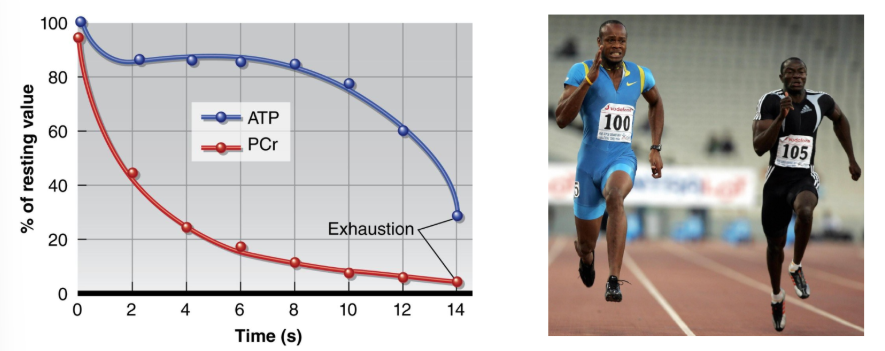
ATP-PCr System (2/2)
Key Points'
PCr can only support exercise for a few seconds
Important to sprinters and power athletes
QUESTION
Are creatine supplements beneficial?
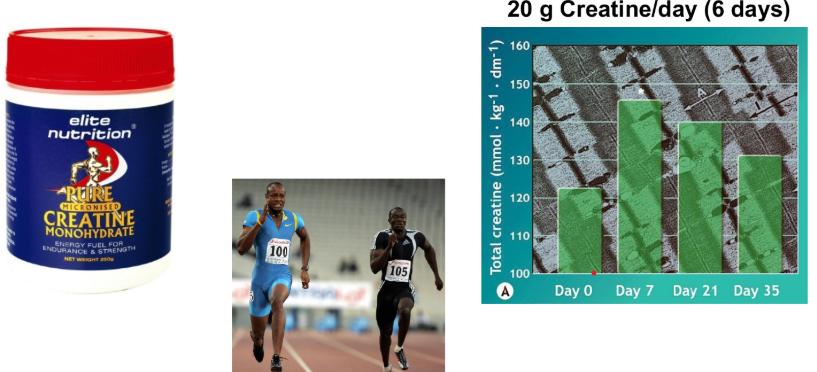
Creatine Supplementation (1/2)
Key Points
Creatine Supplements do increase PCr store
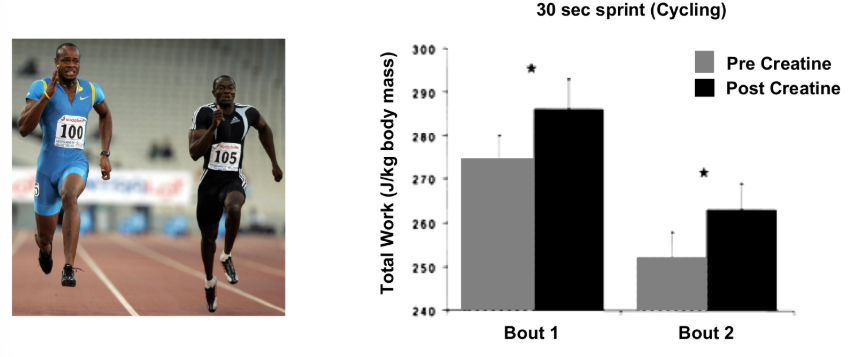
Creatine Supplementation (2/2)
Key Points
Total work is increased by creatine supplementation
Creatine supplements are allowed
Glycolytic System
Key Points
Glycolysis is the breakdown of glucose to produce Pyruvate (PA)
Occurs in cytoplasm
QUESTION
how does it work?
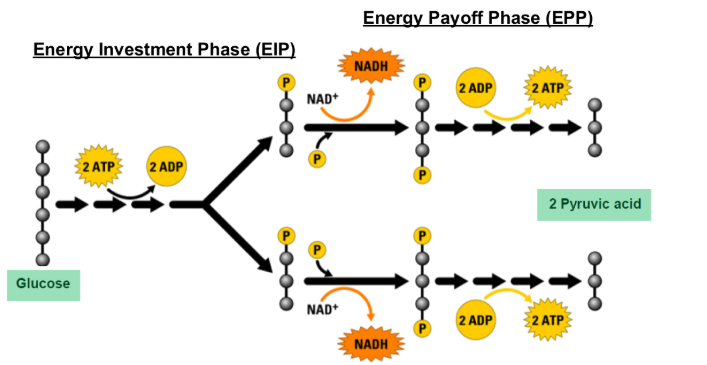
Glycolytic System
Key Points
EIP
2 ATP used to phosphorylate glucose
EPP
4 ATP & 2 NADH produced
GAINED 2 ATP
QUESTION
what are the key steps
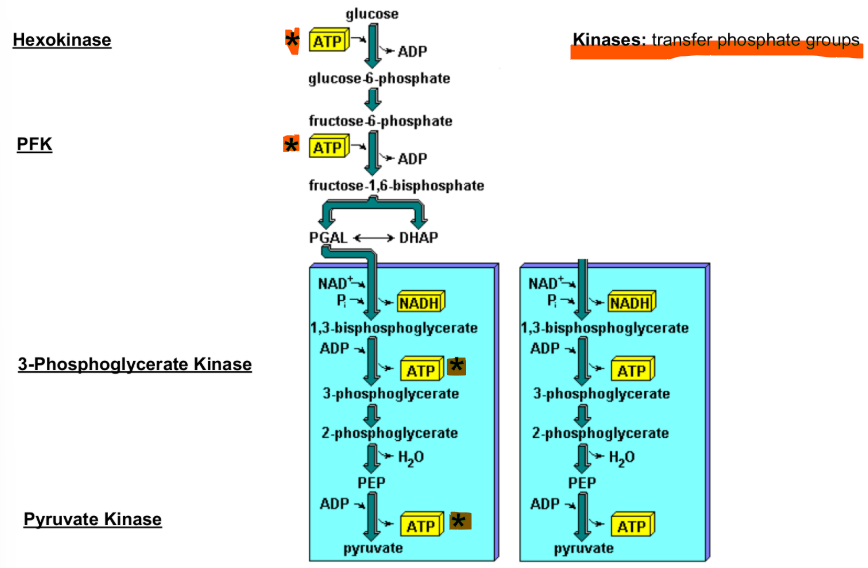
Glycolytic System
Kinases
Transfer phosphate groups
Hexokinase
Phosphorylates glucose
Traps glucose in cell
1 ATP Consumed
PFK
Phosphorylates Fructose
Rate limiting enzyme
1 ATP consumed
SIDE NOTE
determines the speed
3-Phosphoglycerate Kinase
Phosphorylates ADP
2 ATP produced
Pyruvate Kinase
Phosphorylates ADP
2 ATP produced
QUESTION
What is the fate of pyruvate?
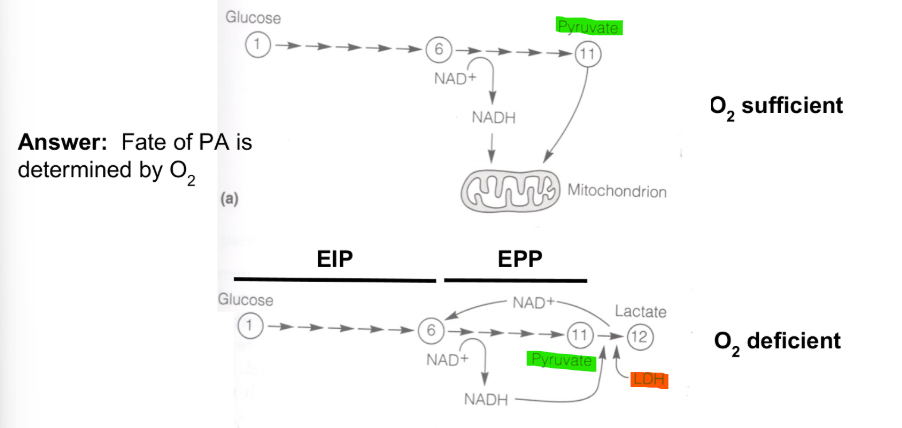
Fate of Pyruvate
determined by O2
Key Points
O2 Deficient
PA is converted to LA by Lactate Dehydrogenase
O2 sufficient
PA & NADH enter the mitochondria
QUESTION
what happens in the mitochondria
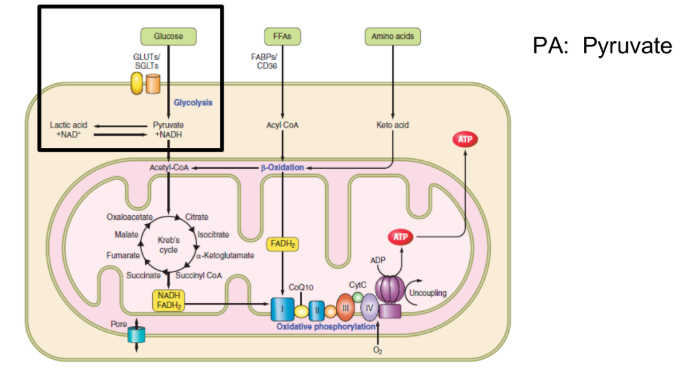
Oxidative System
Key Points
Krebs cycle & electron transport occur in the mitochondria
QUESTION
how does it work
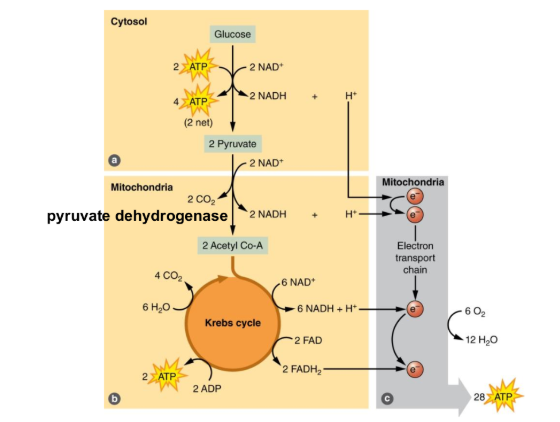
Oxidative System
Key Points
PA enters the mitochondria
PA converted to Acetyl Co-A by Pyruvate DH
Acetyl Co-A provides link to Krebs Cycle
QUESTION
how much ATP is gained going through Krebs Cycle
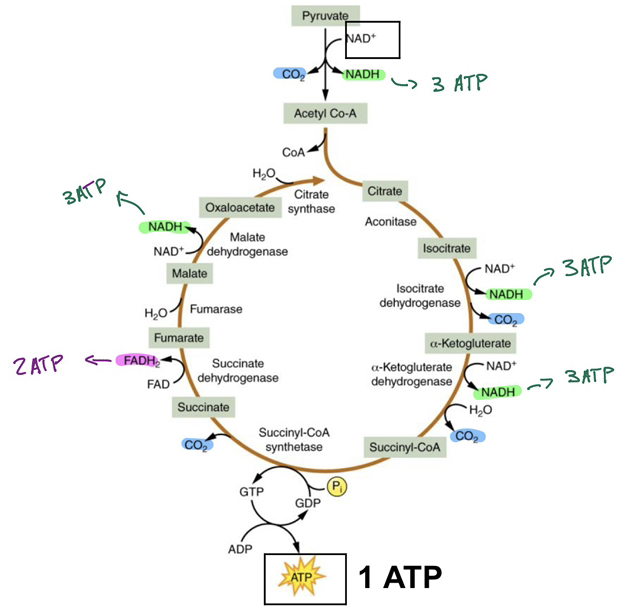
Oxidative System
Key Points
Krebs cycle makes equivalent of 15 ATP per PA
Two PA per glucose
15 × 2 = 30 ATP
CO2 made as “waste product”
QUESTION
how do NADH & FADH2 generate ATP
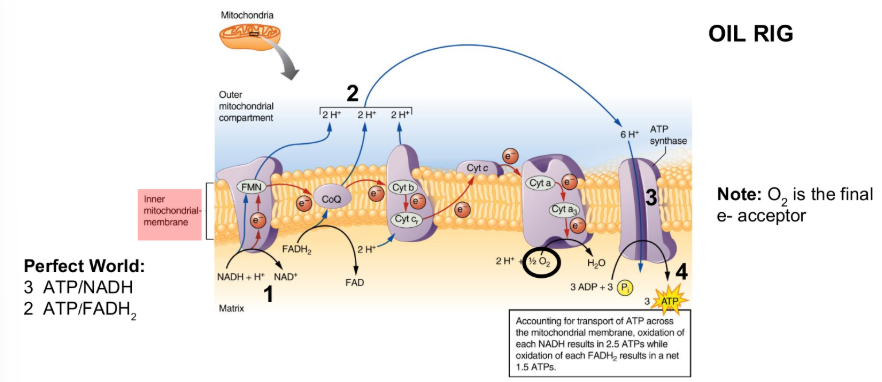
Electron Transport Chain
Key Points
STEP 1: NADH & FADH2 lose e- (oxidation)
STEP 2: H+ pumped across membrane
STEP 3: H+ flow through ATP synthase drives ATP production (phosphorylation)
STEP 4: Process is called oxidative phosphorylation
OIL RIG
oxidation is loss of electrons
reduction is gain of electrons
O2 interacts with e- to make H2O
IN A PERFECT WORLD
3 ATP per NADH
2 ATP per FADH2
it skips the first step/area of oxidation
HOWEVER
oxidation each NADH results in 2.5 ATPS
oxidation each FADH2 results in 1.5 ATPS
NOTE + SIDE NOTE
O2 is the final e- acceptor
a high VO2
can increase the amount of ATP produced
due to more O2 to pull e-
QUESTION
what are the sources of electrons?
NADH and FADH2
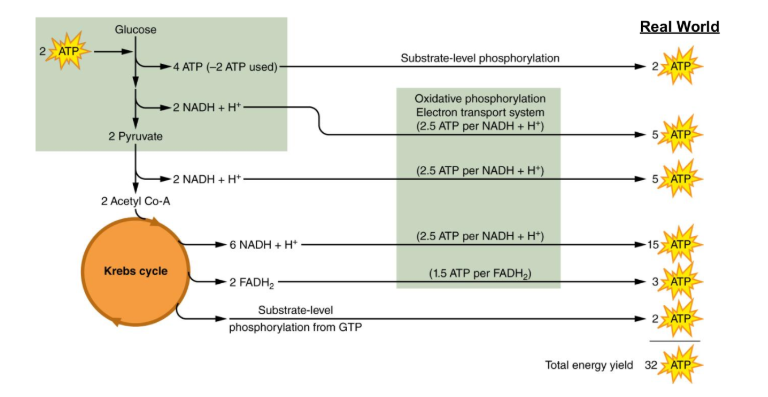
Net Energy Production
NOTE
in “perfect world” oxidation of 1 glucose yields 38 ATP
in “real world,” 1 glucose yields 32 ATP
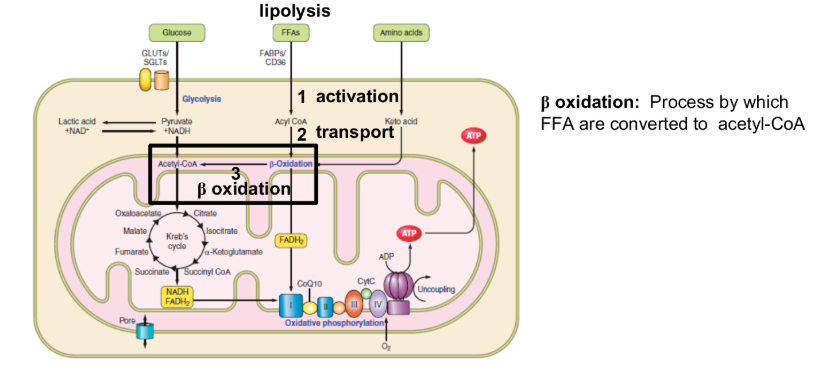
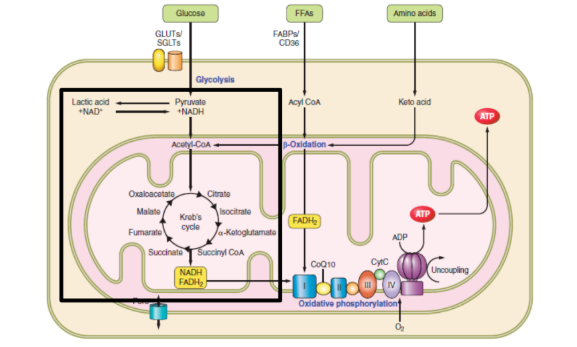
Fat Metabolism
oxidation occurs in mitochondria
oxidation
Process by which FFA are converted to acetyl-CoA
2C removed at a time to make Acetyl CoA
QUESTION
Why do you get more ATP from fat metabolism
can get more Acetyl CoA
Fat Metabolism
Note
Fat generates more ATP than glucose
Fat is preferred substrate
QUESTION
is there a way to enhance fat metabolism?
Adaptations to Training
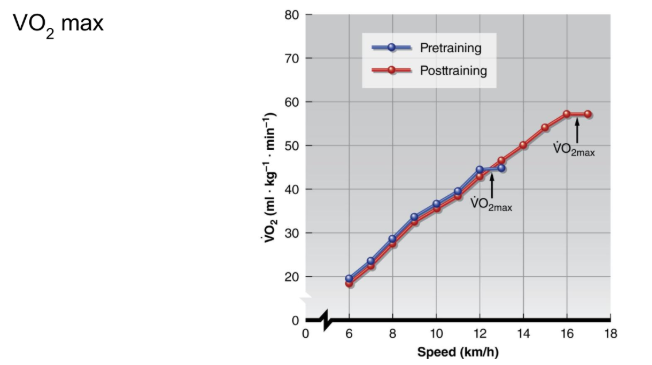
VO2 max REVIEW
VO2 max increases w/ training
increase in O2 delivery (CO max)
increase in O2 utilization (a-v O2 diff max)
QUESTION
what accounts for enhanced O2 utilization
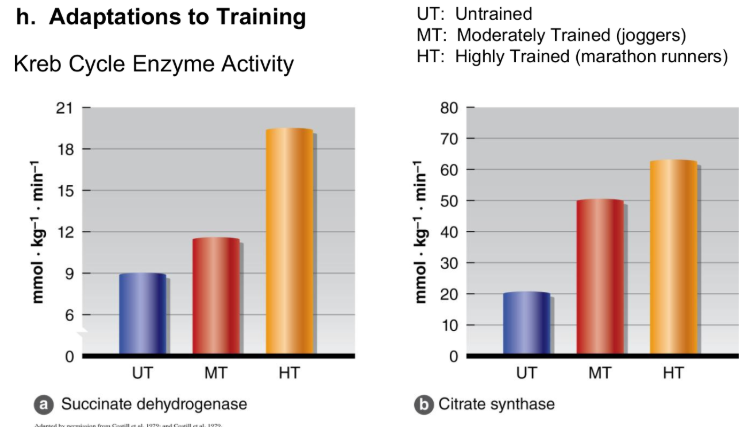
Adaptations to Training
Key Points
Training increases Succinate Dehydrogenase (SDH) & Citrate Synthase (CS) activity
Increase rate of ATP production
Increase in ability to use fat
spares glycogen
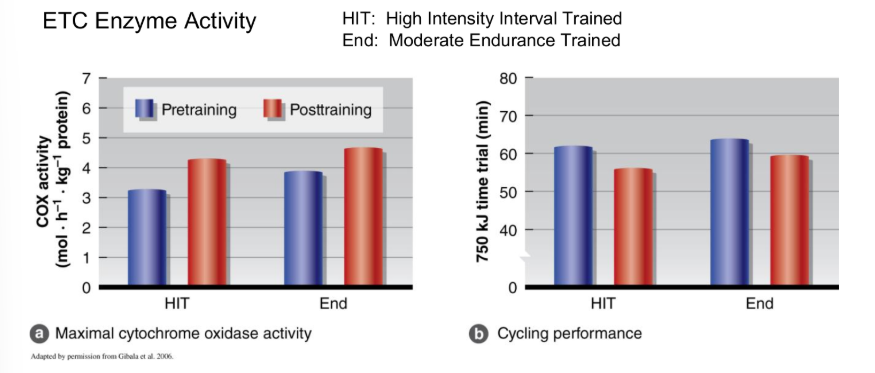
Key Points
Increase Cytochrome Oxidase (COX) activity → increase rate of ATP production
Note improvement of time trial
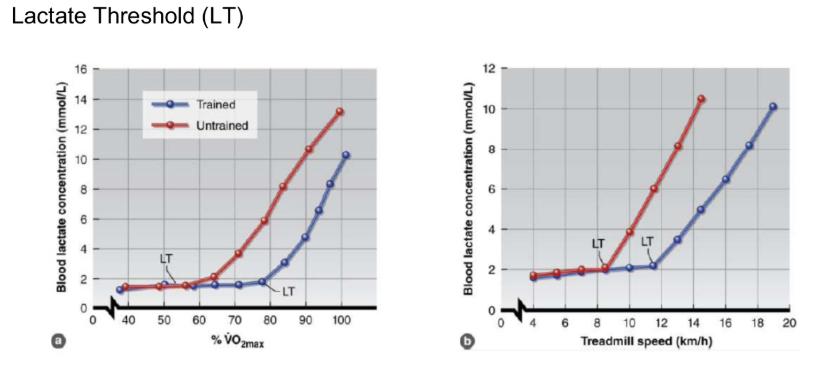
Adaptations to Training
Key Points
LT occurs at higher intensity in trained (TR) state
Delays shift from fat to CHO metabolism
spares glycogen
Muscle pH is more stable
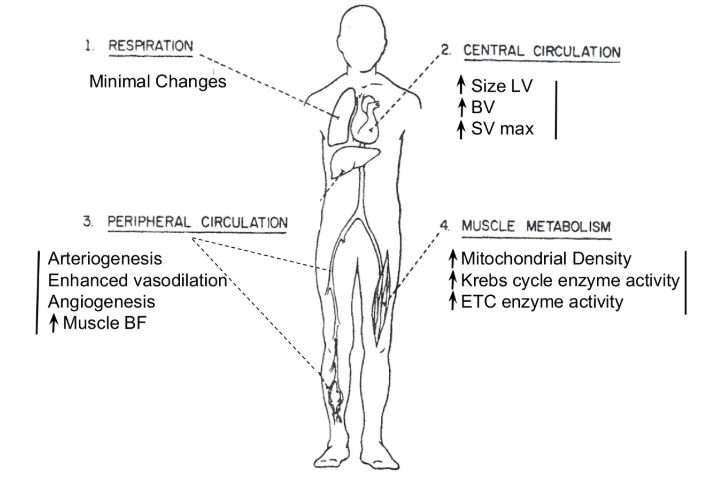
Adaptations to Training
Respiration
Minimal changes
decrease/drop in Work of Breathing (Wb)
Central Circulation
increase in CO max
increase Size LV
increase in BV
increase in SV max
Peripheral Circulation
Increase O2 delivery
Arteriogenesis
Enhanced vasodilation
Angiogenesis
Increase in muscle BF
Muscle Metabolism
Increase ability to use O2 to make ATP
increase mitochondrial density
increase krebs cycle enzyme activity
increase ETC enzyme activity
Delay onset Fatigue
increase in LT
Enhances/Increase FFA use
Reduce/Decrease Glycogen use
pH becomes more stable
Parasympathetic Nerves (PN)
Key Points
1. Parasympathetic nerve innervate the heart and bronchioles
2. Release ACh
binds to muscarinic receptors
3. Decreases HR & Constricts airways
4. Parasympathetic nerves turned off during exercise
QUESTIONS
why do you want resting HR low
keeps the workload of the heart low
why do we want airways fairly constricted at rest
to help filter out any impurities
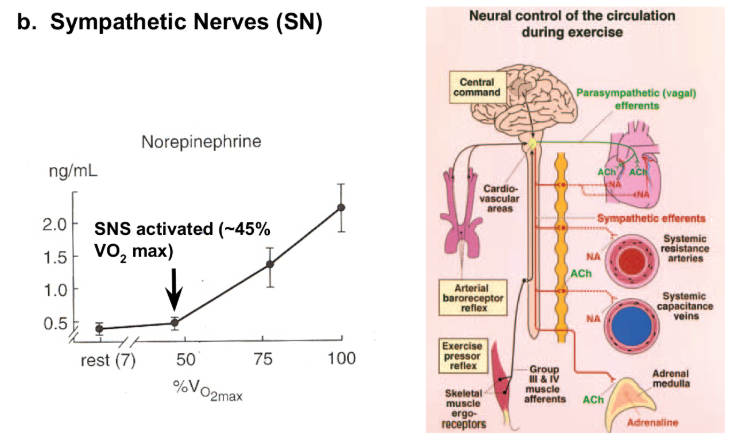
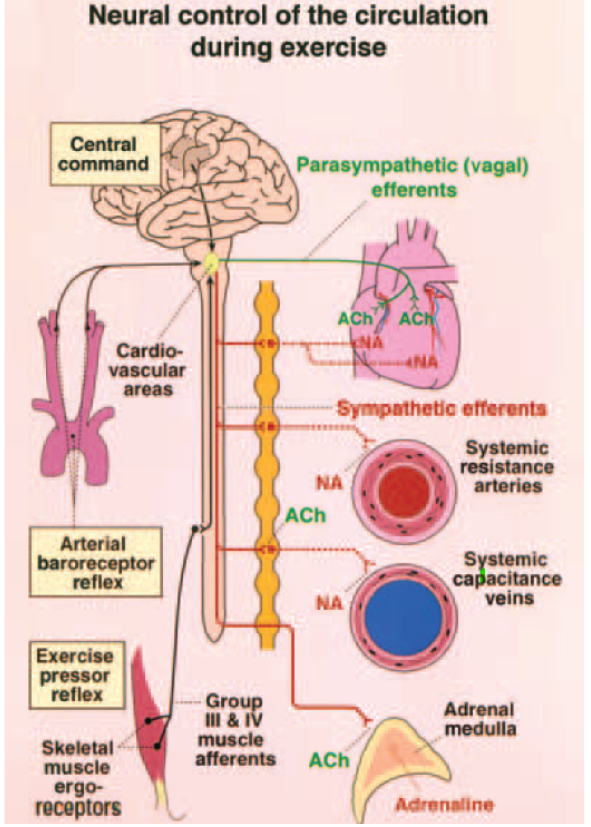
Sympathetic Nerves (SN)
Key Points
1. SN Innervate
Heart
Arterioles
Veins
Bronchioles
2. Release NE
binds to adrenergic receptors
3. Increase Cardiac Output → redistributes BF → increase in VR → dilates bronchioles
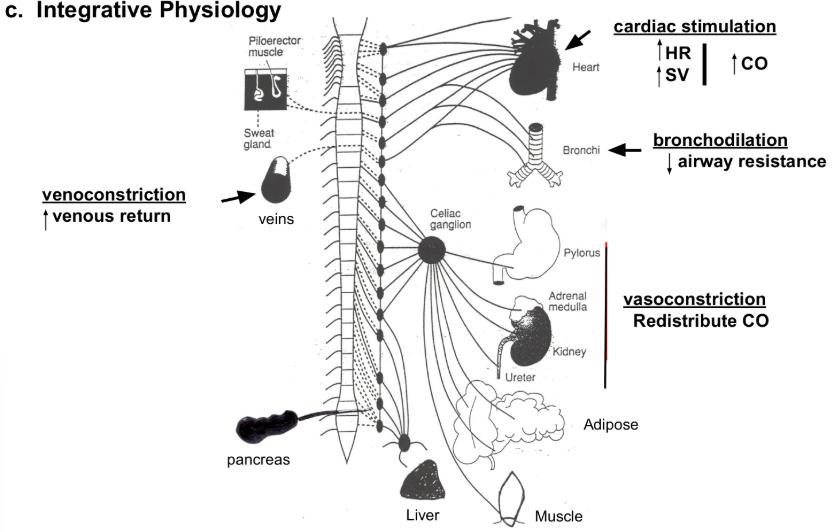
Integrative Physiology (SNS)
Heart
Cardiac Stimulation
Increase in CO
increase in HR
increase in SV
Veins
Venoconstriction
Increase in venous return
Bronchi
Bronchodilation
Decrease in airway resistance
Pylorus/Adrenal Medulla/Kidney
Vasoconstriction
Redistribute CO
Adipose
Lipolysis
Mobilize FFA
enters oxidation
Skeletal Muscle / Liver
Glycogenolysis
mobilizing glucose
enters glycolysis
Pancreas
Inhibits/Decreases Insulin
Promotes/Increases Glucagon
Taking drugs for alpha and beta and experience fatigue is due to everything listen getting (not fully) blocked
HORMONAL CONTROL
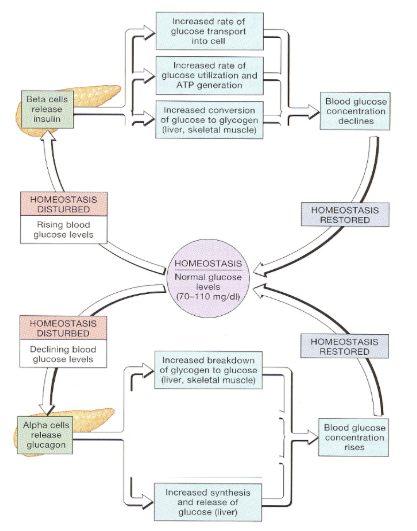
Glucose Regulation
Key Points
Goal is the keep glucose at 70-110 mg/dl
QUESTION
how does insulin work?
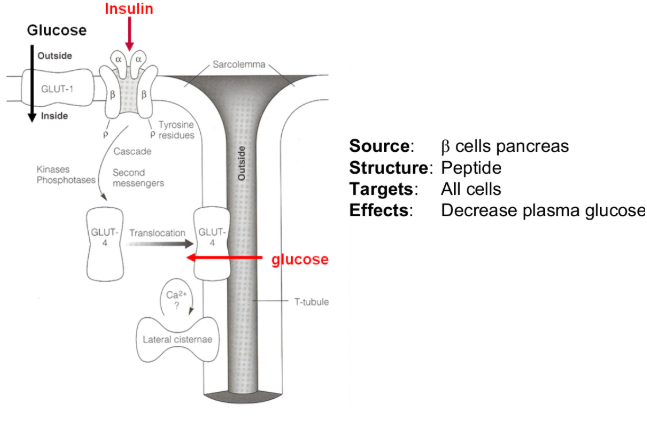
Glucose Regulation
Insulin
Key Points
insulin stimulates glucose uptake and storage
QUESTION
how does insulin respond to exercise
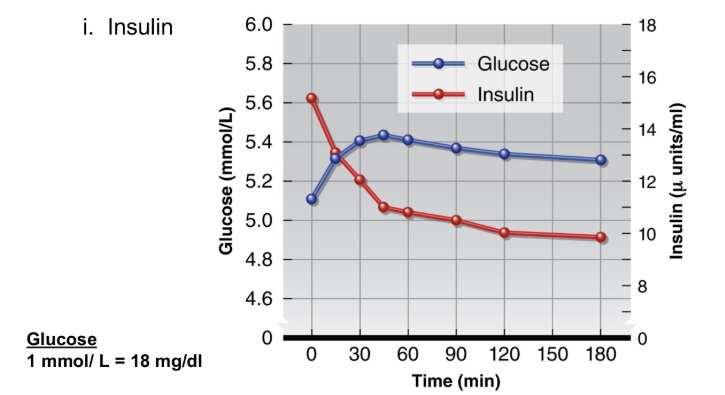
Glucose Regulation
Glucose 1 mmol/L= 18 mg/dl
Insulin
declines during exercise
prevents blood glucose from falling
Glucose Regulation
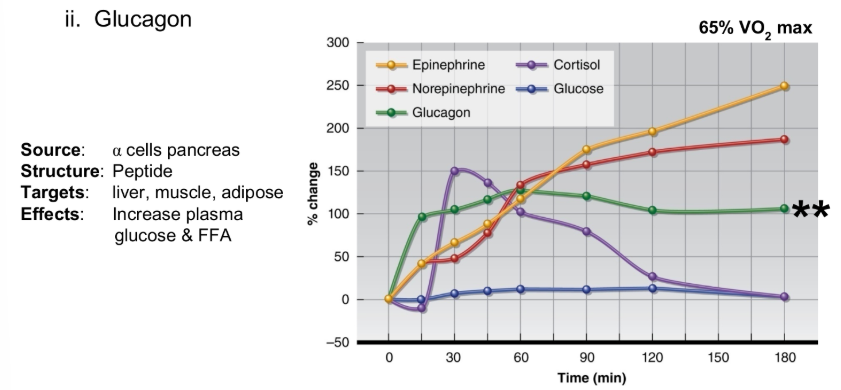
Glucagon
Key Points
glucagon rises during exercise
mobilize glucose in live and muscle
glycogenolysis
QUESTION
does training alter response
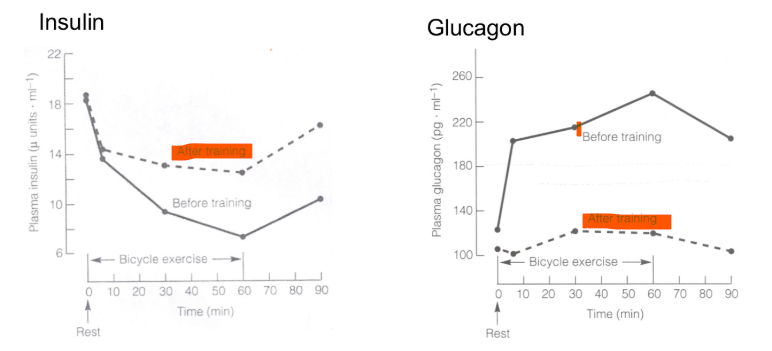
Training Effects
Key Points
we use more FFA post-training
plasma (glucose) is more stable
insulin doesn’t decline at much
glucagon doesn’t increase as much
Fluid Balance
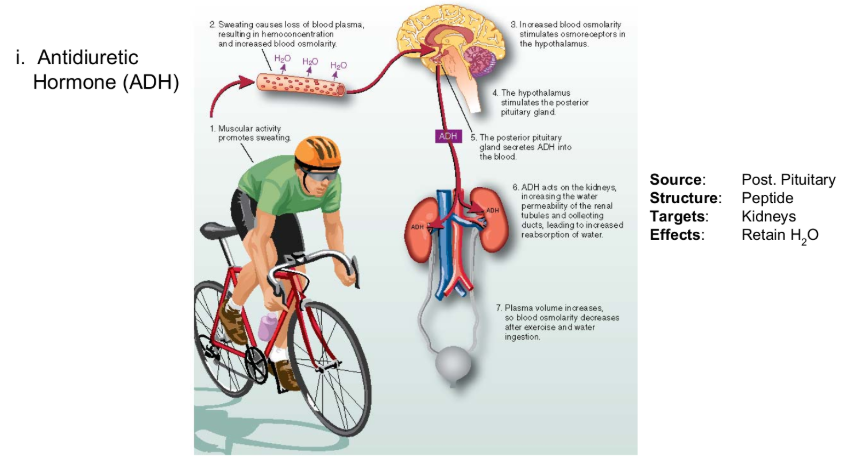
Antidiuretic Hormone (ADH)
Key Points
decrease PV stimulates ADH release
ADH acts on kidneys to retain H2O
protects against dehydration
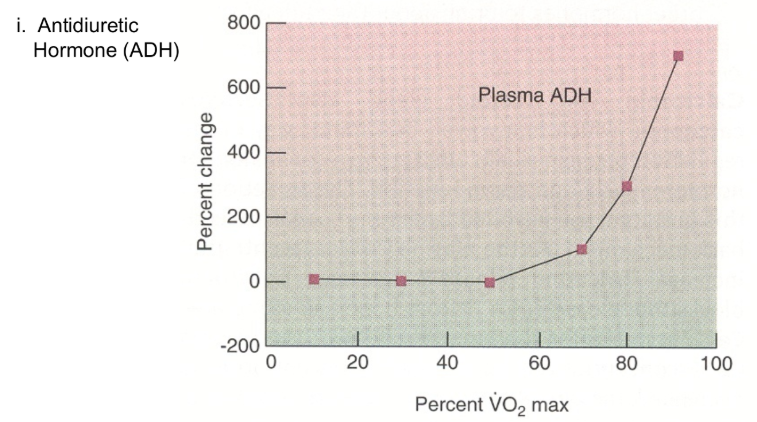
Fluid Balance
Antidiuretic Hormone (ADH)
Key Points
ADH release starts at ~50% VO2 max
Fluid Balance
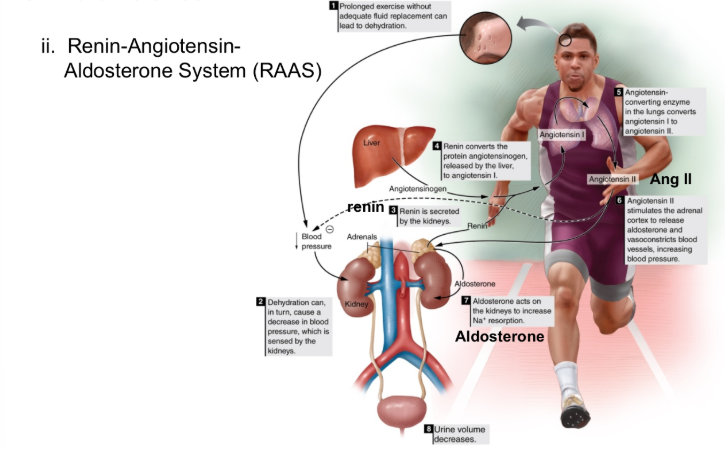
Renin-Angiotensin-Aldosterone System (RAAS)
Key Points
Decrease in plasma volume (PV) & BP → activates RAAS
Ang II constricts arterioles
protects BP
Aldosterone acts on kidneys to reabsorb Na+
retains H2O
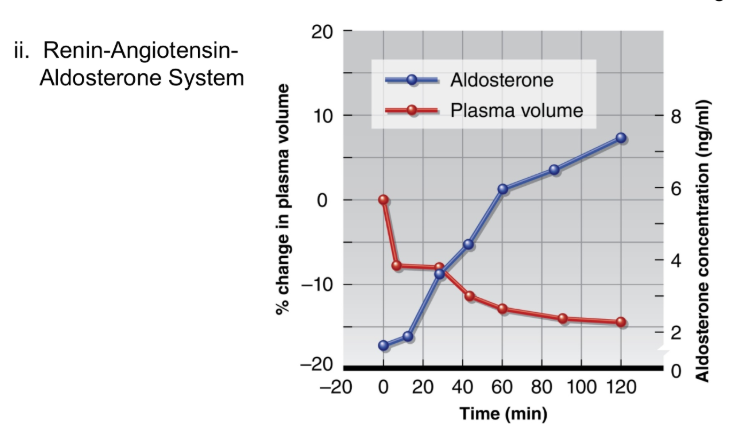
Fluid Balance
RAAS
Key Points
Aldosterone reduces, but does not prevent, decline in PV
ENERGY EXPENDITURE
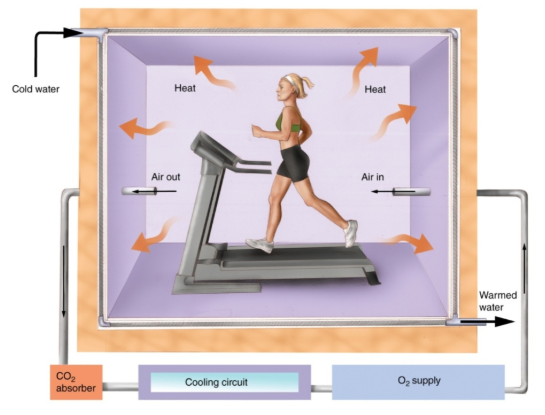
Direct Calorimetry (DC)
Note
60% of energy from metabolism lose as heat
DC estimates energy expended by measuring heat produced
SIDE NOTE
the treadmill also generates heat, therefore you’d have to know and remove the heat produced by the treadmill
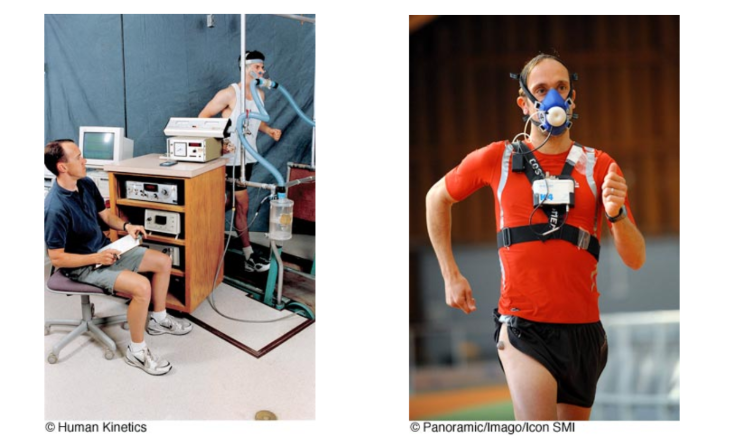
Indirect Calorimetry
Key Points
IDC estimates energy expended by measuring O2 consumed and CO2 produced
Indirect Calorimetry cont
Equations
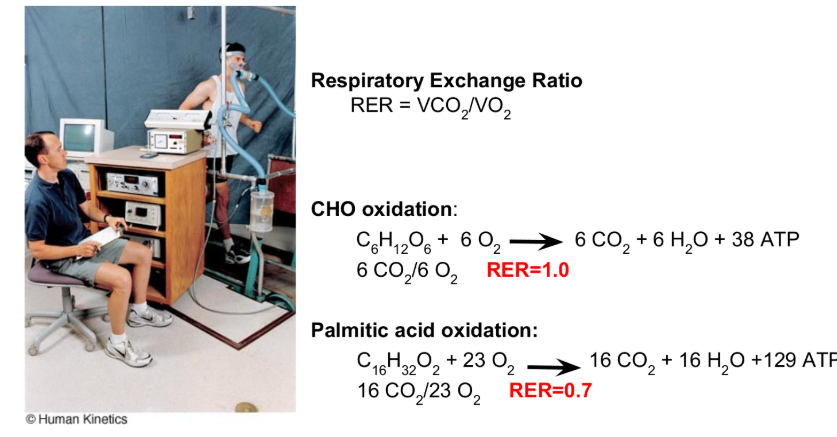
RER - Respiratory Exchange Ratio
RER = VCO2 / VO2
CHO oxidation
C6H12O6 + 6 O2 → 6 CO2 + 6 H2O + 38 ATP
6 CO2/ 6 O2 RER 1.0
All the energy comes from CHO (RER = 1)
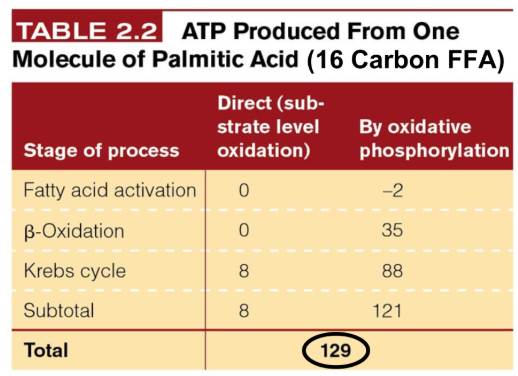
Palmitic Acid Oxidation`
C16H32O6 + 23 O2 → 16 CO2 + 16 H2O + 129 ATP
16 CO2/ 23 O2 RER = 0.7
Energy is 100% fat (0.7 RER)
Key Points
RER used to estimate % kcal derived from fat vs CHO
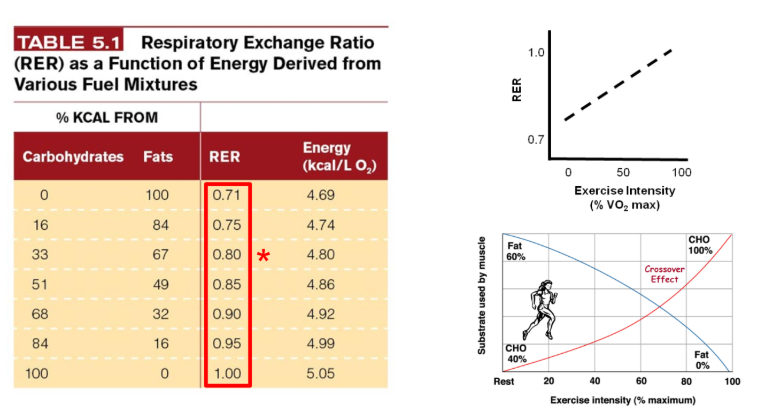
Respiratory Exchange Ratio (RER)
Key Points
Fat is primary substrate at rest
increase reliance on CHO as ex intensity increases b/c
Fat metabolism is slow
LA inhibits lipolysis
SIDE NOTE
100 percent of fat used - 0.71
67 percent of fat used 33 of CHO - 0.80
Training decreases RER at rest and at max compared to non-trained
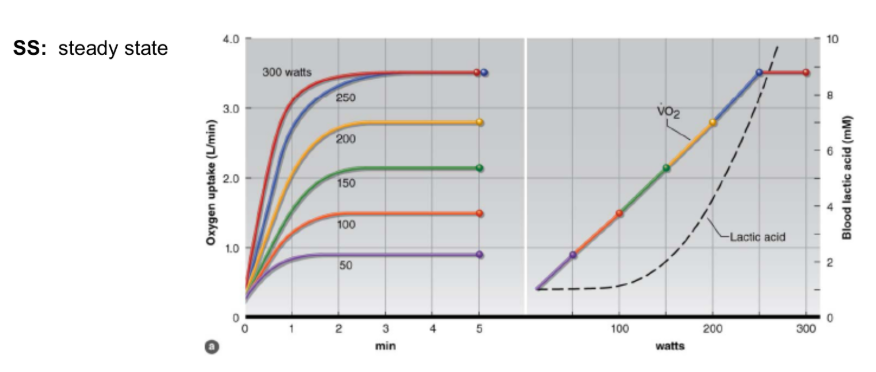
Submaximal Exercise
Key Points
SS VO2 is reached in 1-2 minutes
not instantaneous
Note
linear increase in VO2 as power increases
QUESTION
How is VO2 impacted by training
SIDE NOTE
the data is collected riding a bike
you can tell by units (L/min)
treadmill / weight bearing exercise is determined with kg involved
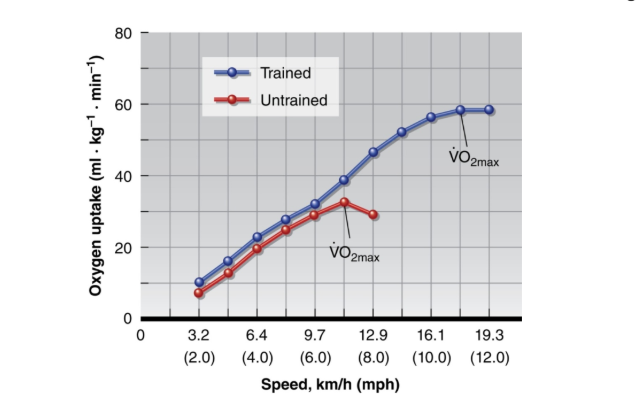
Maximal Exercise REVIEW
Note
VO2 at any submax workload is similar
Training increases VO2 max
increase CO max
increase a-v O2 diff max
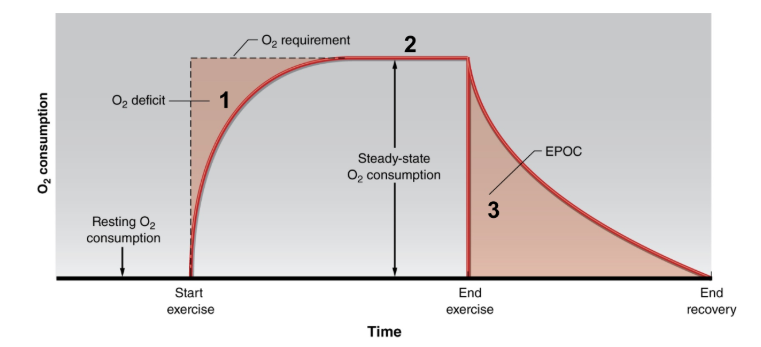
Excess Post Exercise O2 Consumption (EPOC)
NOTE
@ 1
Anaerobic Metabolism provides some ATP
@ 2
O2 supplied = O2 required
@ 3
VO2 stays elevated to restore homeostasis
Key Points
O2 deficit
Due to time lag in CV adjustments
not instantaneous due to the process of O2 in the system
air → lungs → blood
Steady State
Due to feedback from nerves:
Group III (mechanoreceptors)
Group IV (metaboreceptors)
EPOC
Excess O2 used to:
Replenish/Replace ATP/PCr storage
Convert LA to glycogen
Reoxygenated Hb & remove/clear out CO2