Graphing Trig Functions
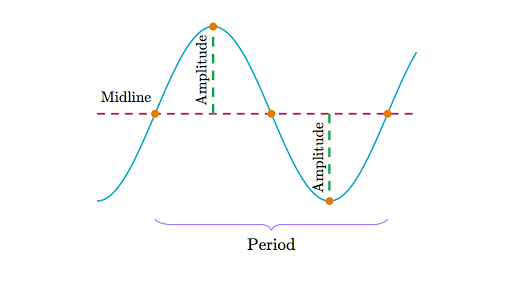
- midline↔horizontal center line about which the sinusoidal function oscillates above and below
- amplitude↔height from the center line to the peak of a periodic function
- period↔wavelength of a sine or cosine graph
- MAP it!↓
- Midline
- Amplitude
- Period
- General Form of a Trig Function↔y = h + A(sin|cos|tan|csc|sec|cot) k\theta + c (k affects frequency, h affects midline)
- horizontal shift↔\frac{-c}{k}
- Period of sin & cos↔\frac{2\pi}{k}
- Graphs of csc & sec↓
- asymptotes @ zeros
- peaks⇔valleys
- are parabolic
- Graph of tan
- I'm a zero, and I spread out my arms 1/2-period long.
- is like x^{3}
- Graph of cot↓
- I'm an asymptote, and I spread out my arms 1-period long.
- is ike -x^{3}
- Period of tan & cot↔\frac{\pi}{k}
- arcsin domain→[−1, +1]
- arcsin range→Q IV, I: [−π/2, +π/2]
- arccos domain→[−1, +1]
- arccos range→Q I, II: [0, π]
- arctan domain→all reals
- arctan range→Q IV, I: (−π/2, +π/2)