Notes: Fiscal Policy
Fiscal Policy
Overview
Topic: Political Economics, Topic 8
Presenter: Andrew Pickering
Central Government Debt
Central Government Debt as a Percentage of GDP
Historical data presentation includes debt levels corresponding to years: 1940, 1960, 1980, 2000, 2020.
Countries included in analysis: Australia, Austria, Belgium, Canada, Denmark, Finland, France, Germany, Great Britain, Greece, Iceland, Ireland, Italy, Japan, Netherlands, New Zealand, Norway, Portugal, Spain, Sweden, Switzerland, United States.
Source of data: Reinhart and Rogoff (2011).
Optimal Government Debt
Quotation: Polonius in Shakespeare’s Hamlet, "Neither a borrower nor a lender be, For loan oft loses both itself and friend, And borrowing dulls the edge of husbandry."
Justifications for Borrowing
Tax-Smoothing (Barro, 1979)
Rationale for cyclical deficits, not for persistent debt.
Strategy to maintain government spending during recessions when tax revenues fall.
Time-Discounting
Economic Growth
Pay-As-You-Go Pensions
War
Historical Data on UK Government Debt
200 years of data indicating debt levels rising to approximately 300% of GDP.
Presentation includes Gross General Government Debt, as % of GDP and in 2015 Prices (£bn).
Sources: UK Debt Management Office, ONS.
The ‘Golden Rule’
States that borrowing is justifiable for investment (not for consumption) if the utility returns from additional future consumption exceed the lost utility returns today.
Assumes sustained economic growth and/or low borrowing costs.
Observed Debt Levels
Optimal debt mindset could be negative:
In scenarios of low economic growth.
Under conditions of high uncertainty (wars, environmental concerns).
If net borrowing costs are positive (leading to the creation of sovereign wealth funds).
Observed debt levels are unlikely to be consistently optimal.
Debt Aversion and Empirical Findings
Discusses the controversy over the findings of Reinhart and Rogoff (2010), highlighting that the empirical relationship between economic growth and government debt is weaker than initially argued.
Explanations for Observed Debt Levels
Strategic Debt (Alesina and Tabellini, 1990)
Concept of politician/voter myopia.
Other factors include lack of transparency, common-pool problem, etc.
Strategic Debt Model Components
Assumptions/Ingredients:
Two time periods.
Two-party competition with partisan preferences.
Two public service categories: military and non-military spending.
Period separation leads to uncertainty in future policymaker identity.
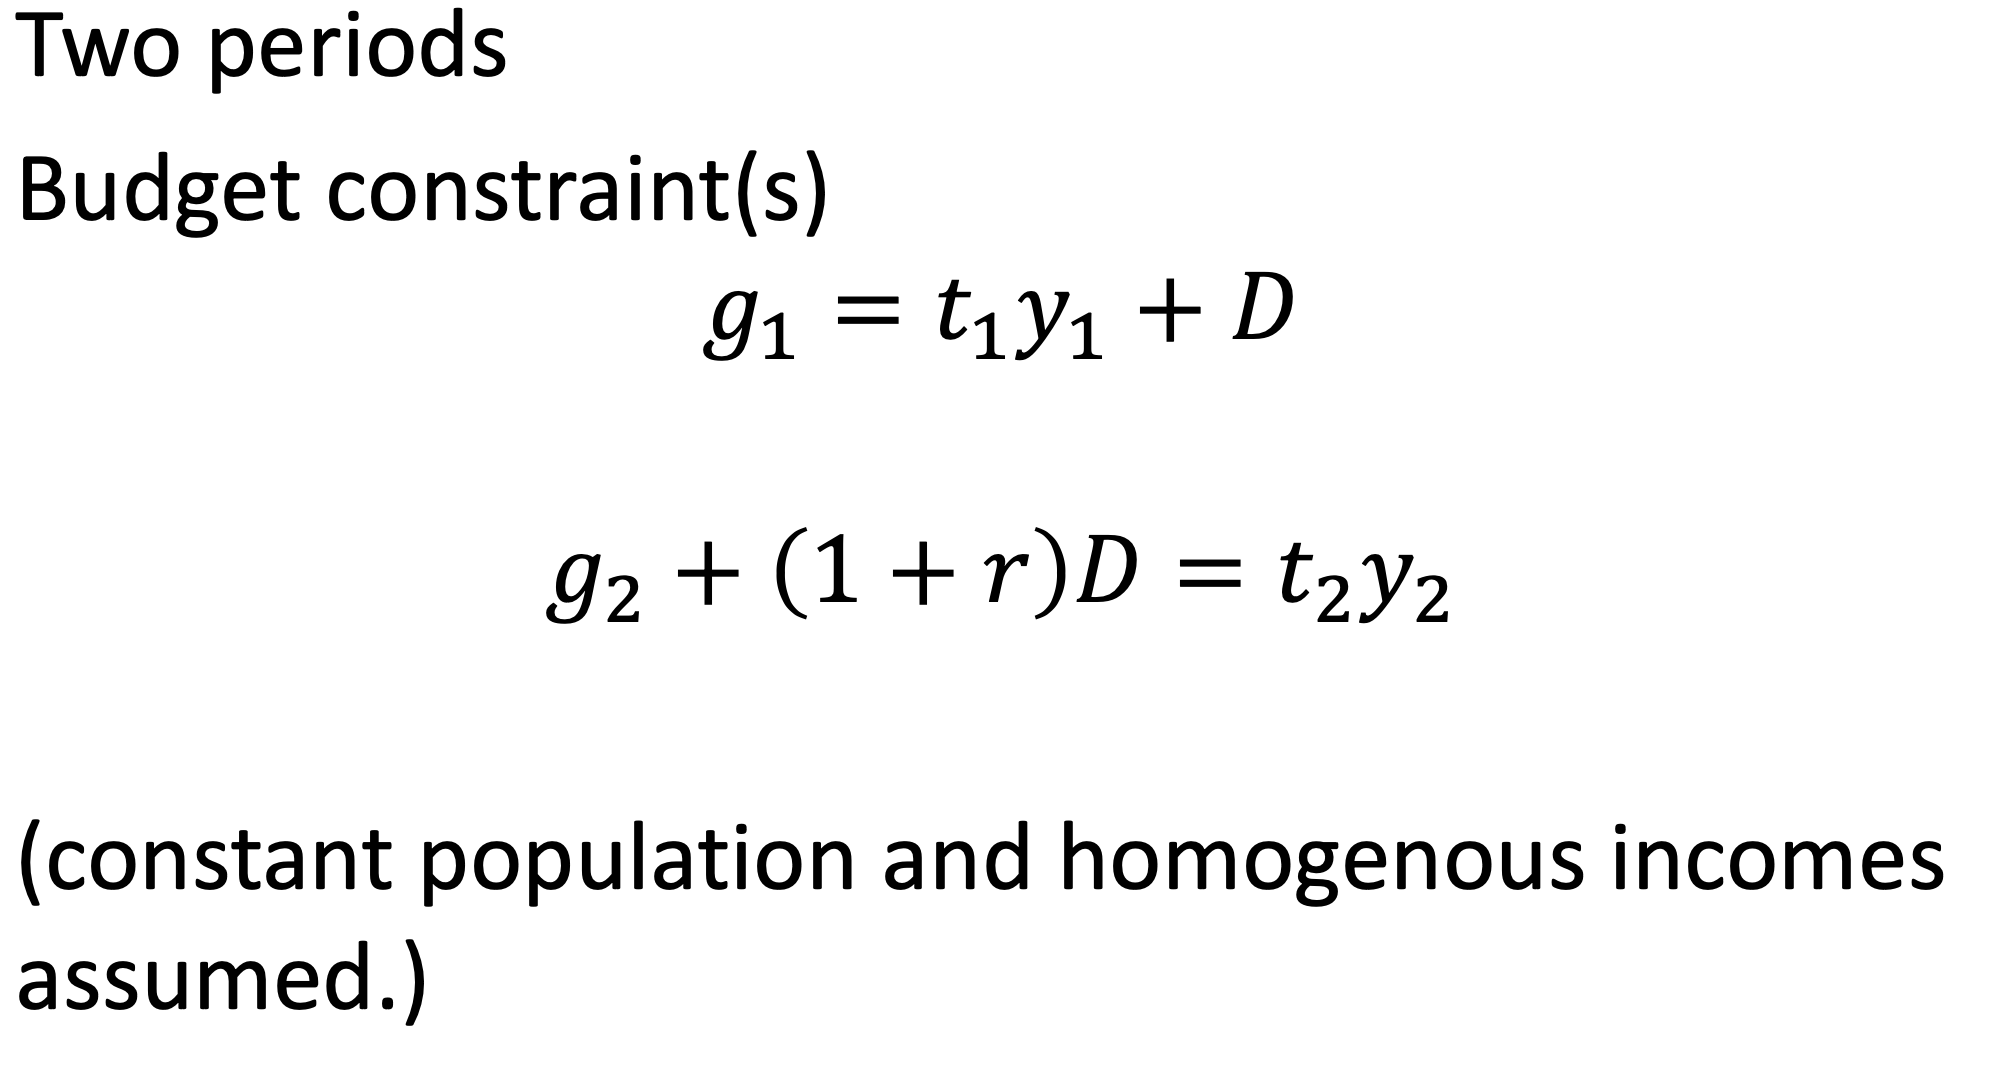
Budget Constraints in Strategic Debt
Period 1 Budget Constraint:
Period 2 Budget Constraint:
Components include:
M: spending on military.
N spending on non-military.
W: total endowment.
D: debt.
Optimization and Preferences
Objectives are determined by utility function properties.
Agents (voters and politicians) are heterogeneous, influences on social optimal debt level.
Optimal scenario dictates zero debt due to:
Constant endowment (no growth).
Diminishing marginal utility and lack of discounting.
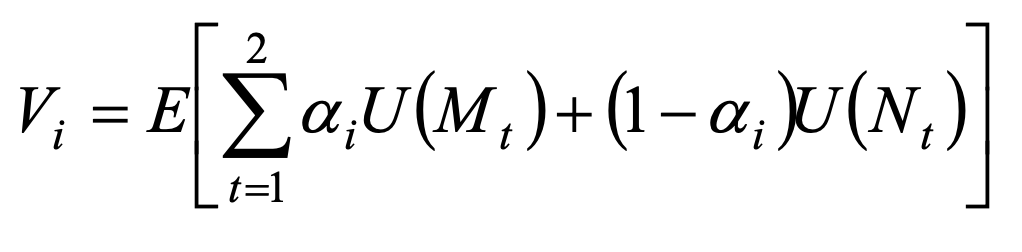
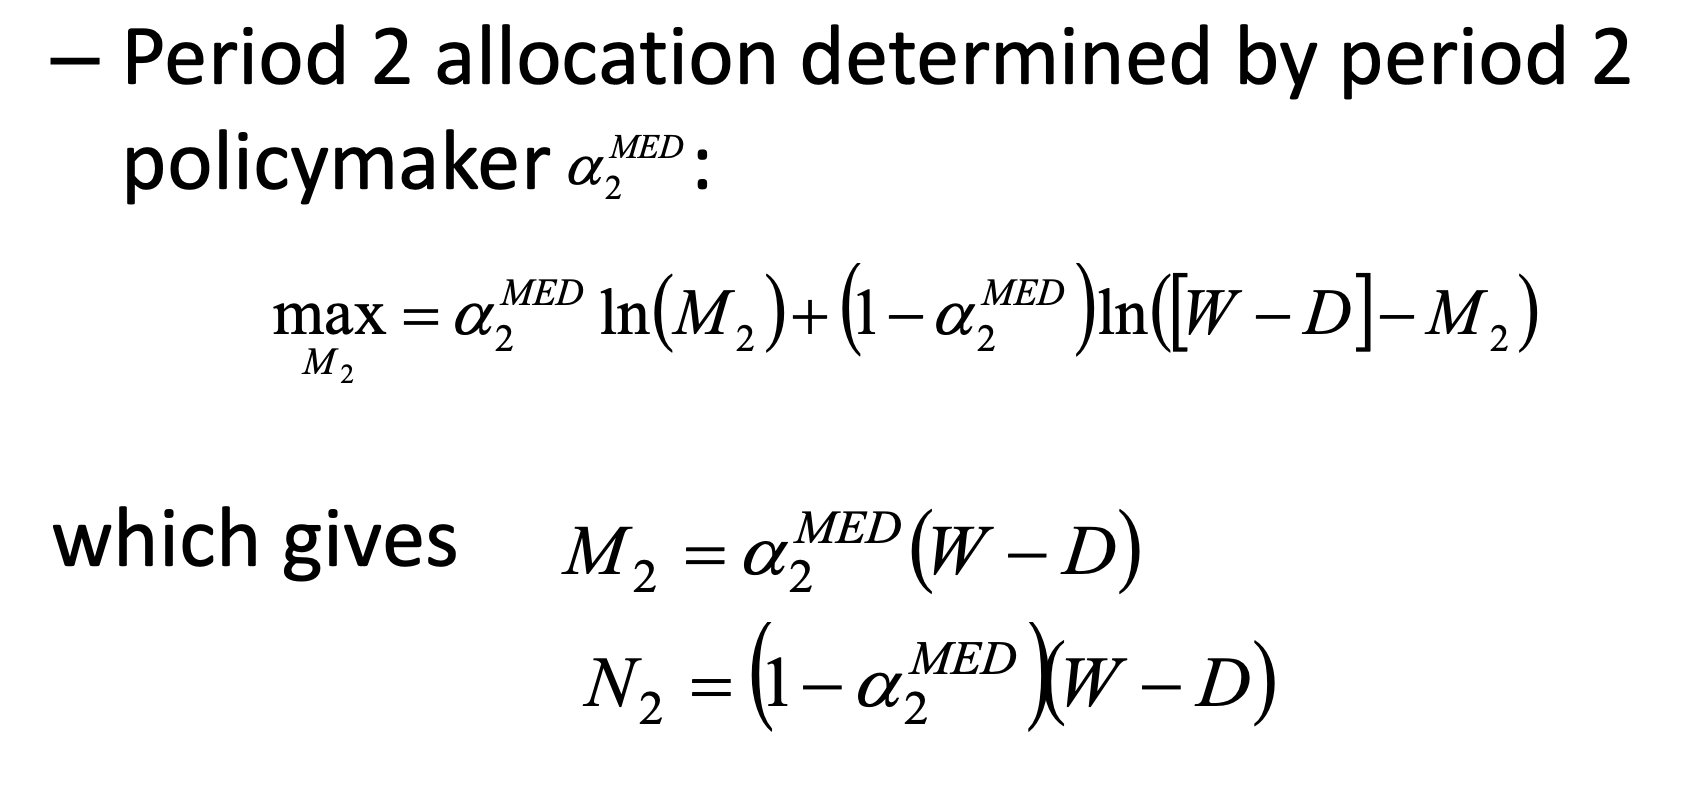
Decision-Making Under Uncertainty
Policymaker manipulates debt choice based on predictions of future policymaker preferences.
Maximization problem framework established for period 2 policy outcomes.
Period 1 Policy Framework
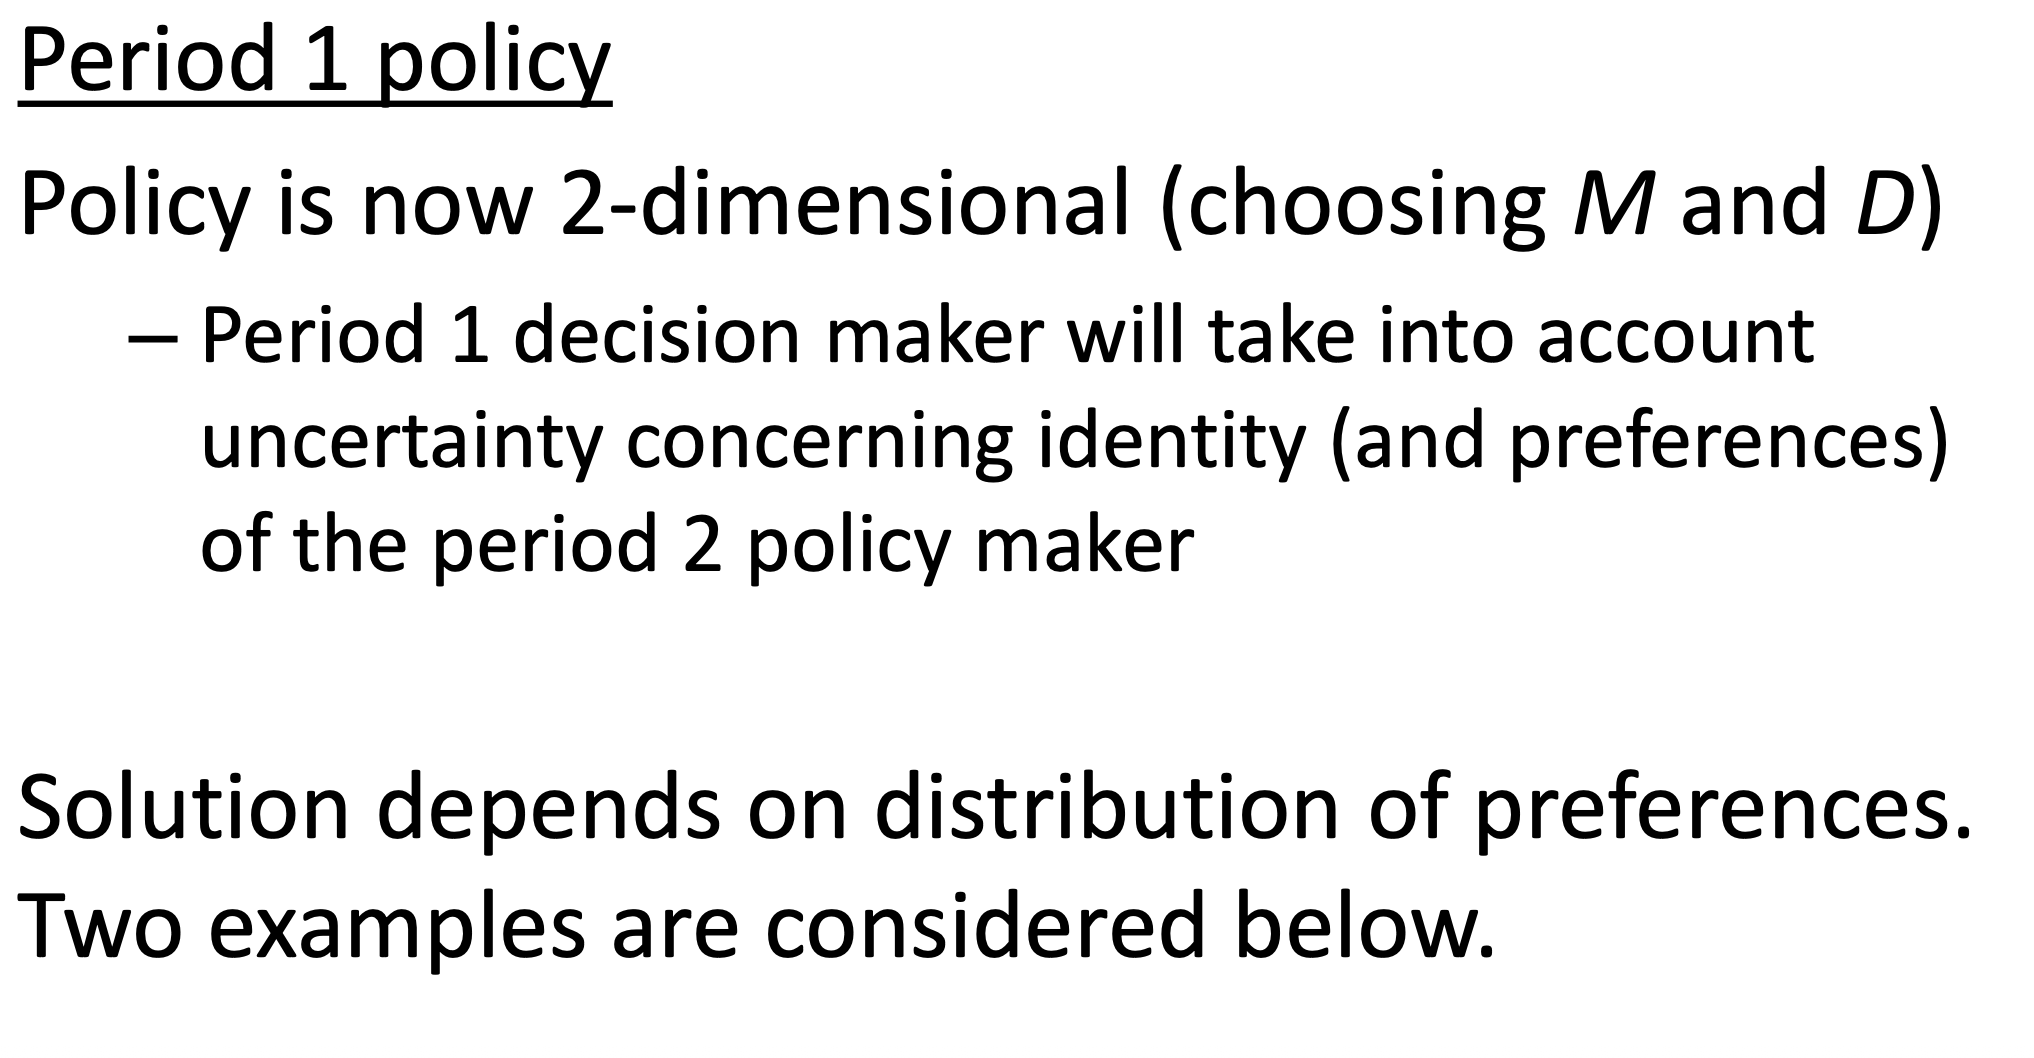
Problem is two-dimensional concerning spending and debt.
Decisions must consider the distribution of preferences within the electorate.
Case Studies in Strategic Debt
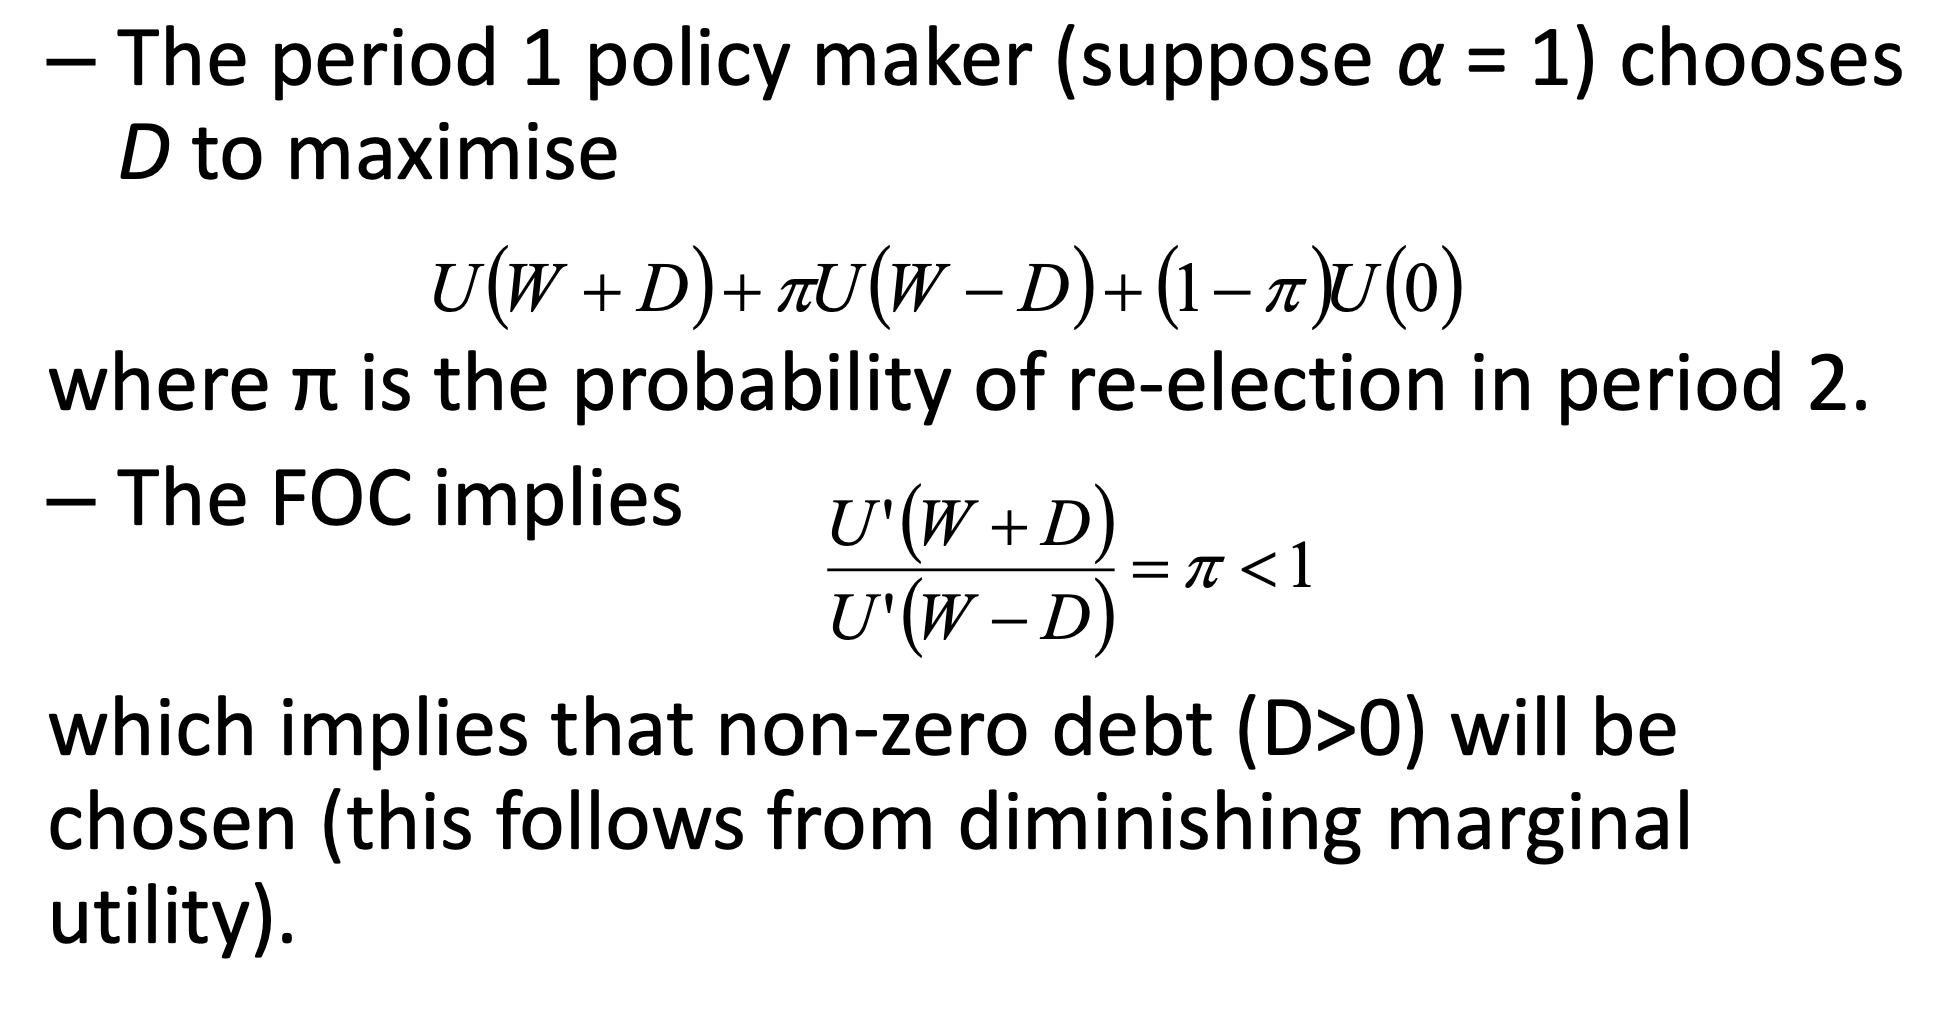
Case 1: Extreme Preferences
Examinations of scenarios where ideological preference is binary (0 and 1).
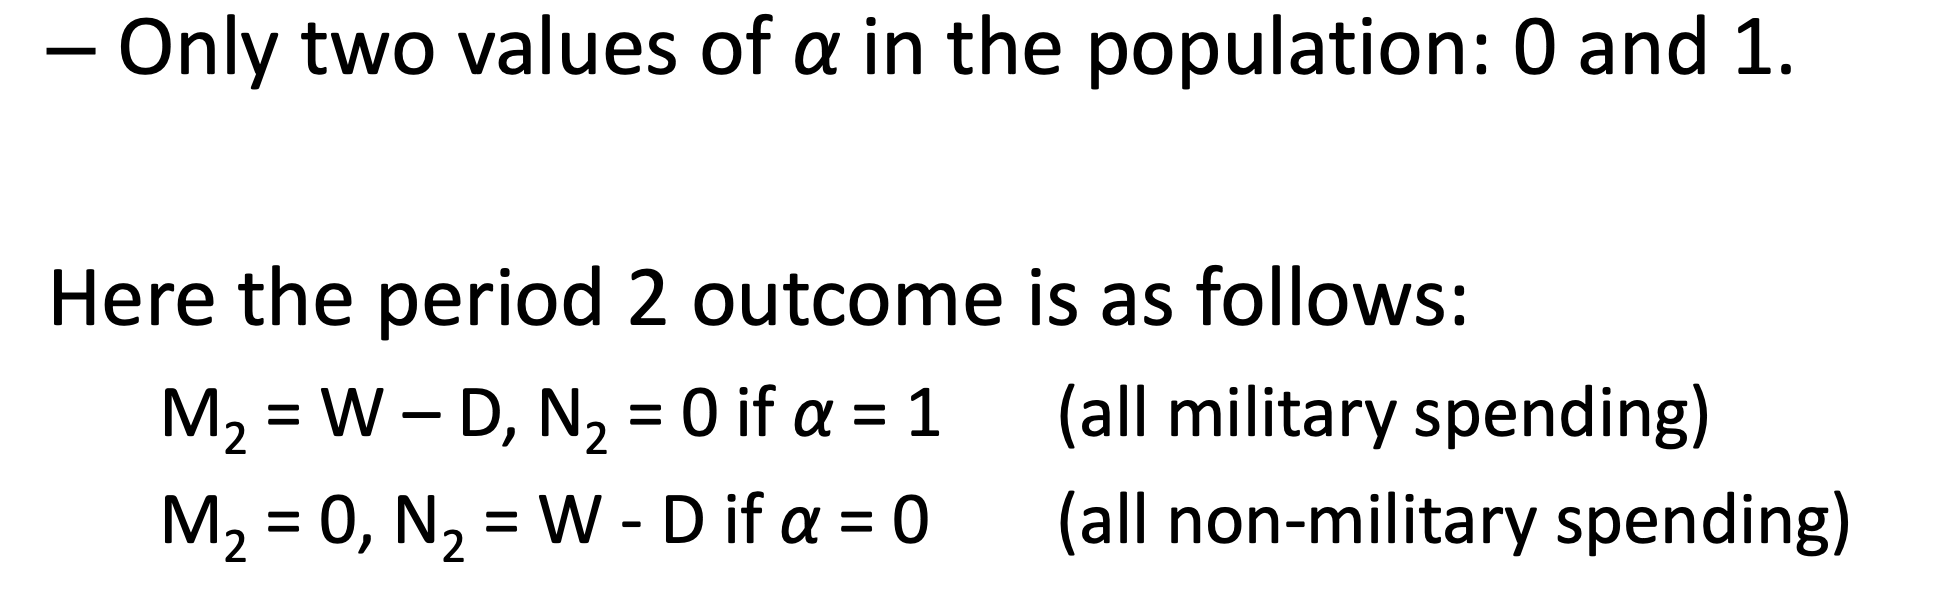
Implications on debt maximization based on expected re-election probabilities.
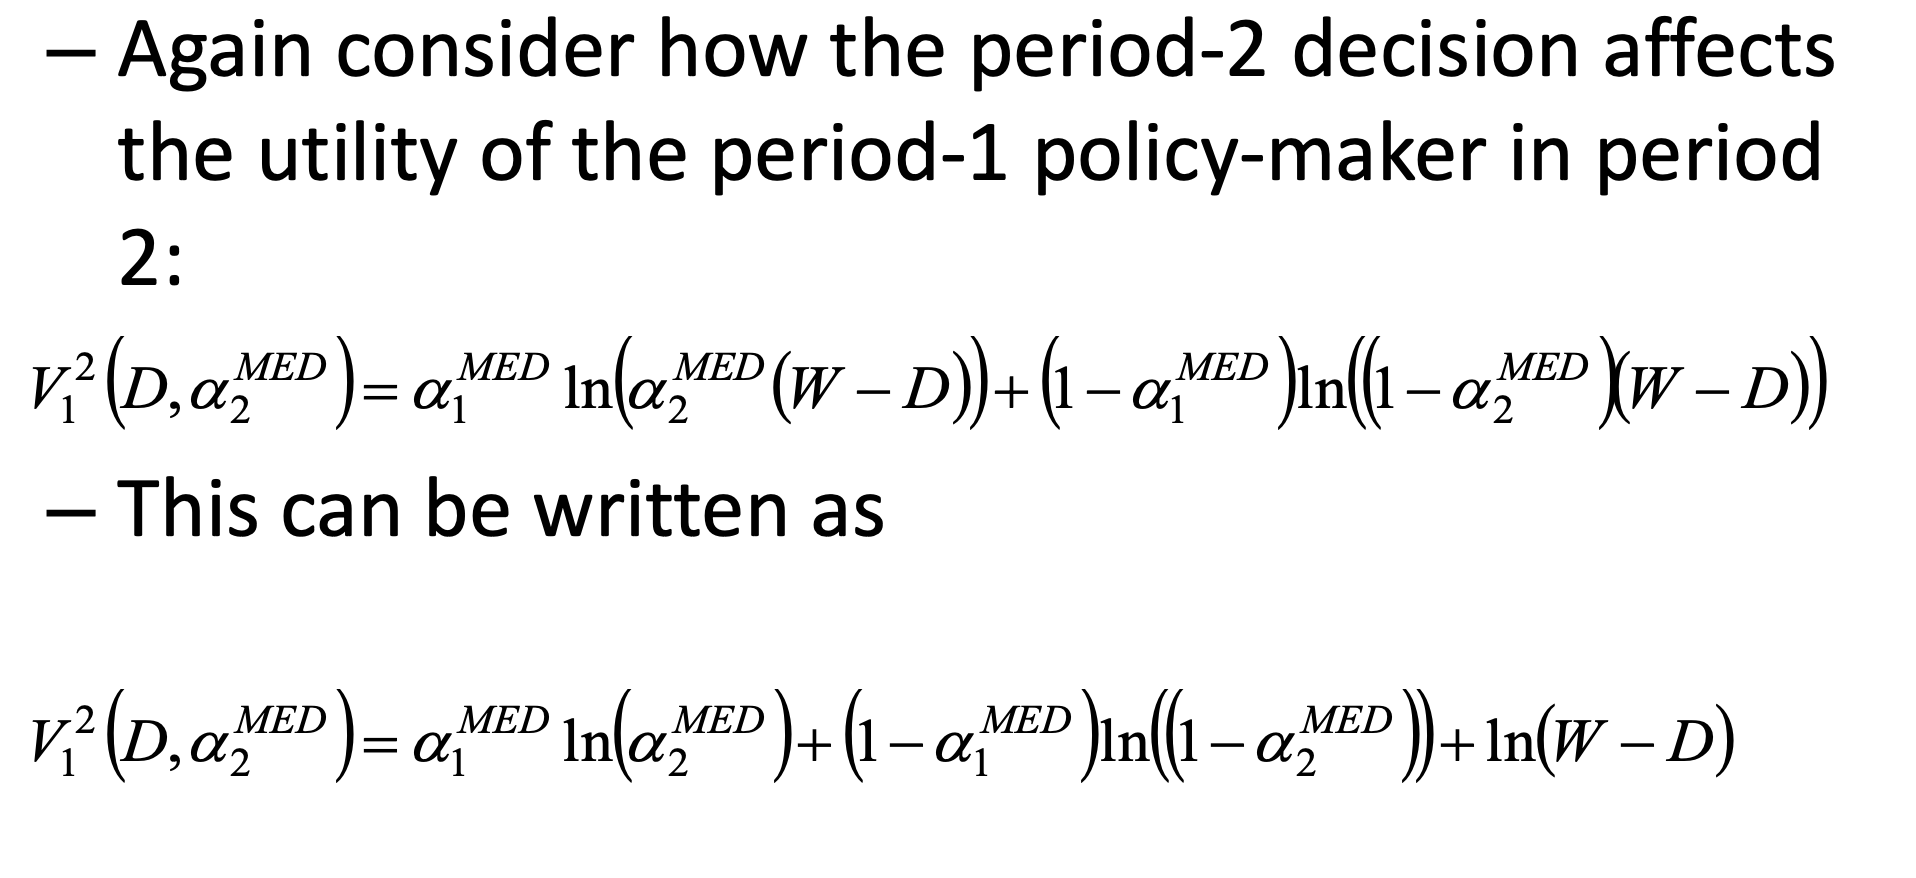
Case 2: Logarithmic Utility
Focus on how the period-2 policymaker’s utility is influenced by past decisions.
Determines best answer for period-1 policymaker: resulting in $D = 0$ (no deficit bias).
Alesina and Tabellini Summary
Underlines the complications of testing strategic debt empirically.
Higher debt leads to less favorable outcomes for future policymakers.
Myopia and Reflections
Quotes on Myopia
Louis XV: "Après moi, le déluge!"
Abraham Lincoln: "You cannot escape the responsibility of tomorrow by evading it today."
Sources of Short-Sightedness
Voter-Myopia: Caused by rational ignorance & lack of future bequest motives.
Politician-Myopia: Concerns about civil service constraints & legacy.
Heterogeneous Myopia
Key mechanisms highlight differences between voter and politician myopia. Voter influence can lead to higher public debt due to short-term preferences.
Theoretical Framework
Two Period Model
Budget Constraints Model (check presentation for further breakdown with equations):
Candidate Positions and Voter Preferences
Candidates are assumed to have material and ideological concerns.
Distribution uniformity of ideology among voters impacts candidate positioning.
Ideological Polarization Impact
Increased ideological polarization reduces responsiveness of debt to voter preferences.
Voters with narrow ideological preferences increase competition and may result in higher public debt.
Evidence of Debt and Polarization
Data Used
Annual data spanning 1945-2010 across OECD countries.
Central government debt measured as percentage of GDP.
Polarization Measure
Ideological polarization derived from left-right scores of participating political parties.
Statistical Results
Scatter plots and correlated coefficients demonstrate the relationship between debt and polarization over time.
Relationship coefficients show statistically significant trends relating to polarization levels.
Conclusions
Evidence contradicts strategic debt models; suggests a decline in debt with increasing polarization.
Indicates if short-termist behavior influences debt, stronger polarization can moderate the relationship.
Highlights that countries exhibiting high government efficiency show weaker relation with debt and polarization.
Other Sources of Inefficient Debt
Lack of transparency (Alt and Lassen, 2006).
Opportunistic behavior by government incumbents.
Intergenerational conflict.
The common-pool problem:
The gaming among government departments can dilute effective tax pooling strategies.
Observed to be a challenge particularly under coalition or fragmented governance structures.