Functional near infrared spectroscopy (fNIRS)
Optical principles underlying fNIRS:
Spectroscopy refers to the study of absorption and emission of light and other radiation
Bio spectroscopy applies to the principle of analysis of biological tissue, to generate a molecular fingerprint
Near infrared spectroscopy (NIRS) is an instance of bio spectroscopy
NIRS involves the emission of a light of a specific wavelength on biological tissues
Infrared lights provide an optical window into the brain
Human tissues have low absorption of near infra red lights (650-1000nm) which can travel through the skull and reach the cerebral cortex
The light is partly absorbed and partly reflected, detectors located nearby allow to identify light attenuation (or changes in optical density)
Light attenuation is the reduction in light intensity as it travels through a medium
NIRS spectroscopy relies on the distinct absorption spectra of oxygenated hemoglobin (hbO) and reduced or deoxygenated hemoglobin (Hb) to measure oxygenation
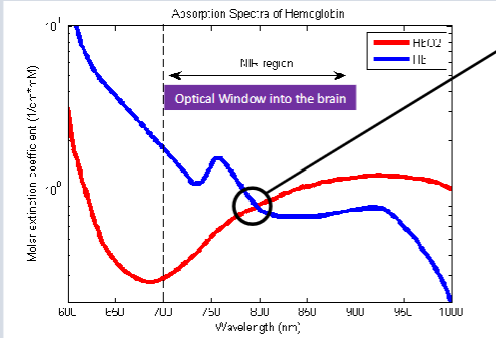
The isobestic point (the circle in the middle), 805nm, at this specific wavelength hbO and Hb absorb light equally
Two or more wavelengths are used, one below and one above the isosbestic point to accurately distinguish between HbO and Hb
Minimizing interference, using these wavelengths avoids high absorption of melanin, (400-700nm) and water (>1000nm), ensuring the signal is dominated by hemoglobin changes rather than other components
Physiological principles underlying fNIRS:
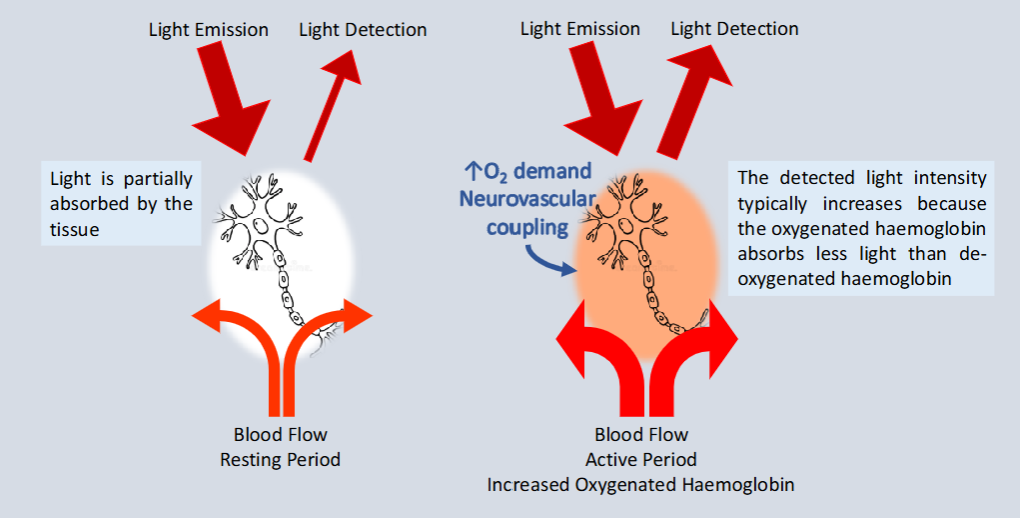
The left side is the resting state, light is sent into the head via near-infrared light into the scalp
Light travel through brain tissue, some gets absorbed, some gets scattered and some returns to the detector
At rest, blood flow is normal and there is a mix of HbO and Hb
Deoxygenated hemoglobin (Hb) absorbs more light
The right side is an active state, the neurons become active
Neurons need more oxygen, when brain cells work harder, they use up more oxygen and this increases oxygen demand
Neurovascular coupling happens, this is when active neurons signal nearby blood vessels to increase blood flow
Therefore blood flow increases and more oxygenated blood arrives
Oxygenated hemoglobin increases, oxygenated hemoglobin absorbs less light than deoxygenated hemoglobin-
Therefore more light returns to the detector and the detected light intensity increases
The device measures this increase
fNIRS device:
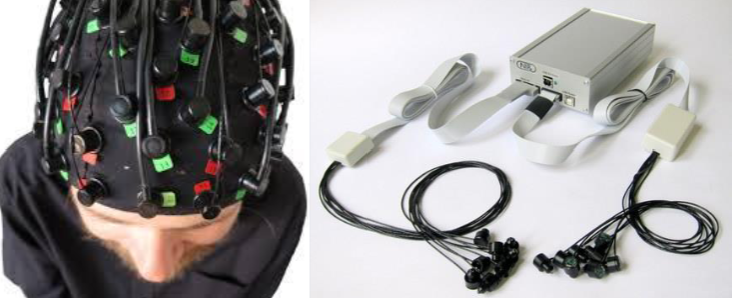
The system consists of optodes (sources and detectors) placed 3-5cm apart on the scalp to non invasively measure cortical hemodynamic responses
They detect changes in near infrared light absorption, primarily by hemoglobin in cortical blood, to map brain activity.
fNIRS as an alternative to fMRI:
fMRI is highly sensitive to motion, even small head movements can distort the signal
This makes it particularly difficult to use with young children, infants or clinical populations who may struggle to remain still
Some individuals also cannot undergo MRi due to claustrophobia or implanted medical devices
fNIRS can be portable, is quiet and far more tolerant to movement, the use of a cap allows participants to sit upright, interact with others and even move around in natural settings for testing
Makes fNIRS valuable for developmental research, studies with infants and toddlers work with clinical populations who are not suitable for fMRI
fNIRS has expanded neuroimaging into populations and settings that were previously difficult or impossible to study with traditional MRI methods
However, fNIRS shows reduced sensitivity in individuals with darker skin or thick hair, the light is absorbed or scattered before it can penetrate the scalp and reach underlying cortex
Principles of fNIRS:
Depth of penetration is related to source detector distance (longer distance = deeper penetration)
Increased distance leads to poorer signal to noise ratio (SNR)
The detected intensity is weaker, measurement variability becomes larger and the noise becomes more prominent
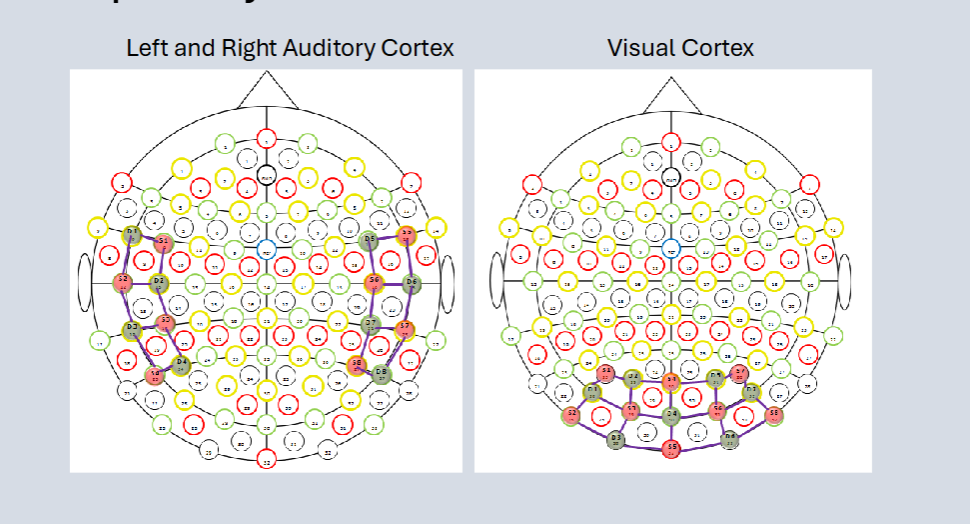
Examples of layout:
Example of fNIRS hemodynamic response:
The flashing checkboard task, aims to produce a strong, reliable and well localised activation of the early visual cortex
Flashing checkboard strongly activates the visual cortex
Neural activity increases
Brain cells use more oxygen
The body sends more blood to that area
This creates a measurable blood flow change (hemodynamic response)
fNIRS measures 2 things in the blood:
Hbo2 (oxygenated haemoglobin) and Hb (deoxygenated haemoglobin)
When a brain becomes active, Hbo2 increases and Hb decreases
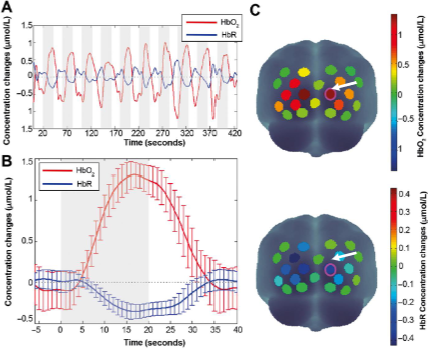
Graph A:
Hbo2 and Hb going up and down repeatedly as the checkerboard flashes on and off
Hbo2 rises during stimulation, Hb drops
Graph B:
Average response across trials
Blood response is slow and peaks at about 5-16 seconds after stimulus starts
Returns to normal after the stimulus stop
The brain reacts quickly but blood flow changes more slowly
Graph C:
The coloured dots show where activation is the strongest
Warmer colours (yellow/red) = more Hbo2 increase
Cooler colours (blue) = Hb decreases
Shows the activation is localised to the visual cortex which is what we expect
fNIRS hemodynamic response vs BOLD fMRI:
Both measure blood changes caused by neural activity just in different ways
A visual pattern (black and white radial grid) activates the occipital cortex (visual brain area)
When neurons activate, they use oxygen, the brain overcompensates by sending extra oxygenated blood
This causes a rise in HbO and a drop in Hb
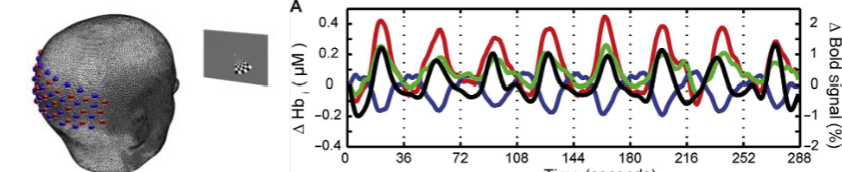
The graph shows that BOLD signal is positively correlated with HbO and anti correlated with HB
When HbO increases, BOLD increases too
When Hb decreases, BOLD increases
BOLD behaves like HbO but opposite to Hb
BOLD fMRI is mainly sensitive to deoxygenated haemoglobin (Hb)
HbR is slightly magnetic.
When HbR decreases: there is less magnetic distortion
The MRI signal increases
So BOLD goes up:
Neural activity → ↓ HbR → ↑ BOLD signal
FNIRS can be used in natural settings to record cortical activity during ongoing tasks:
Participants wearing a fNIRS system engaged in a diversity of tasks while activity of the frontal cortex was recorded.
In the Mirelman et al. (2014) experiment, the tasks were:
1) Walking
2) Walking and Counting
3) Walking and Subtracting in 7s
4) Standing and Subtracting in 7s
Higher activation was observed when participants carry out dual task: walking & counting and walking and subtracting.
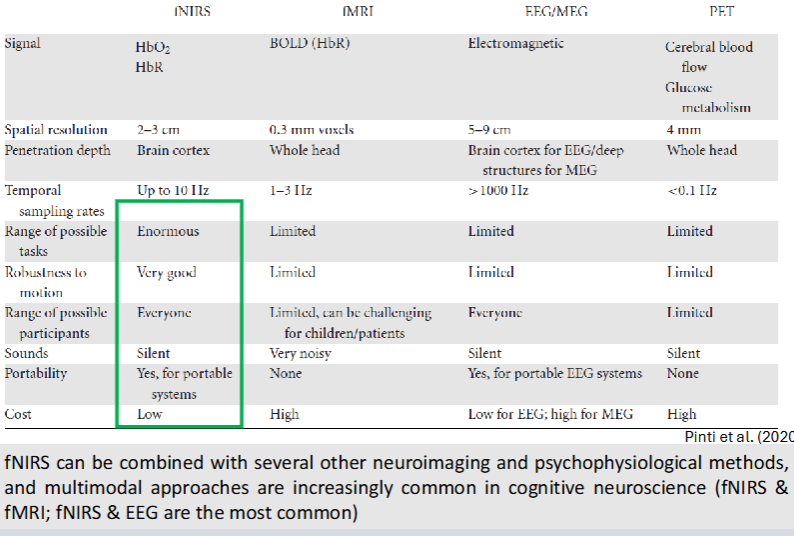
fNIRS advantages:
Better spatial resolution than EEG, better temporal resolution than MRI
Safe
Tolerant to motion
Portable
Low cost
Silent
Suitable for long periods of continuous monitoring
Compatible with other electrical and magnetic devices
fNIRS disadvantages:
Penetration depth approx 1.5-2cm
Lower temporal resolution than EEG, lower spatial resolution than MRI
Systemic interferences
SNR variable
Poor signal quality for participants with dark or thick hair
Lack of standardization in data analysis
Acquisition of structural/anatomical images not possible
fNIRS as a neurostimulator technique:
Waight et al. (2023): standard fNIRS device could change brain function when turned on.Healthy adults completed several cognitive tasks (Stroop, backwards counting, delayed match-to- sample) while wearing the fNIRS over the prefrontal cortex (PFC).
The device was on (projected near infrared lights) in the experimental but not in the control condition.
The experimental group, wearing the switched-on device, showed faster reaction times and some accuracy improvements, especially in executive-function tasks.
How would NIR lights enhance cognitive function?
Near-infrared light can pass through the skull and is absorbed by an enzyme inside neurons called cytochrome c oxidase, located in mitochondria.
This increases cellular energy production (ATP) and nitric oxide release, improving blood flow.
This seems to enhance neuronal metabolism, improve efficiency of neural networks and lead to faster cognitive performance