Understanding Functions
- Vocabulary:
- Continuous graph- represent real-world situations that are drawn without any interruptions made up of connected lines or curves.
- Discrete graphs: are made up of distinct, unconnected points.
Continuous vs. Discrete with Examples
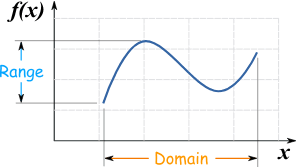
Domain: Represents all the x values
Range: Represents all the y values
- Range depends on Domain
 Video Explanation: Graphing Relationships and Interpreting Graphs
3.2: Understanding Relations and Functions
- Vocabulary
- Relation: a set of ordered pairs (x, y) where x is the input value and y is the output value.
- Function: type of relationship in which there is only one output value for each input value
- Vertical line test: a relation is a function if a vertical line does not pass through more than one point on the graph of the relation
- Domain: Represents all inputs
- Range: Represents all outputs
- Range depends on Domain
- Y depends on x
- Vocabulary
- Independent Variable: The input of a function (Domain)
- Dependent variable: The output of a function (Range)
- Function notation: If x is the independent variable and y is the dependent variable, then you can use function notation to write y = ƒ(x), which is read “y equals ƒunction of x,” where ƒ names the function
- Function Rule: An algebraic expression that defines a function
3.4: Graphing Functions \n There are a few different ways to write the equation of a line. One of the most common ways is called the "slope-intercept" form. It's called this because it clearly identifies theslope and the y-intercept in the equation. The slope is the number written before the x. The y-intercept is the constant written at the end.
How To Graph a Line in Slope-Intercept Form
- Step 1: Identify and plot the y-intercept.
- The constant written at the end is the y-intercept of the graph. This tells you where to begin your graph.
- Step 2: Identify the slope and use it to plot the 2nd point.
- The slope is the number in front of the x. Remember, the slope is rise/run.
- If it's positive, go up and to the right. If it's negative, go down and to the right.