Research methods
Aims
Aims are general statements that describe the purpose of an investigation
Examples
To investigate whether energy drinks make people more talkative
To investigate whether sunshine increases levels of happiness
To investigate whether a brain abnormality causes schizophrenia
What is an experiment?
An experiment involves the manipulation (changing) of an independent variable to see what effects it has on the dependent variable, while at the same time trying to control the other variable.
Variables
When conducting a simple experiment you will need to have two variables.
A variable is things which can vary or change. In psychological experiments, there are two different types of variables.
IV-manipulated or changed by researchers, not by other variables in the experiment
DV-the variable that changes as a result of the independent variable manipulation
Hypothesis
When carrying out experiments it is expected that the researcher will start a hypothesis.
The Alternate hypothesis is a testable statement which predicts how one variable will effect another. It is a statement which predicts a difference between conditions in an experiment.
The Null hypothesis says that there will be no difference between conditions and any difference will be due to chance and not from the manipulation of the IV.
directional or non-directional hypotheses
Directional hypotheses are predictions that state the direction the results will go in. For example, people who have consumed alcohol will concentrate less well than those who have not consumed alcohol
Non-directional hypotheses are predictions that do not state the direction that the results will go in. For example, there will be a significant difference in the concentration levels after consuming alcohol
Levels of the IV
In order to test the effect of the IV we need different experimental methods. The controlled condition is where there is no manipulation of the IV. The experimental condition is where you have manipulated the IV.
For example, the group that drinks energy drink (experimental condition) will be chattier than the group who does not drink an energy drink (controlled condition)
Experiments Hypotheses
Null- there will be no significant difference between the participants who [do something IV] and those who [do something else IV] when asked to complete [the task DV]
Directional- participants who [do something IV] will be significantly [faster better quicker etc] at [something DV] than participants who [do something else IV]
Non-directional- there will be a significant difference between participants [do something IV] and those who [do something else IV] when asked to complete [the task DV]
Pilot studies
A pilot study is a small-scale trial run of the actual investigation. This may only involve a small number of participants. The pilot study allows the research to identify any potential issues and modify the design or procedure, saving time and money in the long run.
Controls
Controls are used by the researchers to make sure the experiment is reliable. A control is something that is kept the same for each participant doing the experiment.
Researchers try to keep all variables (WHICH ARE NOT IV AND DVS) the same for all participants, so they do not affect the results.
The variables that need to be controlled in the research are called extraneous variables
Extraneous variables
An extraneous variable is any variable that you're not investigating that can potentially affect the outcomes of your research study.
Cofounding variables
If extraneous variables are not controlled, such as testing participants at different times of the day, in different environments ect, then these variables can become what we call confounding variables.
A cofounding variable is something that is not controlled throughout the experiment and has an effect on the result (DV)
So, if there are two conditions with caffeine (IV), and they influence the number of words recalled (DV). The extraneous variables will be the time of day, if its tea if coffee and if there’s noise.
there are two types of extraneous variables to control: Participant and Situational
Participant- gender, age, personality, intelligence
Situational- time of day, demand characteristics, light, heat
Psychologists try to control extraneous variables so that they dont become confounding variables. This means experiments can show cause and effect.
Demand characteristics
A feature of a procedure that influences a participant to try to guess what a study is about and look for clues as how to behave.
Controls for demand characteristics
deception- distractor questions, lying about the aim
single blind- the participant isn’t aware of which condition they are in
Investigator effects
The investigator effect is a term used to describe subtle cues or signals from an experimenter that affect the performance of participants in studies. The cues may be unconscious non verbal cues, such as muscular tension or gestures. They may be vocal cues such as tone and voice.
Controls for investigator effects
double blind- neither the researcher or the participant knows which condition they are in
Randomisation- using chance wherever possible to reduce the researchers influence.
Standardisation
Standardise- keep everything the same for each participant
Standardised procedure and standardised instructions.
Experimental design
This refers to the way in which participants are arranged in relation to the different experimental conditions.
independent group design
repeated measure design
matched pair design
Independent group design
Pps only take part in one condition of the experiment (two separate groups)
Strengths
no order effects (practice, fatigue, boredom) as they only take part in one condition
less chance of demand characteristics
limitations
any differences between the conditions could be due to participant variables, eg one group could do better because they are more intelligent- control by randomly allocating groups
less economical as twice as many participants are needed in comparison to repeated measures
Repeated measures design
Pps take part in both conditions of the experiment (one group)
Strengths
any differences between conditions are likely to be due to changes in the IV and not due to participant variables
fewer participants are needed to be recruited as they are used twice
Limitations
order effects may occur (e.g. practice, fatigue, boredom) as participants take part in all conditions
may see more demand characteristics as participants are more likely to work the aim if they take part in both conditions
Matched pair design
Pps are matched on variables relevant to the experiment, eg IQ, gender. One pps from each pair are then allocated a different condition.
Strengths
there are no order effects as pps take part in only one condition
Participant variables between conditions are reduced as participants have been matched.
Limitation
It is time consuming and expensive to match up participants
they can never be matched exactly.
What are order effects?
Carrying out a task repeatedly leads to change in performance
boredom effects- deterioration of performance across conditions as PPs become tired or bored
Practice effect- improvement across conditions through familiarity of the task or environment
This is a problem with repeated measure design
There can be a long gap between conditions.
use independent groups or matched pairs
counterbalanced design
Counterbalancing
Important control when using repeated measures. It reduces order effect as half pps do condition A, then B and the other half do B and A.
Types of experiments
lab experiment- Involves the manipulation of an IV and conducted under highly
controlled conditions. A laboratory is any environment where variables
can be well controlled
Field experiment- Involves the manipulation of an IV but the experiment is conducted in
‘the field’/a real world situation. Participants are often unaware that
they are being studied.
Natural experiment- The researcher takes advantage of a pre-existing IV which would
have changed even if the experimenter was not studying it.
Participants may be tested in the field or a lab.
Quasi experiment- Have an IV that is based on an existing difference between people,
e.g. age or gender. No one has manipulated this variable, it simply
exists.
Statistical testing
Levels of measurement
There are a lot of ways that variables can be measured and psychologists group measurements into one of the four scales.
nominal
ordinal
interval
ratio
The simplest level of measurement is nominal data (frequency data) then followed by Ordinal data (scores in rank order) then interval (a continuous scale with no absolute zero) and finally ratio ( a continuous scale with an absolute zero)
Qualitive data
Ordinal, nominal
Quantative data
Ratio, interval
Descriptive and inferential statistics
Descriptive statistics refers to graphs, tables, summary of data such as mean, mode and median etc, and measure of dispersion.
Inferential statistics refers to the use of statistical tests which tell a psychologist if the difference or relationship they have found is significant or not.
They help decide which hypothesis to accept and which to reject
Standard deviation
Standard deviation is a measurement of dispersion that shows that spread of scores around the mean. The greater the standard deviation the great the spread of scores around the mean.
Choosing a statistical test
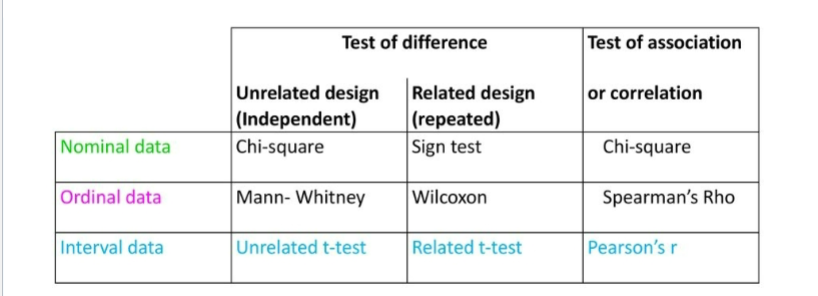 Carrots Should Come With Swede Under Roast Potatoes
Probability
The accepted level of probability in psychology is p<0.05
This means that there is an equal to or less than 5% probability that the result in a particular study occurred by chance and 95% probability that the results were due to the change in IV.
In some circumstances, researchers employ a stricter significance level such as 0.01, 1%
Statistical testing
In order to make valid conclusions that can be generalised to the target population we have to:
Use statistical (inferential) tests that have been designed to work out the probability (p) of whether a particular set of data could simply have occurred by chance.
Establish whether the difference between the two groups we tested is big enough to be of significance
When to use a sign test
To determine whether the difference we have found is significant, we can use the sign test.
To use the sign test:
we need to be looking for a difference than an association
we need to have used a repeated measure design
we need data that is organised into categories (nominal data)
How do a sign test
A study was conducted into whether people are happier after they had a holiday. Participants rated their happiness on a scale of 1 to 10, where 1 is very unhappy and 10 is very happy. They do this before and after the holiday (repeated measure design)
Step one- state the hypothesis
People will be happier after going on holiday than they were beforehand (directional hypothesis, so is a one tailed test)
If the hypothesis was non directional then a two tailed test is used.
Step two- record the data and work out the sign
On the table of results, you’ll put a + if the PP was happier after their holiday and a - if the PP was happier before their holiday.
Step three- find the calculated value
S is the symbol for the test statistic we are calculating. It is calculated by adding up the minuses and selecting the smaller value.
Step four- find the critical value of S
The calculated value now needs to be compared to a critical value to decide whether the results are significant or not.
You need to do the following instructions
the significance level is desired
the number of PPs in the investigation (The N value which ignores any zero values)
Whether the hypothesis is directional, or non directional
Correlations
A correlation is a statistical technique that can tell us if there is a relationship between two continuous variables
Correlations can establish whether there is a relationship between two co variables.
They use Quantative data.
Correlations can be
positive- as the scores on one variable increase, so do the scores on the other variable
negative- as the scores on one variable increase, so do the scores on the other variable
no correlation- when there is no relationship between two variables they are said to be uncorrelated.
Correlations coefficient
This refers to a number between -1 and +1 and states how strong a correlation is. If the number is close to +1 then there is a positive correlation, but if its close to -1 then there is a negative correlation. If the number is close to 0 then the variables are uncorrelated.
+1.0 perfect positive correlation
+0.8 strong positive correlation
+0.5 moderate positive correlation
+0.3 weak positive correlation
+0.1 very weak positive correlation
0 no correlation
-0.1 very weak correlation
-0.3 weak negative correlation
-0.5 moderate negative correlation
-0.8 strong negative correlation
-1.0 perfect negative correlation
Operationalising variables
You must think about how you are going to measure each variable so that you can correlate your data.
For example- Is there a relationship between stress and illness?
variable one- scores on a stress questionnaire
variable two- number of days absent from college since September
Hypotheses for correlations
The research hypothesis for correlations is called an alternate hypothesis. Hypotheses for correlations predict a relationship and not a difference.
Therefore you should never include the words “difference” “cause” or “effect” in a correlational hypothesis. (there is NO manipulation of the IV in correlation and so they can not establish a causal link)
Hypotheses for correlations must show both variables
Directional hypothesis for correlations
Say what kind of correlation is predicted, positive or negative.
For example; ‘there will be a significant positive correlation between the amount of independent study students do and their A level grades’ (the more they study the better their grades will be, and the less they study the lower their grades will be)
Non-directional
Non directional hypotheses for correlations just say that a correlation is predicted, no direction is predicted.
for example; ‘there will be a significant correlation between the number of hours paid work a week students do in term time and their a level result’
Null
The null hypothesis is the no relationship hypothesis, so for correlations the null will always say that there will be no relationship between variables
for example; ‘there will be no correlation between the amount of independent study students complete and the A level result
Correlation studies summary
can establish whether there is a relationship between two variables.
use Quantative data gathered by self report, observation, experiment or physiological measures.
allow us to assess the strength of that relationship and whether it is a positive or negative relationship.
Use descriptive stats known as scattergrams to represent the relationship between two variables.
are unlike experiments because it does not allow us to establish causal relationships (cause and effect)
Difference between correlations and experiments.
In an experiment the researcher manipulates the IV in order to measure the effect on the DV, meaning we can establish cause and effect.
In a correlation the variables are simply measured, no deliberate change is made, meaning no conclusion can be made about cause and effect.
Strengths of correlations
No manipulation of the variables so is useful when manipulation is practically or ethically impossible
Can be used as a starting point to an investigation and may suggest ideas of future research
Weaknesses of correlation
Can not determine cause and effect as only show a relationship between variables. This is because another untested variable could be causing the relationship between the two co-variables, known as intervening variables.
Technique is subject to any problems associated with the method used to collect data