day 6 part 2 Introduction to Demand and Supply Models
Application of the Demand-Supply Model: Roses and Valentine's Day
Initial Inquiry: The core question being addressed is why the price of roses increases significantly right before Valentine's Day.
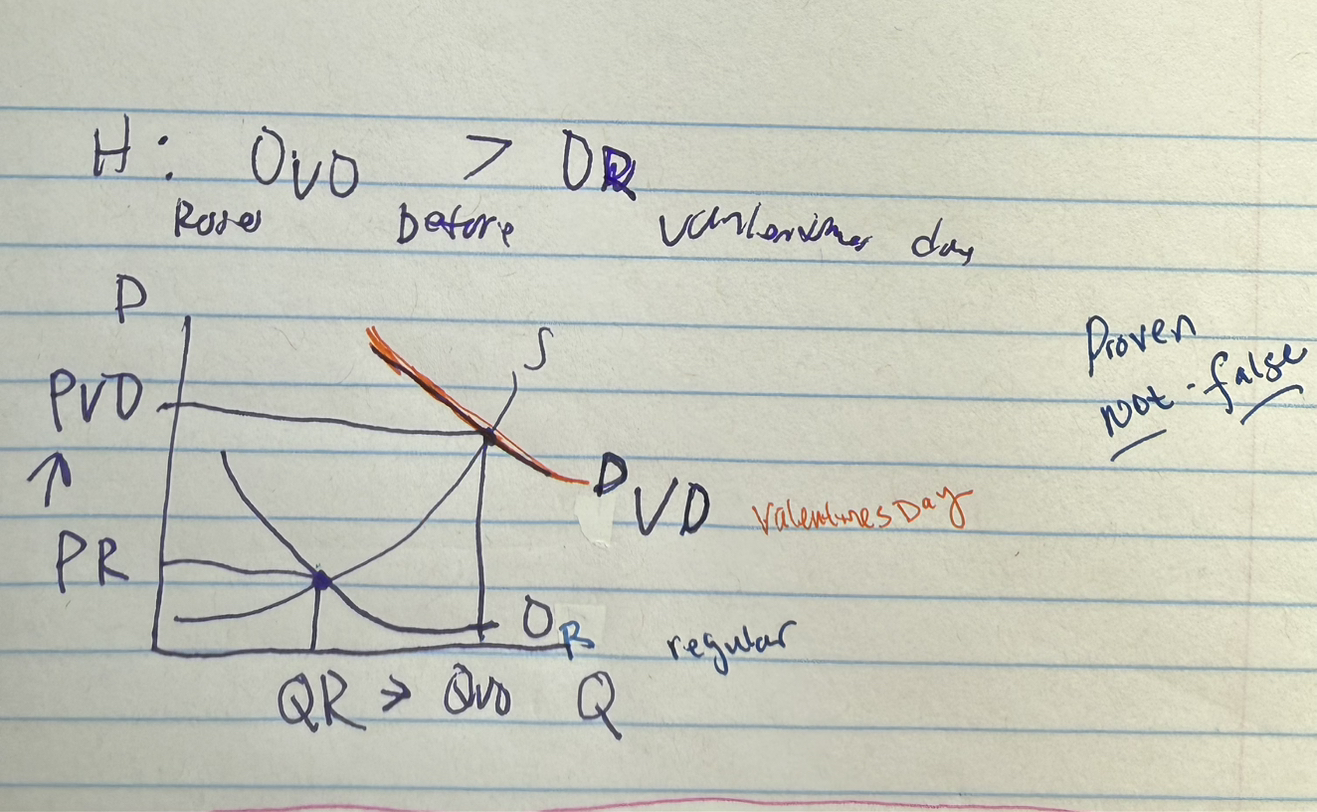
The Problem Hypothesis (): * The hypothesis states that the demand for roses before or on Valentine's Day is strictly greater than the demand at other normal times of the year. * Symbolic representation: D_{VD} > D_{R}, where is the demand on Valentine's Day and refers to demand during "regular" or normal times.
Initial Baseline Establishment (Regular Times): * To test the hypothesis, we established a benchmark using a generic supply and demand curve for roses year-round. * : The supply curve for roses, which is assumed to remain constant for this specific analysis to isolate the impact of demand. * : The demand curve for roses at normal times throughout the year. * : The equilibrium quantity of roses sold in regular times. * : The equilibrium price of roses in regular times. * Notation Clarification: The speaker explicitly noted a potential confusion in notation; in the expressions and , the subscript "R" stands for "regular" (the timeframe), not "roses."
Impact of the Demand Spike: * Right before Valentine's Day (often specifically the morning of), the demand curve for roses shifts significantly to the right (outward), becoming . * This shift creates a new equilibrium point at the intersection of the original supply curve and the new demand curve .
Analyzing the Results: * Price Effect: The new equilibrium price, , is observed to be much higher than the regular price (P_{VD} > P_{R}). This confirms the initial observation that prices rise during this holiday. * Quantity Effect: A critical part of verifying the model is checking the equilibrium quantity. The model predicts that if demand increases while supply remains constant, the quantity sold must also increase (Q_{VD} > Q_{R}). * Real-World Verification: In reality, stores sell a vastly higher quantity of roses during Valentine's Day than at other times. Since both the price increase and the quantity increase match real-world observations, the hypothesis that a demand shift drives the price is confirmed.
The Reason Supply Does Not Shift: * The speaker notes that while demand spikes, the supply of roses does not increase proportionally to keep the price down because it is difficult and not easily feasible to rapidly increase the production and supply of roses in response to a short-term seasonal peak.
Application of the Demand-Supply Model: Beer and Super Bowl Sunday
The Comparative Question: Why does the price of beer not increase right before Super Bowl Sunday, despite the fact that demand for beer clearly increases during this time?
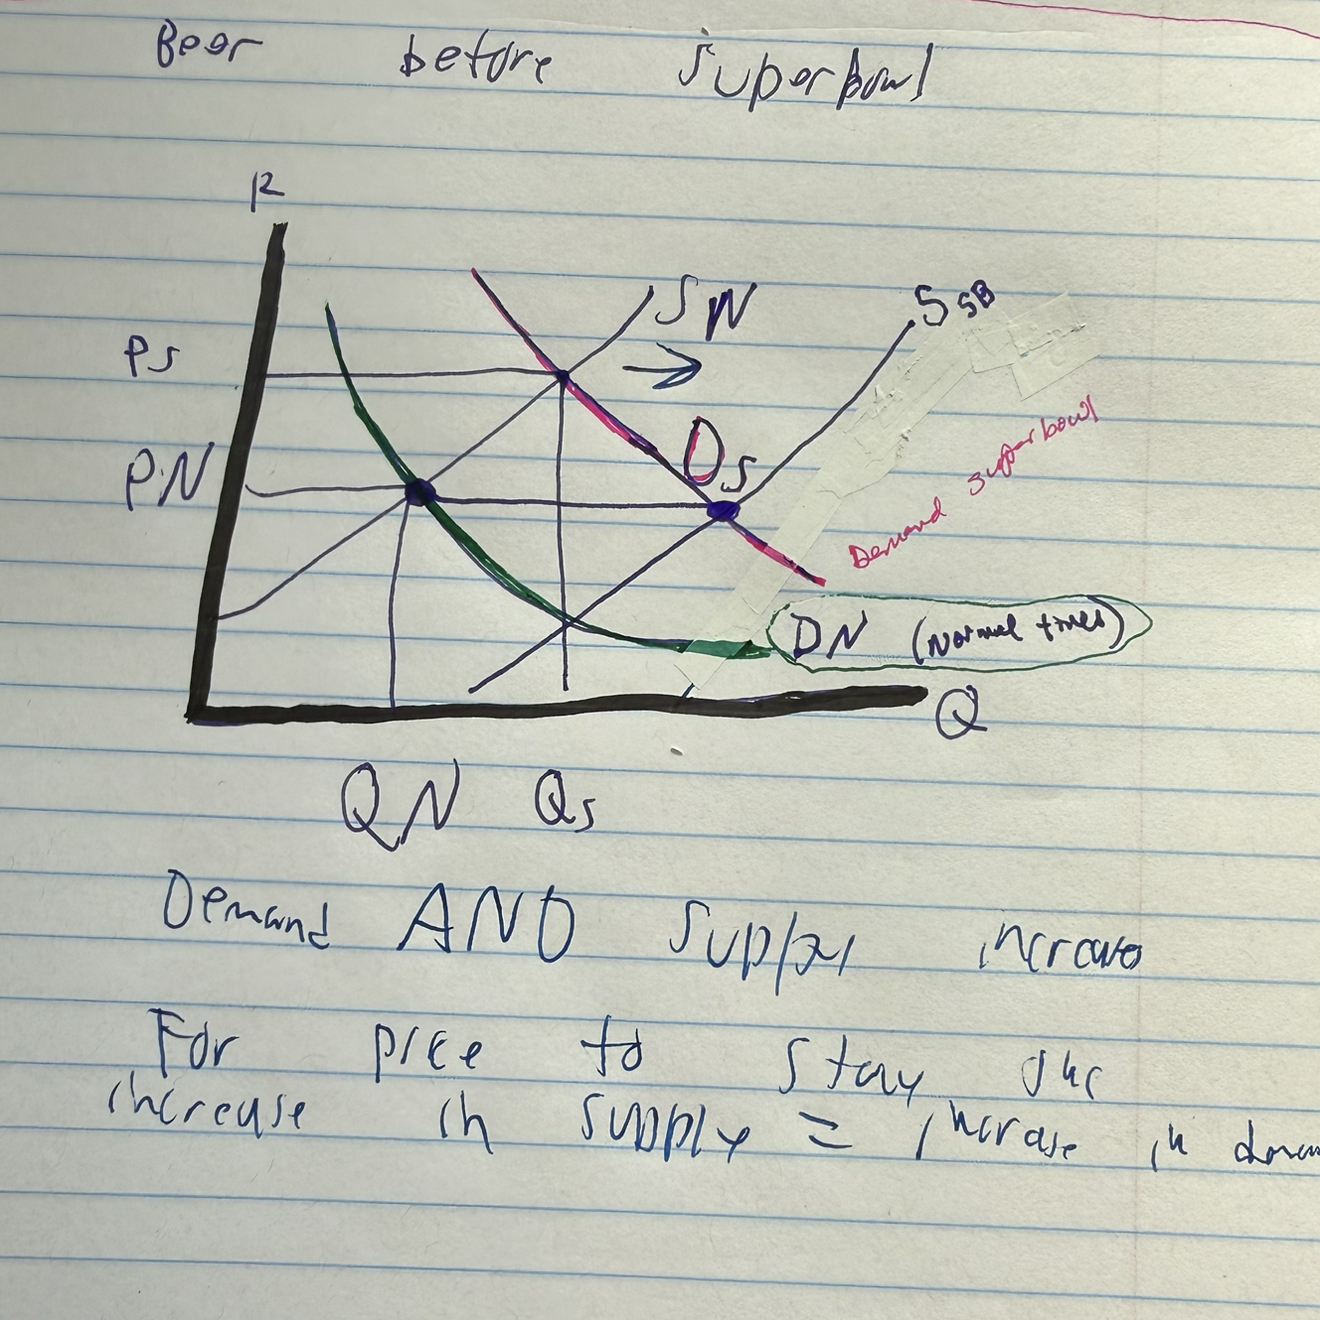
The Baseline Model for Beer: * : Normal demand curve for beer. * : Normal supply curve for beer. * : Equilibrium price charged in the market during normal times. * : Normal quantity of beer sold during the year.
The Demand Shift (): * It is a known fact that demand shifts outward right before Super Bowl Sunday. This is represented by the new demand curve . * If demand were the only factor shifting (as in the roses case), the model would predict a higher price and higher quantity.
The Role of Supply Shift (): * In the beer market, retailers and manufacturers anticipate the spike in demand. Consequently, they shift the supply curve outward () as well. * The speaker notes that beer prices often stay the same or may even be sold at a discount during this period. * Stable Price Mechanism: For the price to remain constant (), the increase in supply must exactly match the increase in demand. At this new equilibrium, the price is unchanged, but the quantity sold () is significantly higher than the normal quantity (Q_{N} < Q_{SP}).
Theoretical Scenarios: Magnitude of Supply and Demand Shifts
The speaker explores what happens when the shifts in supply and demand are not perfectly equal, as the market outcome depends on which shift is larger.
Scenario 1: Supply Shift is Smaller than Demand Shift (\Delta S < \Delta D): * If the outward shift in the supply curve () is smaller than the outward shift in the demand curve (), the new equilibrium point will result in a price increase. * In this case, the price would be higher than the original normal price, and the quantity supplied would increase, but not as much as it would in a balanced shift.
Scenario 2: Supply Shift is Larger than Demand Shift (\Delta S > \Delta D): * If the outward shift in the supply curve () is greater than the outward shift in the demand curve (), the new equilibrium price will actually be lower than the original price. * This results in a downward movement in price and an upward movement in the equilibrium quantity sold.
Summary of Market Comparison: * Roses: Demand increases, but supply is relatively inelastic or difficult to increase seasonally. Result: and . * Beer: Demand increases, but supply also increases substantially as retailers prepare for the event. Result: remains stable (or potentially decreases) while significantly.