methods of presenting data
graphs and charts provide a means of seeing the findings at a glance
TABLES
→the numbers you collect are referred to as raw data
they are usually summarised using measures of central tendency and dispersion
BAR CHARTS
→the height of the bar represents frequency
bar charts are mostly suitable for data that’s not continuous, specifically nominal data
data is set out in distinct categories
in bar charts, spaces are left between each bar to indicate the lack of continuity
HISTOGRAMS
→similar to bar charts except the area within the bar must be proportional to the frequencies represented
vertical axis must begin at 0
horizontal axis must be continuous
there should be no spaces between the bars
LINE GRAPHS
→the y-axis represents frequency but, like a histogram, the values along the x-axis must be continuous
data that have some implicit order, such as numerical data
normal distributions
→when measuring certain variables, the frequency of these measurements should form a bell-shaped curve
the bell shape is symmetrical
most people are represented in the middle of the curve, with the mean, median and mode occupying the centre point
skewed distributions
→not all distributions are balanced/symmetrical
some lean more to one side or more
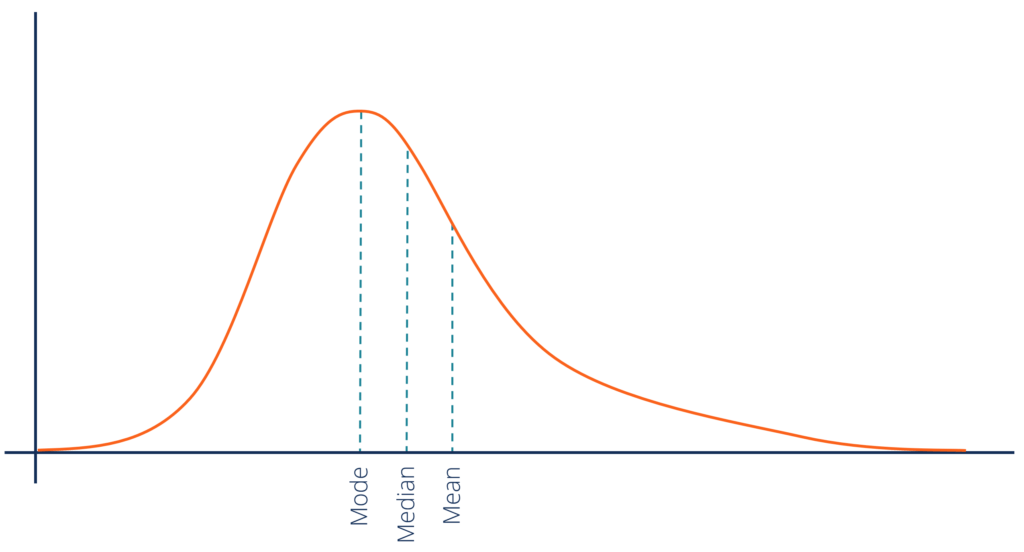
POSITIVE skew: most of the distribution is concerntrated towards the left of the graph, with a long tail off to the right
this shows people scoring lower than average
mean is higher than median
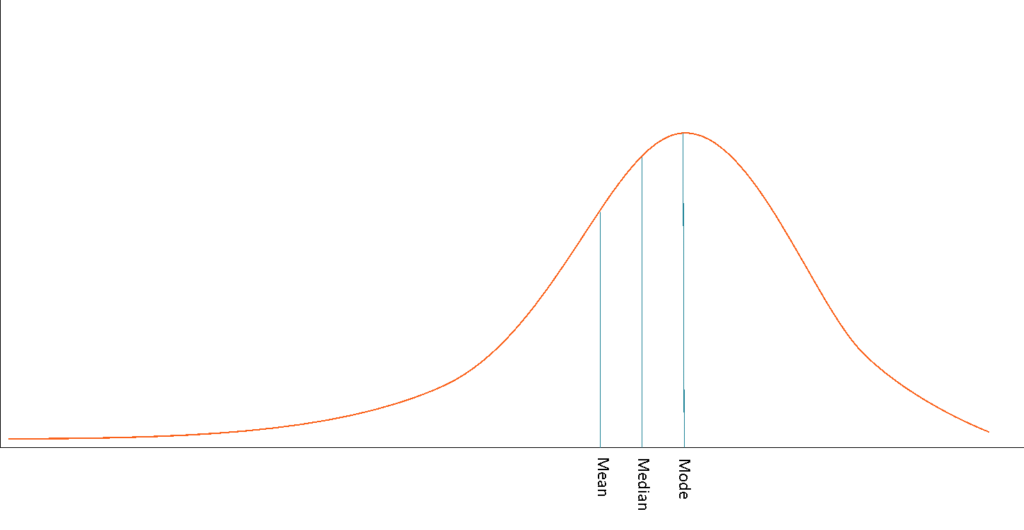
NEGATIVE skew: most of the distribution is concerntrated towards the right of the graph, with a long tail off to the left
this happens when most scores are high
median is higher than the mean
ways to improve data
→get a larger sample
→adjust the difficulty to produce appropiate results