L10 - Seismic Sources
Earthquake Seismology and Seismic Sources
This lecture covers the analysis of earthquakes and other seismic sources using seismology, including fault types, focal mechanisms, earthquake location, magnitude, and various natural and human-induced seismic signals.
Seismic Signals and Sources
Seismic stations record ground motion from various sources, including:
Earthquakes: Sudden slip on a fault.
Hurricanes: Moving noise source passing over stations.
Earthquake Fault Types
Earthquakes result from a sudden release of energy due to slip on a fault, generating seismic waves.
Different types of faults:
Strike-slip Faults: Horizontal shear (e.g., offset in a field or road).
Normal Faults: One block moves down relative to the other due to tension (e.g., rupture where a block has subsided).
Thrust Faults: Compression causes one block to move up relative to the other (e.g., area thrusted over another).
Slip-Stick Model
Fault behavior involves a cyclic process:
Fault moves.
Strain builds up.
Fault moves again (earthquake).
Slip-Stick Model Explained:
Consider a strike-slip fault (red line) where one crustal piece moves relative to the other.
Initial elastic accommodation occurs through creeping.
Stress accumulates over time (tens to thousands of years), depending on movement speed and material strength.
When stress exceeds the fault's strength, a sudden slip occurs (earthquake) on a timescale of seconds.
The cycle repeats as tectonic plates continue to push against each other.
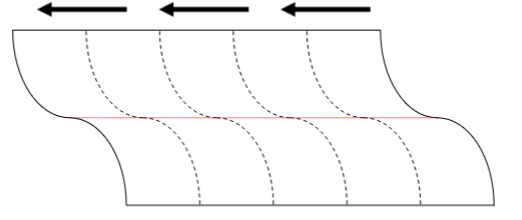
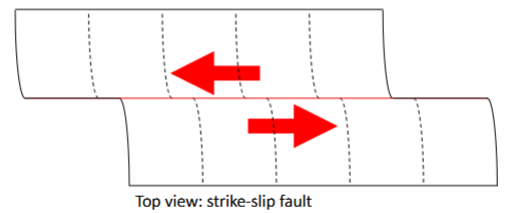
Observed faults are the result of numerous earthquakes over long periods.
Fault Identification Using Seismology
Different fault types exhibit characteristic motion patterns that seismology can identify.
Conceptual Model:
Imagine pushing against a bar. Points on one side experience tension (motion towards the bar), while points on the other side experience compression (motion away from the bar).
Points at the bar experience no motion.
Tension is denoted as negative displacement, compression as positive displacement.
Strike-Slip Fault Motion
For a dextral strike-slip fault, consider motion relative to a reference point.
Material moves outward (upward motion/positive) on one side and inward (negative motion) on the other side.
Points aligned with the reference have no motion.
Seismological Representation:
First motion of a P-wave indicates compression (black dot) or tension (white dot).
Strike-slip faults show a characteristic "beach ball" pattern: two lines through the center, with alternating quadrants of compression and tension.
This pattern helps define the fault plane and an auxiliary plane with opposite motions.
By observing the first motions (positive or negative) of P-waves arriving at seismic stations, we can infer fault motion.
Focal Mechanisms and Lower Hemisphere Projection
The first motions recorded relate to the orientation of fault motion.
Because the wavefield is three-dimensional (waves travel through the Earth), analysis uses a lower hemisphere projection.
Lower Hemisphere Projection:
Imagine cutting a sphere horizontally and analyzing motions projected onto the bottom half, representing waves traveling downwards through the Earth.
This projection results in a focal mechanism that describes the fault's first motions.
A normal fault, viewed from the side, resembles a strike-slip fault.
The lower hemisphere projection of a normal fault shows areas of black (compression) and white (tension).
Different fault types (strike-slip, normal, thrust) have characteristic focal mechanisms.
Thrust fault: compression in the center, tension on the sides
Normal fault: tension in the center, compression on the sides
By analyzing data from stations globally, we determine up or down motion, plot points on a stereographic projection, and identify planes separating positive and negative motions to derive the focal mechanism.
Plate Boundaries and Earthquake Types
Transform Faults: Typically strike-slip earthquakes.
Mid-Ocean Ridges: Tension, leading to normal faults.
Subduction Zones: Thrust faults due to compression.
Seismology helps study fault motions in these settings.
*Examples:
*Subduction zones typically have thrust faults where compression occurs on the overriding plate. Normal faults can also be observed in the outer rise where the plate bends downward.Focal mechanism analysis reveals stress patterns and their relationship to tectonics.
Earthquake Location
Location is determined primarily using the arrival times of P and S waves.
P-waves travel faster than S-waves.
The time difference between P and S wave arrivals increases with distance from the earthquake.
By recording P and S wave arrivals at three or more stations, we can triangulate the earthquake's location.
In practice, numerous stations are used, and algorithms automatically provide locations with associated uncertainties.
To find the depth, depth phases are used: e.g., - waves that travel upwards to the surface before arriving at the receiver. The time difference between the direct wave and the depth phase depends on the earthquake's depth.
Earthquake Size and Magnitude
Moment Magnitude ():
A variant of the Richter scale based on the physical properties of the earthquake.
Related to the energy released:
, where:* : Seismic moment.
* : Area of fault that moved.
* : Displacement (how far material moved).
* : Shear modulus of the material.Scaling is logarithmic:
.
Other magnitude scales ( - Richter scale, - Body wave, - surface wave) are less universally applicable. is preferred.
Energy Release:
A magnitude earthquake released 22% of all energy released in large earthquakes since 1900.
Gutenberg-Richter Relationship
Describes the relationship between the number of earthquakes and magnitude:
: Number of earthquakes greater than a particular magnitude.
: Magnitude.
: Typically around 1, indicating that for every one unit increase in magnitude, the number of earthquakes decreases by a factor of 10.
Suggests that the physics underlying earthquakes of different magnitudes are similar.
Other Seismic Sources
Seismic data is continuously recorded, allowing for detection of various seismic sources.
Natural Hazards:
Volcano seismology: Microseismicity tracks magma movements under ice caps and aids in volcanic eruptions hazard assessment.
Landslides: Seismic signals can detect landslides and tsunamis in remote locations.
Icebergs: Tracking iceberg detachment and smashing to monitor climate processes.
Hurricanes: Wind and rainfall-induced ground vibrations.
Human Activities:
Nuclear explosions: Monitored by the CTBTO using seismic and infrasound data. Explosions show a large P-wave relative to surface waves compared to earthquakes.
Trains: Distinct signals from passing and stopping trains.
Crowd Movements: Seismic stations can detect crowd movements at concerts, with frequency content varying by songs. It becomes possible to study subsurface structures by comparing data from the same concerts across different cities.
Elephants: Seismic signals used to study elephant communication and behavior for potential poaching detection, by analyzing their gait, but other wildlife can also cause signals.
Summary
Seismic waves reveal various sources, enabling us to model diverse phenomena based on weight propagation principles.