lec 8 - sampling framework and measurement error
Survey: around 3 open ended, mostly closed
Sampling Process:
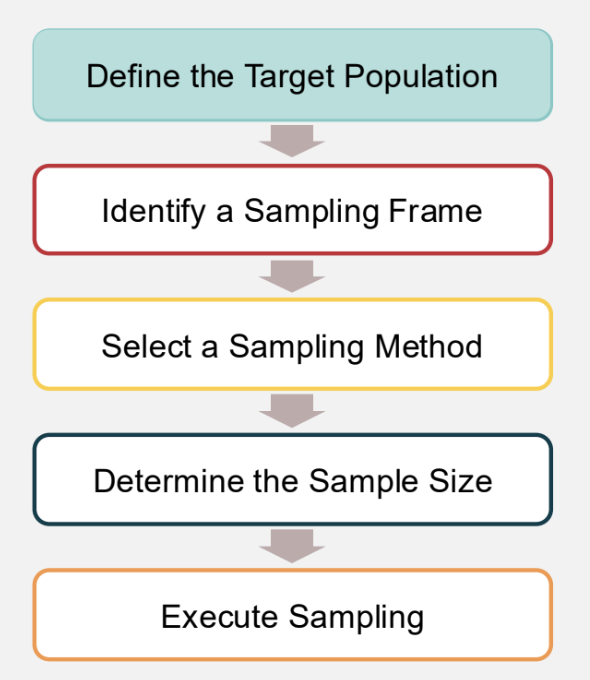
DRAWING AN EFFECTIVE SAMPLE
1. Define the Target Population
2. Identify a Sampling Frame
main idea: ask the right people
use the right way
to the right number of people
Population: total of all the elements sharing the characteristic of interest
Census: collecting data from all members of the population
Sample: subset of observations from the target population
Represents the target population
used to infer characteristics of target population
Sampling Frame: specific list from which the sample is to be drawn
Telephone book
target population: everyone
excluding households without a landline or telephone
Student Email List
Target population: students
excluding no internet access, those who didn’t sign up
Campus Intercept
Target population: students
excludes online students, not everyone is on campus on certain times of days
Sampling Frame Error: occurs when a biased sub-population is used to select a sample
Example: Roosevelt vs Landon. despite 2.27 million responses, they used car registrations and telephone directories (tend to be richer)'
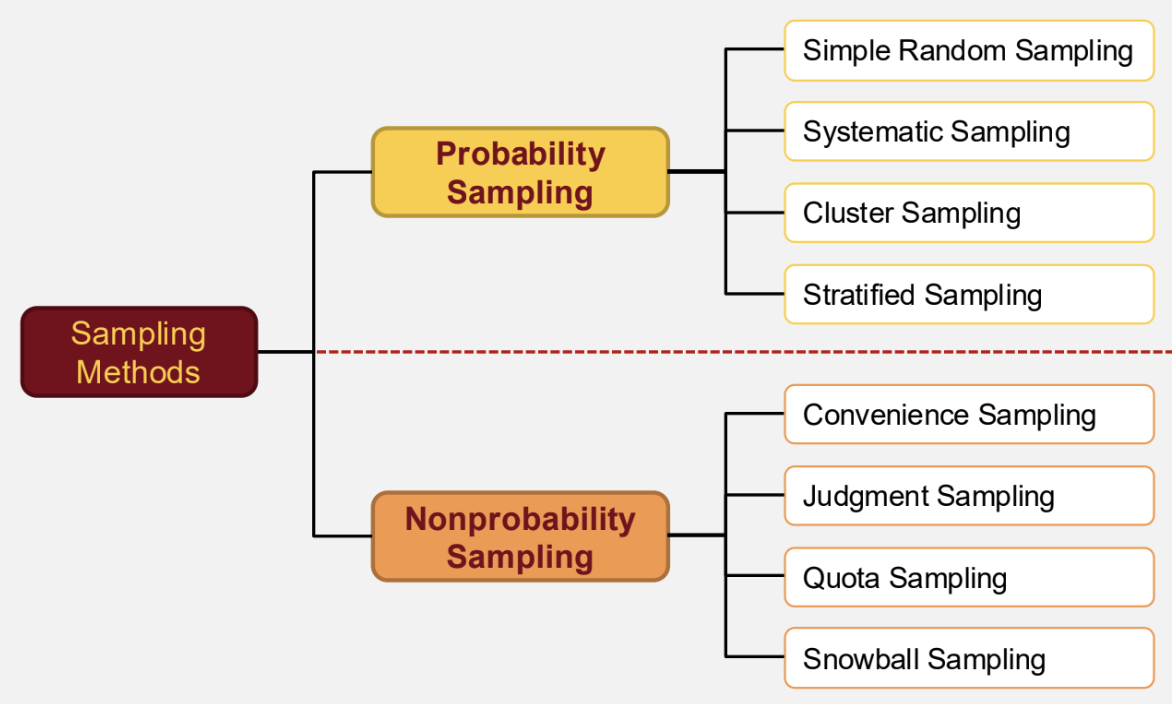
3. Select a Sampling Method
Probability Sampling: randomly drawn, all members of the population have a known and non-zero probability of being included in the sample
simple random - made using a random number, all equal probabilities
systematic - using a skip interval, random starting point, selecting the k-th element in each chosen interval, efficient
cluster - select from a set of divided clusters, randomly select from within the cluster, less costly and more efficient
stratified - choose from subsets that you create based on an important characteristic (ex: marketing and finance, selected from each stratum) less random error than SRS
Proportional stratified - sample reflects the original proportion (60-30-10) split
Disproportional stratified - sample doesn’t reflect original population and is instead equal. use to emphasize the voice of smaller groups
Non-Probability sampling: Members are selected based on certain criteria (non-random). The probability of being included in the sample is not systematically known.
convenience - select people who are easily accessible
judgement - based on researcher’s judgment
quota - made from subsets with certain characteristics, simple to stratified but elements are not selected randomly
snowball - based on referrals from earlier respondents, useful for understanding low incidence or rare population
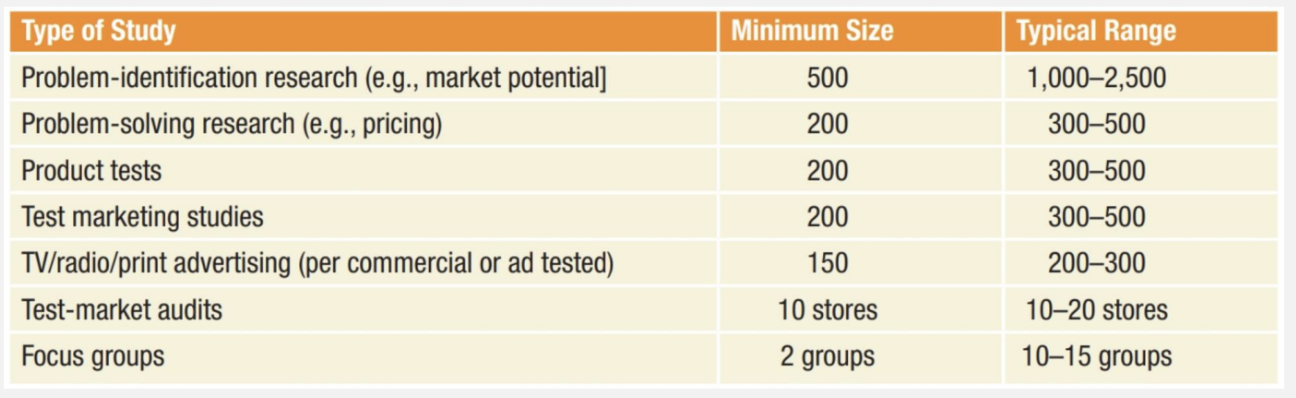
4. Determine a Sample Size
relates to accuracy vs how it represents.
too small - large sampling error
too large - time-consuming and costly
Rule of Thumb: commonly used sample sizes in marketing research
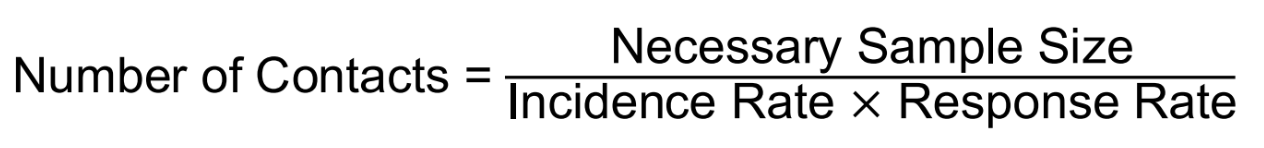
Incidence rate: probability of finding qualified respondents
response rate: probability of qualified respondents completing the survey
Measurement Error: built up of true characteristic and measurement error (random vs systematic)
Random Error: Deviation from the truth because we use a sample. cannot be fully eliminated, but reduced by increasing sample size
Systematic Error: results from mistakes or problems in the questionnaire or flaws in the execution of the sampling. cannot be reduced by increasing sample size
Non-sampling error:
Measurement Instrument Bias: due to poorly design questions
Interviewer Bias: affects responses “do you really think so?”
Response Bias: respondents answer incorrectly
Nonresponse bias: participants differ from non-participants
Sampling design error:
Population specification Error: when research does not correctly choose survey target
Sampling Frame Error: wrong sub-population is used for sample selection
Sample Selection Error: sampling units are selected in a biased way