Oil spills and fish population
effects of oil pollution in fish
direct mortality, especially at egg larval and juvenile stage
sub lethal effects, e.g. reduced fecundity
habitat degradation ( coastal habitats coated with oil)
fisheries closure (human economic impact)
oil effects begin at the individual level then sometimes scale to population, community, ecosystem levels
individual level effect
adult fish rarely die from oil spills as they are able to to detect petroleum at very low concentrations
mainly the egg and larval stages are impacted, due to PAHs, which is the toxic part of the oil
creates deformities within the juveniles and eggs
organism level effects are always detected. Population level effects are not always detected
why are population level effects so hard to detect?
reason 1: population density dependent
if 50% of the larvae die from oit, but normally 90% would die anyway from natural casues, then the population might not change
reason 2: large natural variation
year to year recruitment can fluctuate 20x naturally. This makes it hard to see the oil effects behind the natural noise
reason 3: lagged effects
the population impact may appear years later
reason 4: uncertainty in pristine state
we don’t know the true baseline, so it is hard to compare
recruitment → it is the number of young fish that survive and enter the main population - it’s the transition from babies to contributing members of the stock.
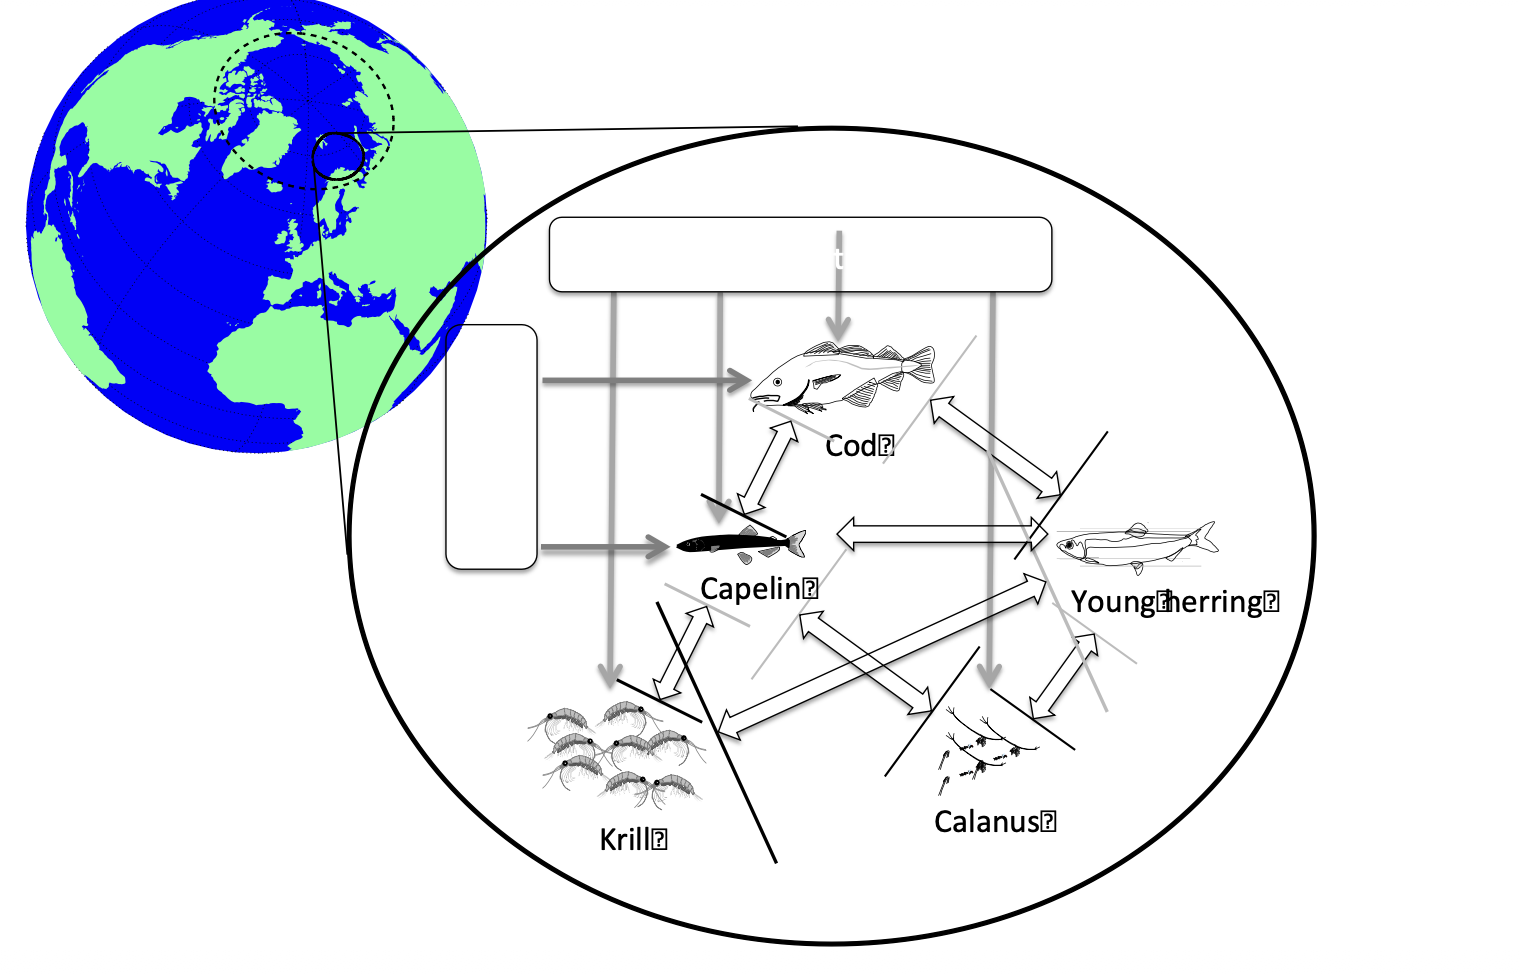
slide 9 - diagram
oil impacts ripple though the life cycle in non linear ways
immediate effects are usually on eggs and larvae
delayed effects are usually seen in the populatoin strucutre, recruitment, and fisheries yield
models
drift models →
these simulate how the water moves, larvae drift, and oil patches move
this tells us where larvae and oil overlap
population models →
these simulate growth, natural mortality, recruitment, fishing, and density dependence
together they let researchers test how many larvae must die for a population to decline
example: atlantic cod
the drift model suggest that up to 50% of the larvae in some years could be killed by an oil spill
the larvae swim vertically in the water column to choose light, food and predator-safe zones
this behaviour influences the patchiness, which affects drift and oil overlap
cod cannibalise on younger cod if capelin (prey) are scarce
so if there is a capelin collapse → more cod cannibalism → fewer larvae survive, even without oil
all of this means, ecosystem interactions affect the oil spill outcomes
“what if” scenarios
strong year class → good recruitment year
weak year class → bad recruiment year
in strong years, even big oil mortality may not crash the population
in weak years, even small oil mortality can have big impacts
timing + year-classs strength + natural variation completely changes the outcomes
population level effects
in the 50% mortality scenario, there is mostly a small decline in biomass
in the 99% mortality scenario, there is a bigger decline, but still variable
population responses are not linear
even 99% larval mortality doesnt always cause a huge declines due to density dependence and natural variation
ecosystem level effects
using the exxon valdez example:
showed a long term ecosystem disruption
delayed population crashes
indirect cascades (predators, prey, competitors)
example: community level ripple effects
if one species experinces a mass mortality event (like larvae dying form oil), the whole food web shifts
predators lose prey, prey release increases, competitors change in abundance
uncertainties in upscaling
how hard is it to predict population outcomes?
how ecological messiness complicates assements
some uncertainties include:
larval drift variability
spawning location variability
prey availability
natural mortality
behaviour
climate effects
spawning stock size structures
large spawners → eggs spread over a wide area, so less overlap with oil
small spawners → eggs concentrated in an area, so they are more vulnerable
heavily fished stocks have younger, smaller spawners, meaning → modern stocks are more vulnerable to oil spills than historical stocks
spatial variation in natural mortality
some areas naturally have:
high mortality
medium mortality
low mortality
if oil hits a high mortality zone, impact is minimal
if oil hits a low mortality zone, impact could be large
vulnerability of different fish species
short lived species (e.g. capelin, herring) are more vulnerable
lare analyses show:
variation across species
variation depending on density dependence
variation depending on natural mortality
Paper - Hjermann et al. (2007)
the paper explores how and when do oil spill actually affect fish population
it explains why population level impacts are inconsistent using the lofoten-barents sea (LBS) system as a case study
eggs and larvae are the most vulnerable
adult fish detect petroleum and avoid contaminated areas; so mortality from oil spills is rare
however, eggs and larvae aren’t able to escape
oil containts PAHs which cause cardiac defects, skeletal deformities, edema, reduced growth, immune supression, mortality
therefore the bottleneck is the early life stage
oceanography determines the oil and larvae overlap
fish larvae drift with the norwegian coastal current (NCC), norwegian atlantic current (NAC), and eddies
oil spills also drift with the same currents.
so if they overlap, there will be large mortality
the oil spill may have less of an effect if they dont overlap
the spawning location changes every year; in the inner fjords, in coastal waters, or further north or south.
so in some years the larvae can either drift through teh oil spills or not
the strength and age structure of the spawning stock matters
in a strong productive year (strong year classes), huge numbers of larvae are produced, natural mortality is lower, population can absorb additional mortality
in a weak reproductive year (weak year class), few larvae are produced, teh natural mortality is high, and oil mortality can break the stock’s recovery
heavily fished stocks tend to have more young fish and fewer large, old spawners, and sometimes smaller fish
larger spawners spawn over a wider area for a longer time, producing larvae with a higher survival potential
heavily fished stocks are more vulnerable to oil spills
natural larval mortality varies enormously year to year, and can vary by location, food availability, and predator abundance
so if oil kills larvae that would have died anyway, there would have been little impact tot he population. this is the opposite for when the oil kills larvae that would have survived
species interactions can modify the oil impacts
so if one species is heavily affected by the oil spill, it can shift the dynamics within the food web
sublethal effects create delayed population impacts
oil can cause chronic physiological stress, reduced growth, changes in behaviour, impaired immune funciton, and reduced reproductive potential
these effects accumulate and may not show up immediately, leading to a reduction in population survival years layer
oil spill impact prediction is so uncertain due to a massive natural variation in survivability, uncertain baseline state, density dependence, and ecological feedbacks
it can be that 50% mortality can have little to no effect on the population level, and in other cases a 10% mortality may have a catastrophic effect
the authors argue that the environmental impact assessment needs to include oceanic drift modelling, spawning stock strucutre, natural mortality patters, food web interactions, long term effects, and uncertain analyses
current assesments ingnore all of these