Experimental Design, Basic Stats, Data Presentation
Study Guide Questions
You should be able to explain/understand/work with the terminology in this lecture.
experimental design: an integral part of reproducible science that links hypothesis to measurable outcomes and determines the validity/interpretability of results.
research question: The first step of experimental design that encapsules the topic of interest and addresses the knowledge gaps that require further investigation.
hypothesis: A directional statement that yields a testable prediction on the basis of prior evidence. It links independent variables to dependent variables.
null hypothesis: An alternative hypothesis that represents no effect or no difference in the context of a specific experiment. It is required for statistical testing.
scientific rationale: The justification behind performing an experiment by explaining why a hypothesis is plausible based on literature and knowledge gaps.
experimental study: A study designed to test cause-and-effect relationships by using controlled conditions and randomization as well as manipulation of the independent variable. This type of study uses control and treatment groups
observational studies: A study designed to identify associations without evident/definitive causation. These studies occur naturally and are not controlled; only observed.
independent variables: A variable that is intentionally manipulated and clearly defined in an experiment.
dependent variables: A variable with a measurable outcome that is quantifiable and directly reflects relation to the hypothesis.
controlled variables: An environmental or procedural variable that is held constant to prevent confounding effects or introduction of variance.
experimental groups: The group assigned a certain test condition which is comparable to the control group that establishes the baseline.
negative controls: A control that functions to detect contamination/background in the experiment. It is essential for assay validation.
positive controls: A control that functions to provide reference against the expected result and confirms the system is working as intended. It is critical for negative results interpretation.
sample size: The assigned number of test subjects included in the study. A larger number will increase statistical power which prompts a power analysis.
randomization: The assignment of random samples to groups to prevent systematic bias.
blinding: A type of study that reduces observer bias and is important in subjective measurements.
resource planning: The consideration of availability and cost for key reagents and equipment that are needed for the experiment.
quantitative data:
qualitative data:
continuous data:
categorical data:
ordinal data:
discrete data:
nominal data:
type I error: A false positive; rejecting a true null hypothesis
type II error: A false negative; failing to detect a true effect
p-value: The probability of observing the data if the null hypothesis is true (usually at 0.05).
effect size: magnitude of difference or relationship and it is independent of p-value
confidence intervals (CI): A range of plausible values for the true effect.
How do you go from a broad research topic to a strong, testable research question?
to go from a broad research topic to strong, testable research question, first you must find a gap in knowledge from some field of interest and narrow down where further research is necessary. The strong research should identify the variables relevant to the study, and it should be clear and specific for what the study aims to investigate.
What distinguishes a hypothesis from a null hypothesis, and how do you link independent and dependent variables?
A null hypothesis is an alternative hypothesis that represents no effect or no difference in the context of a specific experiment. To link independent and dependent variables in hypotheses, you must state the relationship between those variables of interest and reinforce with literature why that statement is plausible. For example, a hypothesis regarding the metabolic rate of birds could state something like: The metabolic rate of ravens decreases in low stress environments.
What are the differences between observational, experimental, comparative, and computational studies?
An observational study is a study that identifies associations without evident/definitive causation and the variables involved cannot be controlled. An experimental study functions to test the cause-and-effect nature of the variables selected for the experiment. It is necessary to keep all control variables the same aside from the dependent variable within the control and experimental groups. A comparative study is a research method that examines two or more variable to determine similarities, differences, and causal relationships. A computational study is a research method that uses computer-based models to analyzes systems and solve scientific inquires and analyze data.
How do you identify independent, dependent, and controlled variables in an experiment?
An independent variable is the variable that is intentionally manipulated for the experiment. It would be any condition that is altered from the control group. For instant, with our experiment Gal3/9 injections were the independent variable for setting up the groups.
A dependent variable is the variable with a measurable outcome that is quantifiable and directly reflects relation to the hypothesis.
Control variables are the variables are intentionally fixed to ensure the only difference between the control group and the experimental group is the independent variable.
What are the roles of negative, positive, and internal/technical controls, and why are they essential?
A negative control functions to detect contamination/background in the experiment. It is essential for assay validation.
A positive control functions as a comparison against any negative values that appear during data collection because it will allow for interpretation of what those negative values mean in the context of the experiment. It is a control that functions to provide reference against the expected result and confirms the system is working as intended.
A technical control is a sample of measurement that is used to verify that the instruments, reagents, and procedures are working as intended and with consistency. It is essential to detecting errors or contamination with the laboratory equipment or the protocol.
What is the difference between biological and technical replicates?
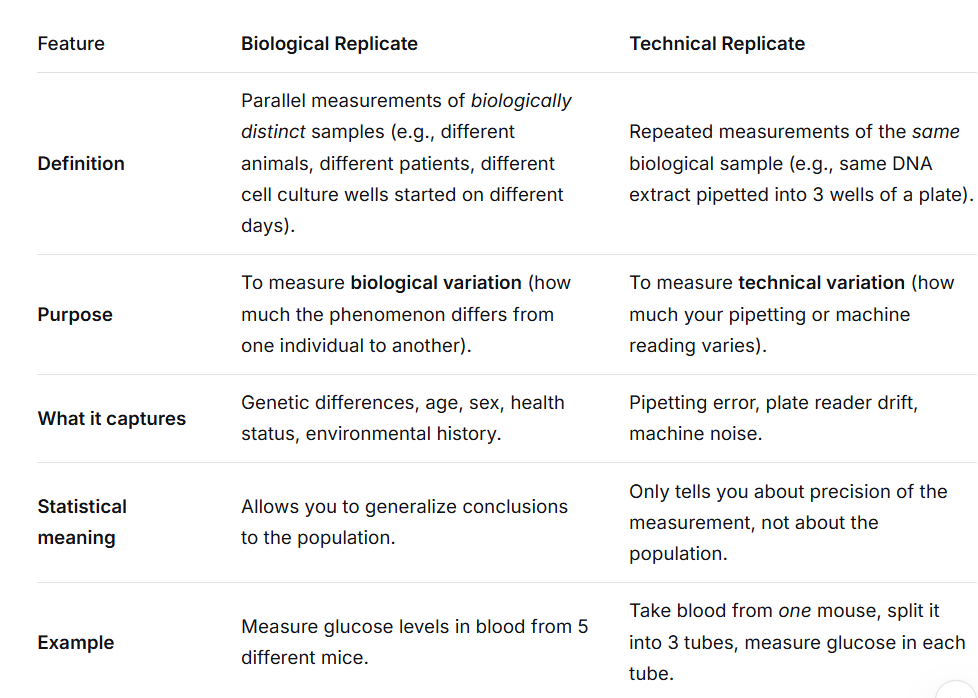
8. How do replicates contribute to statistical power, reliability, and reproducibility?
Biological replicates will help detect biological effects.
Technical replicates will contribute to reliability by ensuring the instrument of use is consistent. Biological replicates will contribute to reliability by ensuring that the results are meaningful across individuals.
Biological replicates will contribute to reproducibility by allowing the findings to generalize due to high biological replication yielding a more accurate estimate of the true effect that can be confirmed. Technical replicates contribute to reproducibility by allowing others to trust that the measurement methods used are stable.
How do you develop a step-by-step experimental workflow, including method selection, timeline planning, and resource allocation?
To develop a step-by-step experimental workflow, first select what a strong research question that has clarity and focuses on the specific subject that you wish to investigate and create a hypothesis that ties in the variables relevant to the study. Then, you can proceed to choose which model works best to answer the question and choose which tests are going to work best to answer that question with the experimental model. From there, you can access how each step required for the experimental model type will fit together in a timeline. In conjunction with step, resource allocation is also crucial for prediction of what reagents or equipment is needed to complete certain parts of the experiment.
How do data type (continuous vs categorical) and measurement choices influence experimental design and statistical analysis?
Data type will impact experimental design by dictating the replication strategy, the power analysis output and which parametric tests are used during statistical analysis. Additionally, measurement choice will influence statistical analysis by shifting the precision depending on the data type and whether absolute or relative units are used.
What are common sources of experimental error, confounding variables, or bias and how do we mitigate these issues?
Common sources of experimental error would be any variance introduced by deviations in the protocol or any expected variance by using certain equipment. Experimental error can be introduced confounding variables by failing to account for any experimental variables that would otherwise skew the results for one or more of the groups. Common sources of bias would be researchers trying to post hoc fish or alter the data/results to fit in their favor (convincing the experimental group in drug trial that their pain is being reduced).
To mitigate these issues, predict areas of variance and take steps to prevent variance, ensure that all variables are accounted for, and reduce any bias by holding each of the researchers accountable.
Predicted Questions
>why is experimental workflow design critical?
Experimental workflow design is important to the end results of the entire experiment because it ensures reproducibility and reinforces the need for good SOPs. By implementing workflow design into your experiment, there is a stabilized idea of the step-by-step process and the timing for when one part should end or the next part ends.
>consider the myeloma cells. why must we select a cell line that is HRPGT- and does not produce mycoplasmas?
The parental myeloma cell line must have a non-functional HRPGT gene because when placed in HAT media, those cells would not be able to grow and
>for our experiment, we have two models: a mouse model and a cell line model. for our purposes, why would the incorporation of two models provide reliable results? How does the use of these models match the biological question proposed by this experiment?
We use BLAC6 mice and Sp0/2-Ag14 parental family myeloma cell lines because our experiment involves the fusion of splenic B cells from the mice and an immortal cell line. These cells will become expanded and screened to generate a hybridoma that has high affinity towards our targets of interest. Using these models allows us to integrate the question we asked by utilizing the
>illustrate a timeline with estimated realistic durations for:
- myeloma cell culture
- preparation / acquiring B cells
- hybridoma fusion
- hybridoma selection
>why is it important to implement efficient statistical analysis planning?
It is important to ensure that statistical analysis planning is accounted for in an experiment because it allows the person who is running the experiment to connect why certain tests are necessary and crucial when others are not. It also ensures that the person avoids post hoc fishing and that the initial design of the experiment is answering the question that was asked.
>why should you choose an appropriate figure when presenting data to an audience?
An appropriate figure must be selected when it comes to visualizing data to ensure the data are not telling a story to supporting original claims (bias), to avoid misleading interpretations, and to have the data remain transparent about the findings.
>what are some common pitfalls that may result in any experiment?
Technical limitations, biological variability, confounding variables, and reproducibility changes/effects.