One-Sample t-test & Paired-Samples t-test
Definition (#f7aeae)
Important (#edcae9)
Extra (#fffe9d)
Introduction to t-test: 3*
Involves comparison of 2 “groups” or “conditions” or “levels” (IV).
Whether differences between the groups/levels are significant or not.
DV must be a continuous variable.
3 types:
One-sample t-test
Independent-samples t-test
Paired-samples t-test
One-sample t-test:
Overview: 3*
Used to compare the sample mean to a known or hypothesized population mean.
Tests whether the sample mean is significantly different from the population mean.
Only one group of participants is involved.
Ex: Is the average score of our class different from the national average?
When to use one-sample t-test: 3*
You have only 1 group of participants.
You want to compare their mean score to a fixed value.
The fixed value must be known and meaningful for comparison.
Used in descriptive and applied research.
Useful when evaluating if a group differs from a set standard or benchmark.
Assumptions: 3*
The DV is measured on an interval or ratio scale.
The data should be approximately normally distributed.
The observations are independent (each participant's score is not influenced by others).
The population mean used for comparison must be known.
Analyse:
Analyze → Compare Means → One Sample T-test.Put variable of interest in “test variable”.Under “test value” → Put the fixed value → Click “OK”.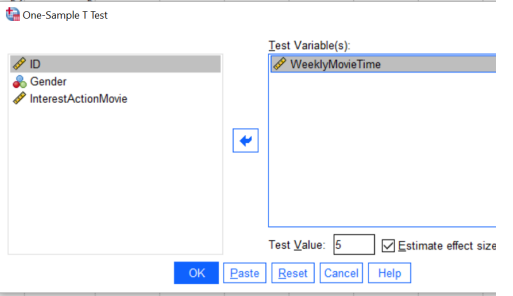
Paired-sample t-test:
Overview: 3*
Used to compare the means of two related measurements from the same group.
Tests whether there is a significant difference before and after an intervention.
Also known as dependent-samples t-test or repeated-measures t-test.
Each participant provides 2 scores (pre-test and post-test).
Ex: Comparing anxiety levels before and after therapy in the same participants.
When to use paired-sample t-test: 3*
You have 1 group measured at 2 different times or under 2 different conditions.
Used in within-subjects design.
Common in experiments measuring change (training effectiveness, mood changes).
Useful when comparing matched pairs (twins, partners, or case-control studies).
Minimum number of participants is recommended to be 20 or more for reliability.
Assumptions: 3*
The DV is measured on an interval or ratio scale.
The differences between the 2 scores should be approximately normally distributed.
The pairs of observations are dependent.
Each pair is independent of the other pairs.
Analysis:
Analyze → Compare Means→ Paired-Samples T-Test.Put the first level/condition in “variable 1”Put the second condition / level in “variable 2” → Click “OK”.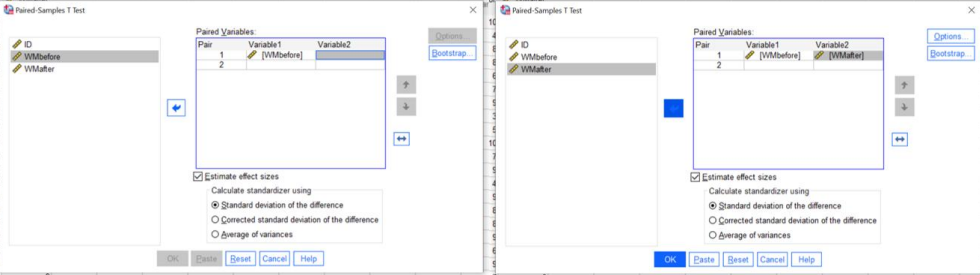
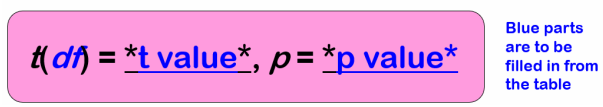
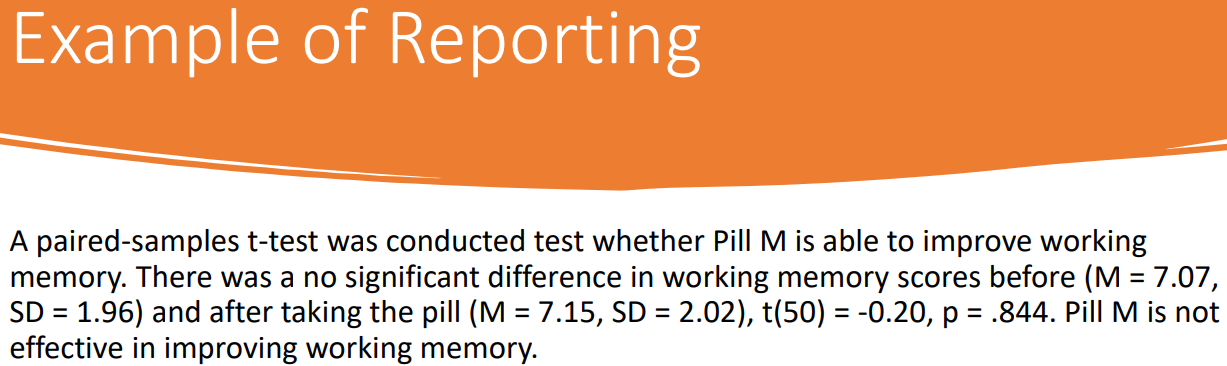
Template:
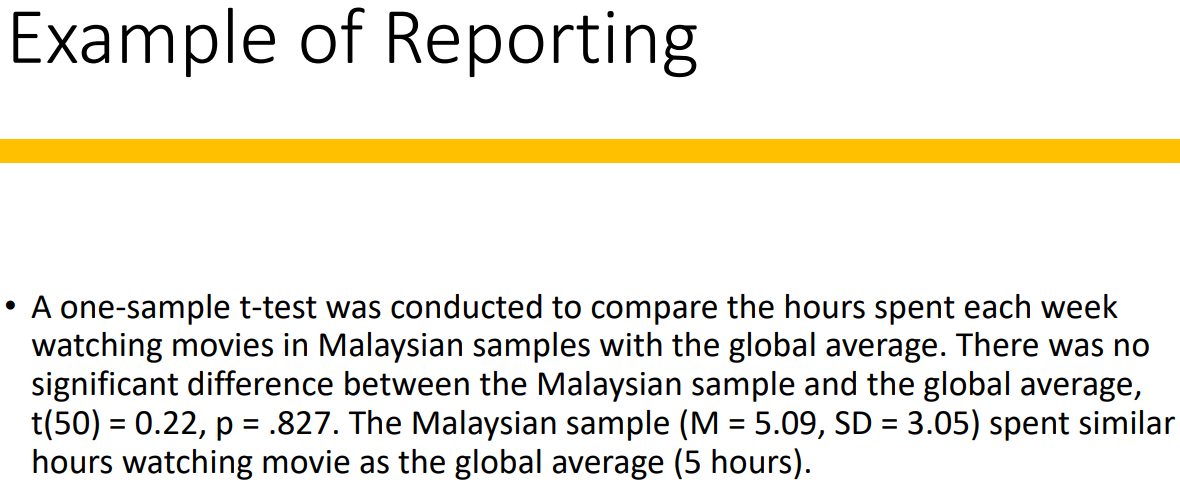
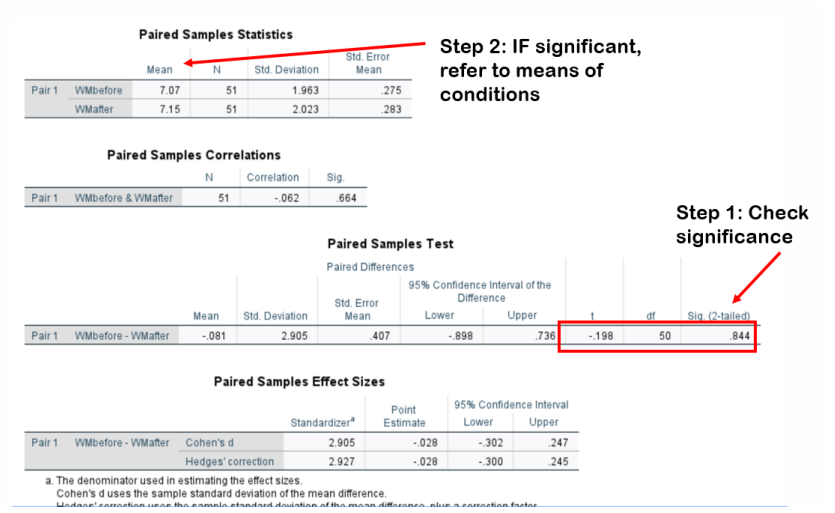
What test you ran and what variables were plugged in.Is there a significant difference between group.Report the “equation” above with the values.Interpretation:If significant:Which group scored higher and lower.If not significant:Groups had similar scores.