18 - IS-MP Analysis, Interest Rates and Output
Aggregate Expenditure
Aggregate Expenditure and Short Run Fluctuations
in the short run, changes in demand drive changes in outputs
can forecast SR fluctuations by predicting demand
aggregate expenditures describes everyone’s spending plans
analysis of business cycles starts by focusing on the demand side of the economy
aggregate expenditure = consumption + planned investment + government purchases + net exports
focus on planned investment — spending on new capital without inventory change — since we want how much people but and not unsold things accumulating
output adjusts to meet aggregate expenditure
when the total quantity of output exceeds aggregate expenditure businesses cut production and vice versa
macroeconomic EQ occurs when quantity output buyers collectively want to purchase equals to the quantity suppliers collectively produce
aggregate expenditure = GDP
in SR (year to years ups and down in business cycle ) demand conditions determines output
The Demand Driven Short Run and the Supply Driven Long Run
in LR, focus on the available supply of labour, capital, human capital, production function that summarizes state of technological progress
analysis explains economy’s potential output (uses all resources, sustainable)
in the SR GDP might not meet potential
economic slump can be an EQ bc businesses don’t want to make output that people won’t but and people won’t want to spend more since the economy is weak
when actual GDP exceeds potential, the economy will overheat, to keep up producers defer maintenance, run more shifts, pay overtime — not sustainable
output gap focuses on the balance between demand and supply side factors
output gap = (actual - potential)/potential * 100
supply side of the economy (labour, human and phyical capital, tech) grows smoothly over time so potential GDP grows smoothly over time
actual GDP moves in fits and starts, demand factors make it deviate substantially
EQ GDP is not potential GDP, it’s just where the economy rests where buying and producing is equal while potential is the highest sustainable level of production
The IS Curve: Output and Real Interest Rate
real interest rate represents the opportunity cost of spending (earning interest or buying more)
the higher r is, the more stuff you can buy if you wait till next year
it is the nominal interest rate adjusted for inflation which determines the year’s aggregate expenditure
policy makers use it to influence the economy, increasing it (and OC) to to reduce spending or reducing to increase spending
Aggregate Expenditure and Interest Rates
lower interest rates boosts consumption since there is a lower OC to buying (vs saving) and you have to pay back less on loans
the only group that reduces consumption is people who rely on interest payments for income (not a lot of people)
lower interest rates boosts investment for the same reasons (OC and actual cost)
lower interest rates boost government purchases
reduce cost of interest payments (transfer from government to who they borrow from) on government debt but doesn’t directly affect aggregate expenditute
low interest means there is more money in the budget to spend on other projects leading to an increase in purchases
not always true since extra funds sometimes used to pay debt
lower interest rates boosts net exports
makes the CA dollar cheaper which increases net exports
it takes fewer other currencies to buy a CA dollar so exports increase since CA stuff sells for fewer of other currencies than it did before (price cut)
cheaper CAD means it takes more money to buy imports from other countries so it decreases
IS Curve Links Real Interest Rate and the Output Gap
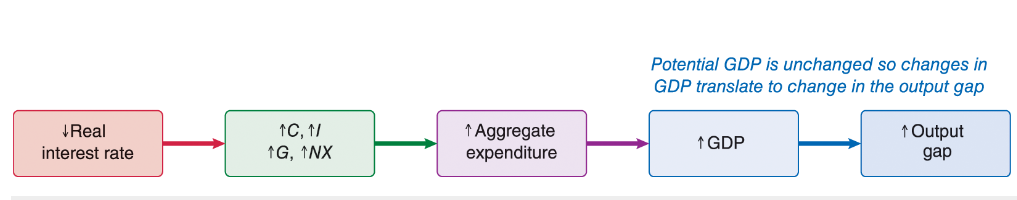
decrease in real interest leads to an increase in every component of aggregate expenditure
boost in investment is the most important since machinery and housing is very sensitive to the interest rate
lower interest rates boost aggregate expenditure
a rise in aggregate expenditure is matched by a rise in production and therefore GDP
potential output is determined by long run factors unaffected by business cycle changes
since it is unchanged, interest rate induced increase in output also increases output relative to potential output
more positive output gap
IS curve illustrates the link between interest rates, GDP, output gap
lowered interest leads to higher real GDP which leads to a more positive output gap
construct the economy’s IS curve by adding up the level of aggregate expenditure at each real interest rate
output adjusts to level of aggregate expenditure, this also reveals the GDP
just need to compare GDP to potential to calculate output gap at different real interest rates
IS curve (output on x, interest on y) is similar to demand in showing this year’s demand for all levels of output
also downwards sloping
lower real interest decr OC of making purchases thsi yr leading to more consumption
curve can be a straight line
Using IS Curve
change in the real interest rate leads to a movement along a fixed IS curve
curve is meant to illustrate how gap changes with interest so changing interest moves along the curve
changes in other factors will lead to the curve shifting
The MP Curve: What Determines Interest Rate
Bank of Canada
8 times a year the governing council of the bank of CA meets to decide what to set the interest rate at
when the bank sets interest rates to influence economic policy, it is called monetary policy
sets nominal interest to influence the real interest
bank sets the nominal interest rate and knows inflation, therefore setting real interest
nominal - inflation = real
decisions effect the who economy
bank sets the policy interest rate which is the target for the overnight rate on a set of loans almost certain to be repaid the next day
loans are close to 0 risk so this can be thought as the risk-free interest rate
changes in the risk-free rate affect the interest rate you’re paid on savings and borrow money on
Risk Premium
the interest rate on a loan reflects the risk free rate plus a risk premium
banks and other lenders are paid for taking on risk
risk premium is the extra interest charged
real interest for borrowers = risk free rate + risk premium
risk premium is determined in financial markets
buying and selling complicated financial contracts allows big banks/financial institutions to reallocate risk in portfolios including what borrowers owe
risk premium is the price at which financial institutions are willing to bear the risk associated with lending you money, determined by supply and demand
MP Curve
MP stands for monetary policy which demonstrates the real interest rates and how changes in risk premium affect real interest
you can measure the risk premium using interest rate spreads
calculate the difference between the interest rate at which you borrow and the risk free interest rate (for loans of the same duration)
difference is the interest rate spread, an estimate of the risk premium
can use the interest rate for loans to the government since it is practically risk free
risk spread is normally low and stable but it will spike during a major financial crisis which corresponds in a rise in risk premium
MP curve is just a horizontal line because the bank just announces where it wants to set the interest rate and the curve reflects that plus the interest rate
IS-MP Framework
IS curve is how output gap depends on real interest rate
MP curve tells you what the real interest rate is
IS-MP Equilibrium
intersection determines the macroeconomic EQ, the level of output gap consistent with the real interest rate
Fluctuating Demand and Business Cycles
aggregate expenditure plays a central role in determining the macroeconomic EQ
can understand recessions and depressions as weak/declining aggregate expenditure
booms and busts of the business cycle reflect economy shifting between strong and weak demand
strong aggregate expenditure leads to a booming economy and full employment
when people are optimistic of the future, they will spend more money at any given interest rates
leads to an EQ with an output gap of 0 and GDP is sustainable and high
unemployment is low
economic outlook is good enough that people continue believing things will be good, EQ at good times
insufficient spending can lead to a slump and unemployment
decrease in aggregate expenditure at any given real interest rate and level of income due to pessimism leads to the IS curve shifting left
changes in aggregate expenditures create macroeconomic fluctuations
similar booms and busts occur in response to any factor that causes aggregate expenditure to shift at a given interest rate
recessions can be individually rational and collectively terrible
economic slumps create a macroeconomic EQ where economy produces less than potential and if nothing changes, prolonged recession will follow
once in a bad EQ, there isn’t a reason for buyers or sellers to change their plans because they are worried about a recession
Analyzing Monetary Policy
monetary policy shifts the MP curve
cutting the interest rate shigts the MP curve down leading to a new EQ with a higher GDP at a lower interest rate
they run out of steam once interest rates are brought down to 1%
cutting it to 0 would lead to no incentive to loan money vs storing it in a safe so it would have little to no effect
Analyzing Fiscal Policy an the Multiplier
fiscal policy is the government influencing the economy by adjusting its spending and tax policies
adjusting policy shits the IS curve
expansionary fiscal policy boosts aggregate expenditure, shifting IS to the right
shift by a change in government expenditures * multiplier
multiplier measures how much GDP changes as a result of direct and indirect effects from each extra dollar of spending
Macroeconomic Shocks
Spending Shocks that Shift the IS Curve
increased spending at any given real interest rate and level of income shifts the curve to the right
change in consumption * multiplier
consumption increases when people feel more prosperous — having more money to spend or believing they will soon have more money
stock market booms, housing prices — asset holders have more wealth
consumer confidence rise
government cuts taxes or increases assistance payments
redistributing income from those with higher incomes to lower incomes (transfer payments and tax system changes) increases consumption
investments increase when it’s profitable for the business to expand — believing new machinery investment will be profitable to expand
expanding economy so there is demand for products and need more capital equipment
high business confidence since capital investments are ling term so new equipment is bought depending on future profit expectations
lower corporate taxes increase after tax profits
investment rises with targeted investment tax credits that reduce the after tax cost of buying new equipment
lending standards and cash reserves, if it’s hard to borrow money at a reasonable rate, the best alternative is to invest in new equipment if your company has the cash on hand to do so
investment increases when loans are easier to get or businesses have large cash reserves (important if financial system isn’t working well)
uncertainty on economic outlook decreases investment
government purchases increase when fiscal policy expands economy
fiscal policy used to stimulate economy
government programs called automatic stabilizers automatically increase spending when economy is weak
outlets only directly increase aggregate expenditure and shift IS when it purchases g/s
programs simply transfer money from government accounts to recipient’s account so doesn’t directly increase sending, could indirectly increase by fiving money to people likely to spend it
net exports increase due to global factors
global economic growth so other economies have more money to spend and buy more products
exchange rate when CA becomes cheaper so CA goods become cheaper to foreign buyers so they buy more exports while imports fall
trade barriers are low so CA businesses have an easier time selling goods in foreign markets but it also increases imports so the net effect is unclear
Financial Shocks that Shift the MP Curve
changes in monetary policy with higher benchmark interest shifting real interest and the MP curve up
longer term interest rates are partially based on the current short-term interest rate and partially on expectations of future interest rates
banks will influence expectations, a signal that interest will rise is often enough to increase LT rate to shift MP curve up
financial market risks shift the risk premium, rise in risk premium shifts up real interest and the MP curve
default risk is increased risk borrowers will default and not repay loans at all or on time
liquidity risk is how banks can get cash by selling some of their loans to other lenders and occurs when there aren’t buyers or people willing to pay a reasonable price
interest rate risk is how interest rate offered today might be bad is future interest rates or inflation are unexpectedly higher, increasing uncertainty about future interest or inflation increases risk
risk aversion is lenders becoming more reluctant to take on risk, only willing at higher risk premiums