AP Macroeconomics -Unit 1
Unit 1 Basic Economic Terms
1.1 Scarcity
Scarcity
Without scarcity, there would not be any economics
Scarcity refers to the limited availability of resources, which contrasts with the seemingly unlimited wants of individuals and society.
Scarcity necessitates the need for prioritization and informed decision-making in resource allocation.
Free resources refer to an abundant resource that can support the needs of every person in the area. An example is oxygen on Earth.
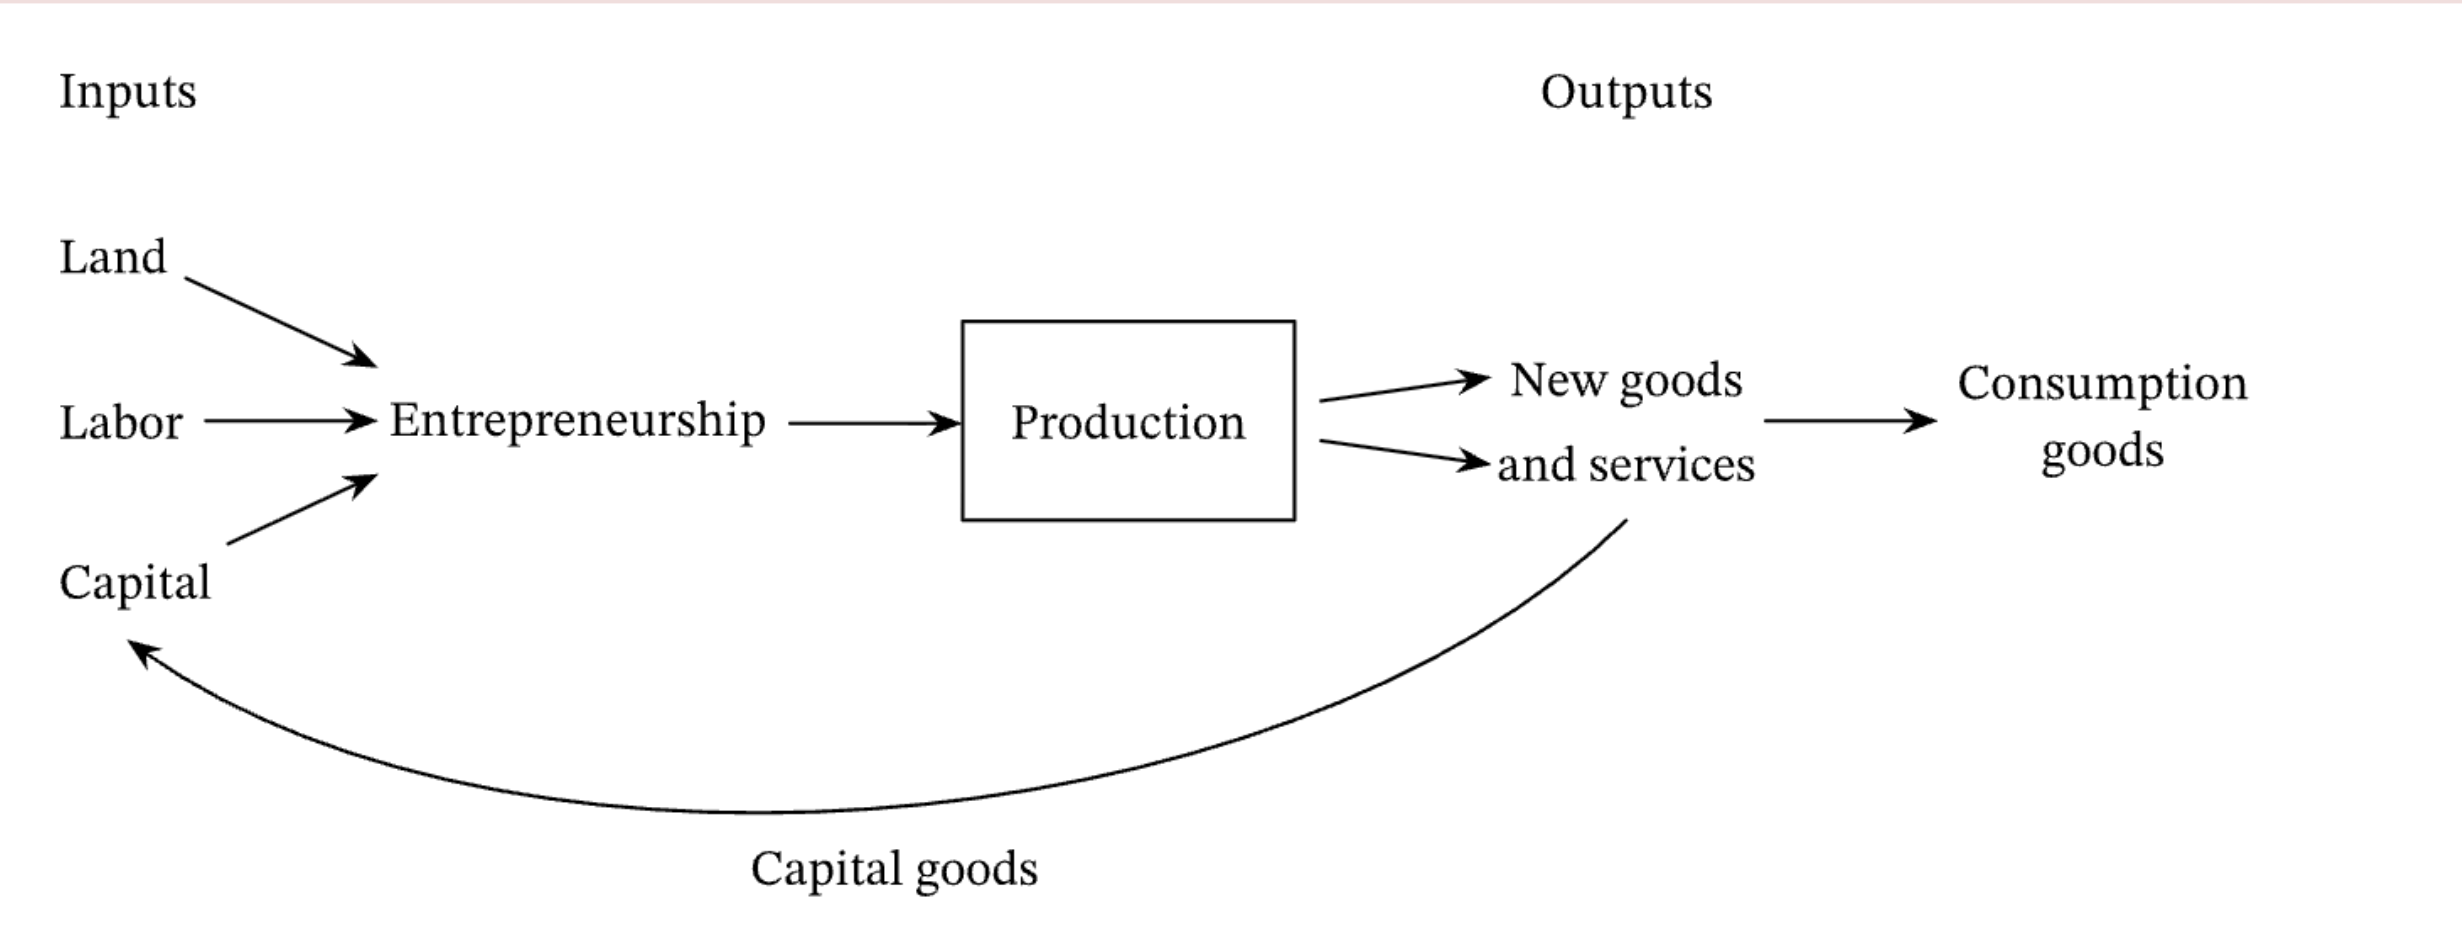
Factors of Production
The four factors of production are Labour, Land, Capital and Entrepreneurship
Land refers to the location where goods are produced or where natural resources are found.
Labour is the work that is being done to manufacture the products
Capital is the equipment or machinery used (not money)
Entrepreneurship would be the ideas and the organization of the production
The factors of production create consumption goods or capital
The capital would be the tools that other manufacturers would use
The consumption goods are used by everyday people, such as snack products.
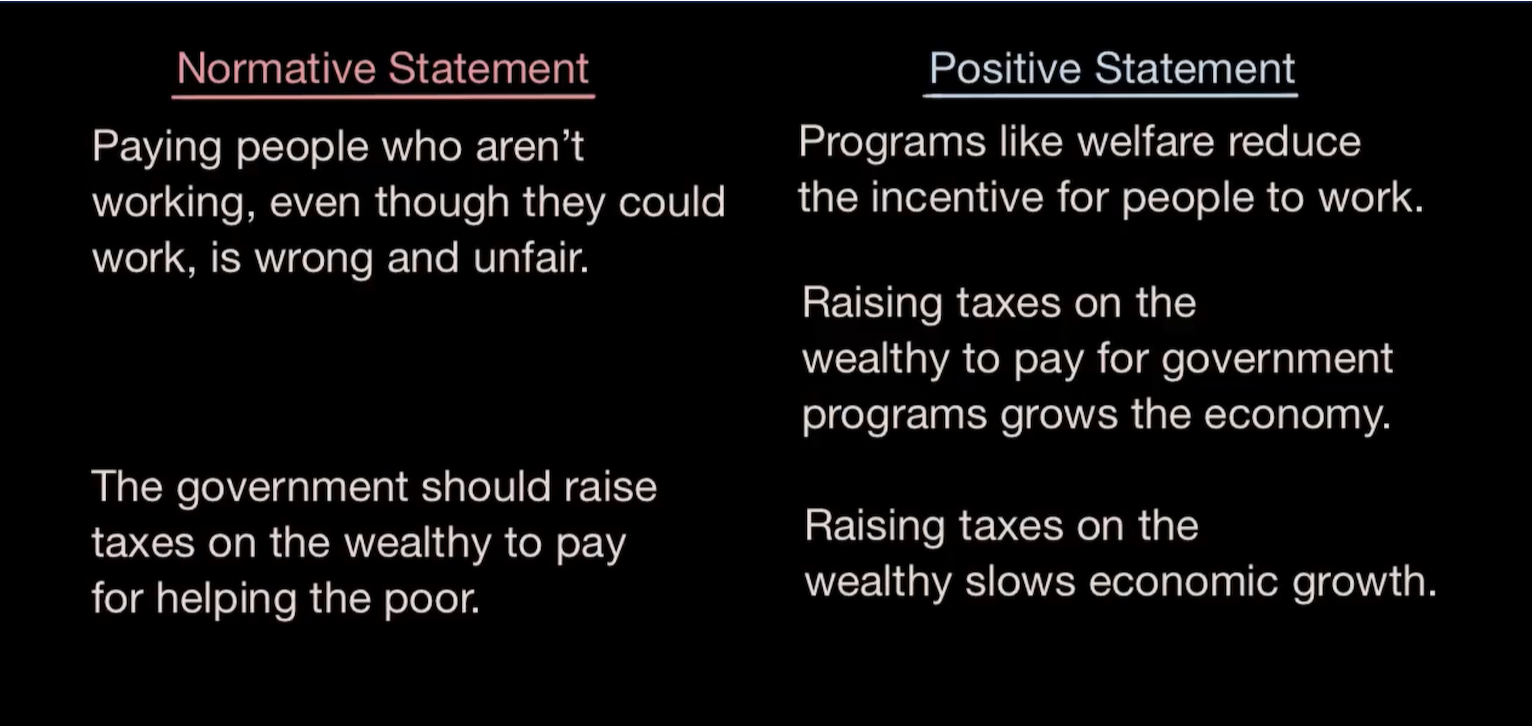
Normative vs Positive Statements
Normative statements are based on ethics or opinions that a person might have on economics, but cannot be tested.
Positive statements are ideas that do not necessarily need to be true but can be tested.
Economic Models
Economic models are a way of breaking up complex real-world problems into their most important characteristics.
The action of breaking down the problems by their most important characteristics is referred to as simplifying assumptions
Economic models will not always be 100% because they are based on the assumption that everything would be the same.
One example of an economic model is the production possibility frontier, where you are only trading off two things and everything else is equal, which is called Ceteris Paribus.
The Main idea of scarcity
All these concepts are connected through the idea of scarcity, which forces individuals and societies to make choices about how to use limited factors of production. Economic models help simplify and analyze these choices, while positive and normative statements guide how we understand and evaluate them.
Key questions:
Q: What is the difference between microeconomics and macroeconomics?
A: Microeconomics is about individuals, households and firms; Macroeconomics is about economies as a whole.
Q: What is the best definition of an economic system?
A: A mechanism that decides what to make, how to make it and who gets it.
Q: What is the best definition of a scarce resource
A: There is a demand for that resource and a limited supply.
Q: What are the four scarce resources that any economic system must allocate between society’s competing wants and needs
A: They are the four factors of production (Land, Labour, Capital and Entrepreneurship)
Q: What is the best definition of economics
A: The study of how society’s scarce resources are allocated
1.2 Opportunity Cost and the Production Possibilities Curve
Production possibilities curve
The production possibilities curve is a way of demonstrating how an economy can produce two goods, showing the trade-offs and limits due to scarcity.
Example:
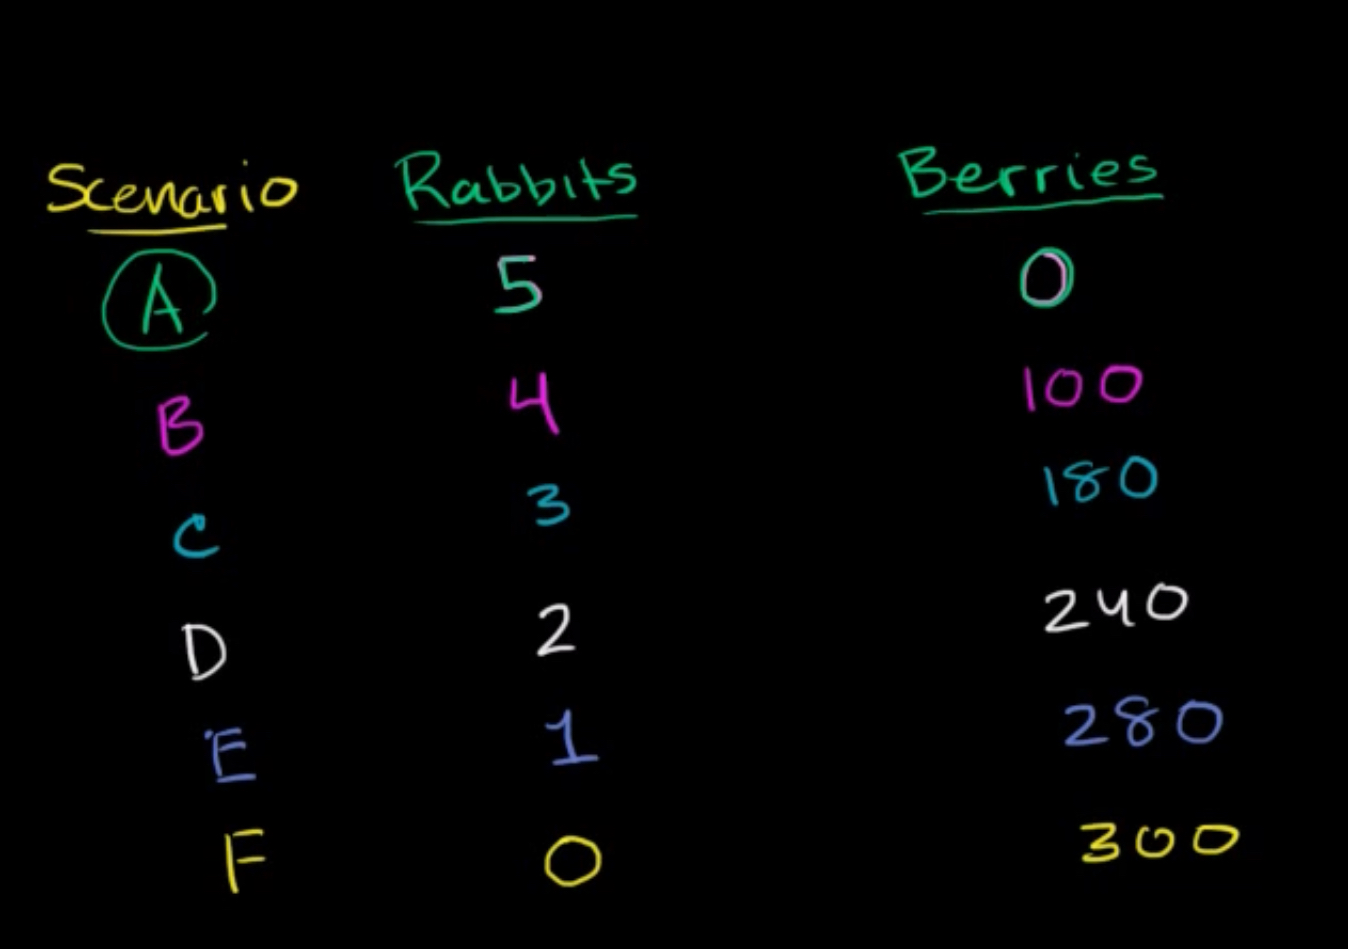
You are a hunter and you like to gather berries and rabbits.
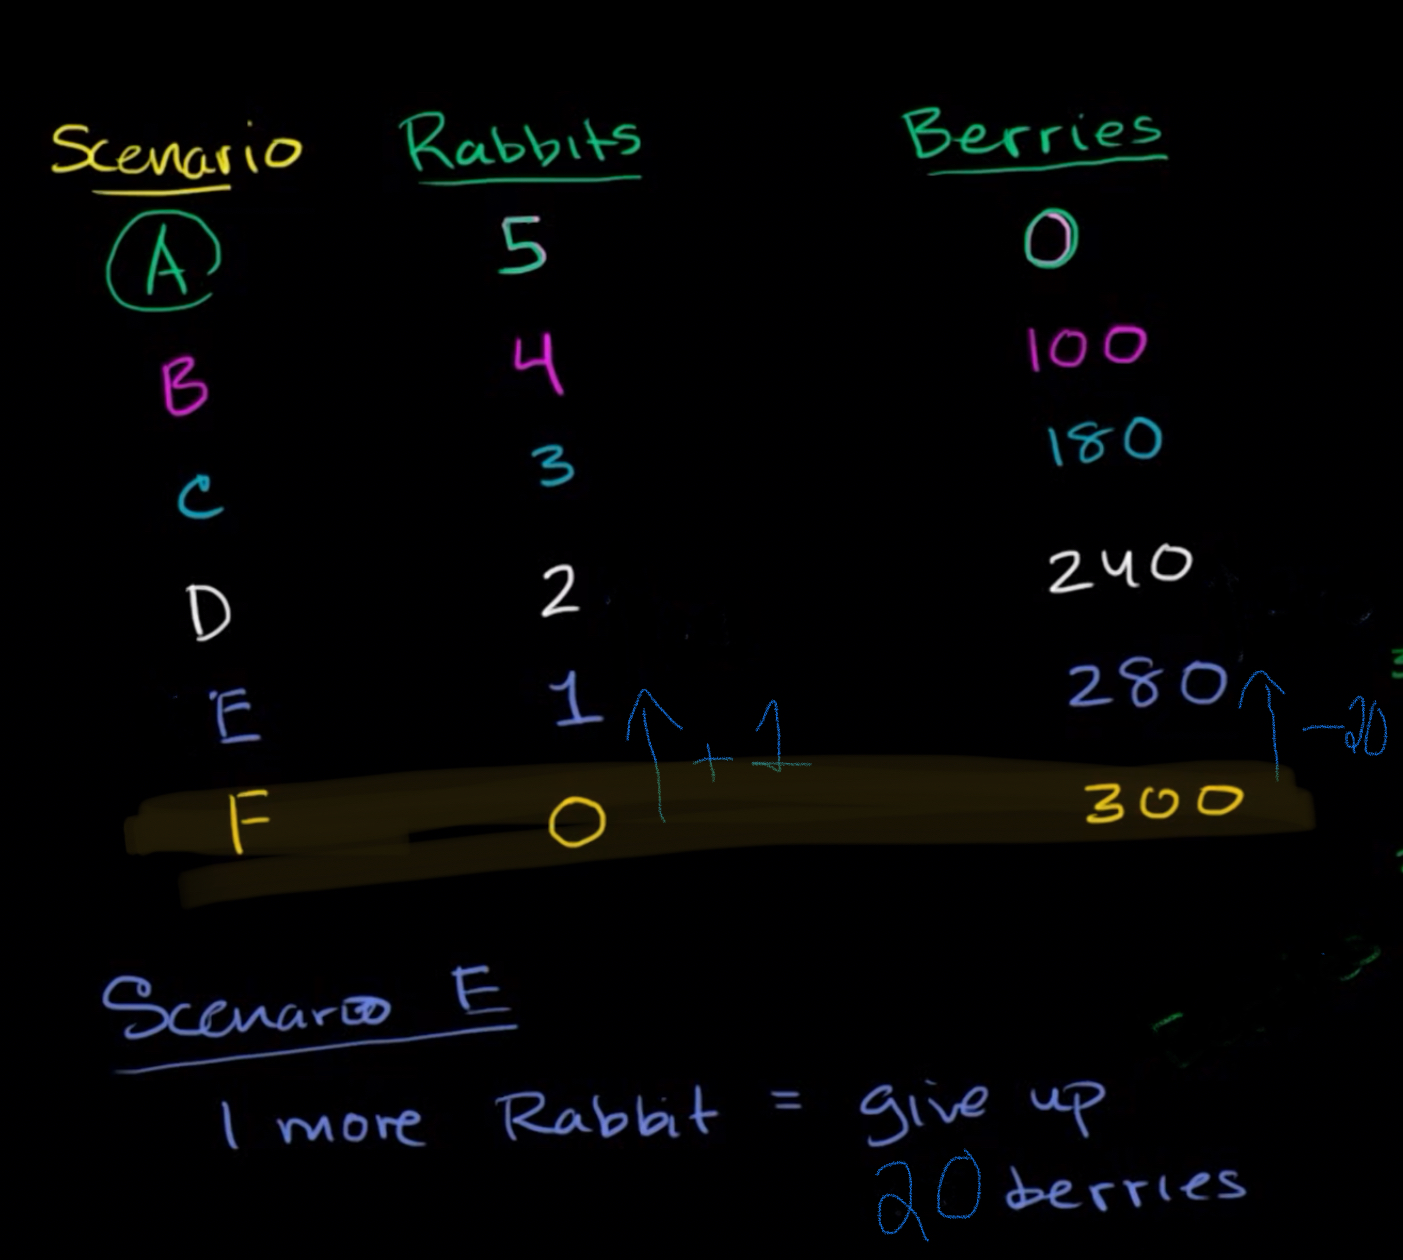
Imagine you are a hunter and you can gather either rabbits or berries in a day. Here are different combinations of what you can produce:
If you spend all your time hunting, you can catch 5 rabbits and 0 berries.
If you shift some time to gathering, you might catch 4 rabbits and get 100 berries.
If you focus entirely on gathering, you could get 300 berries and 0 rabbits.
Now you lay this information out on a graph to create the production possibilities curve as a way to estimate how many rabbits or berries you can get at different times.
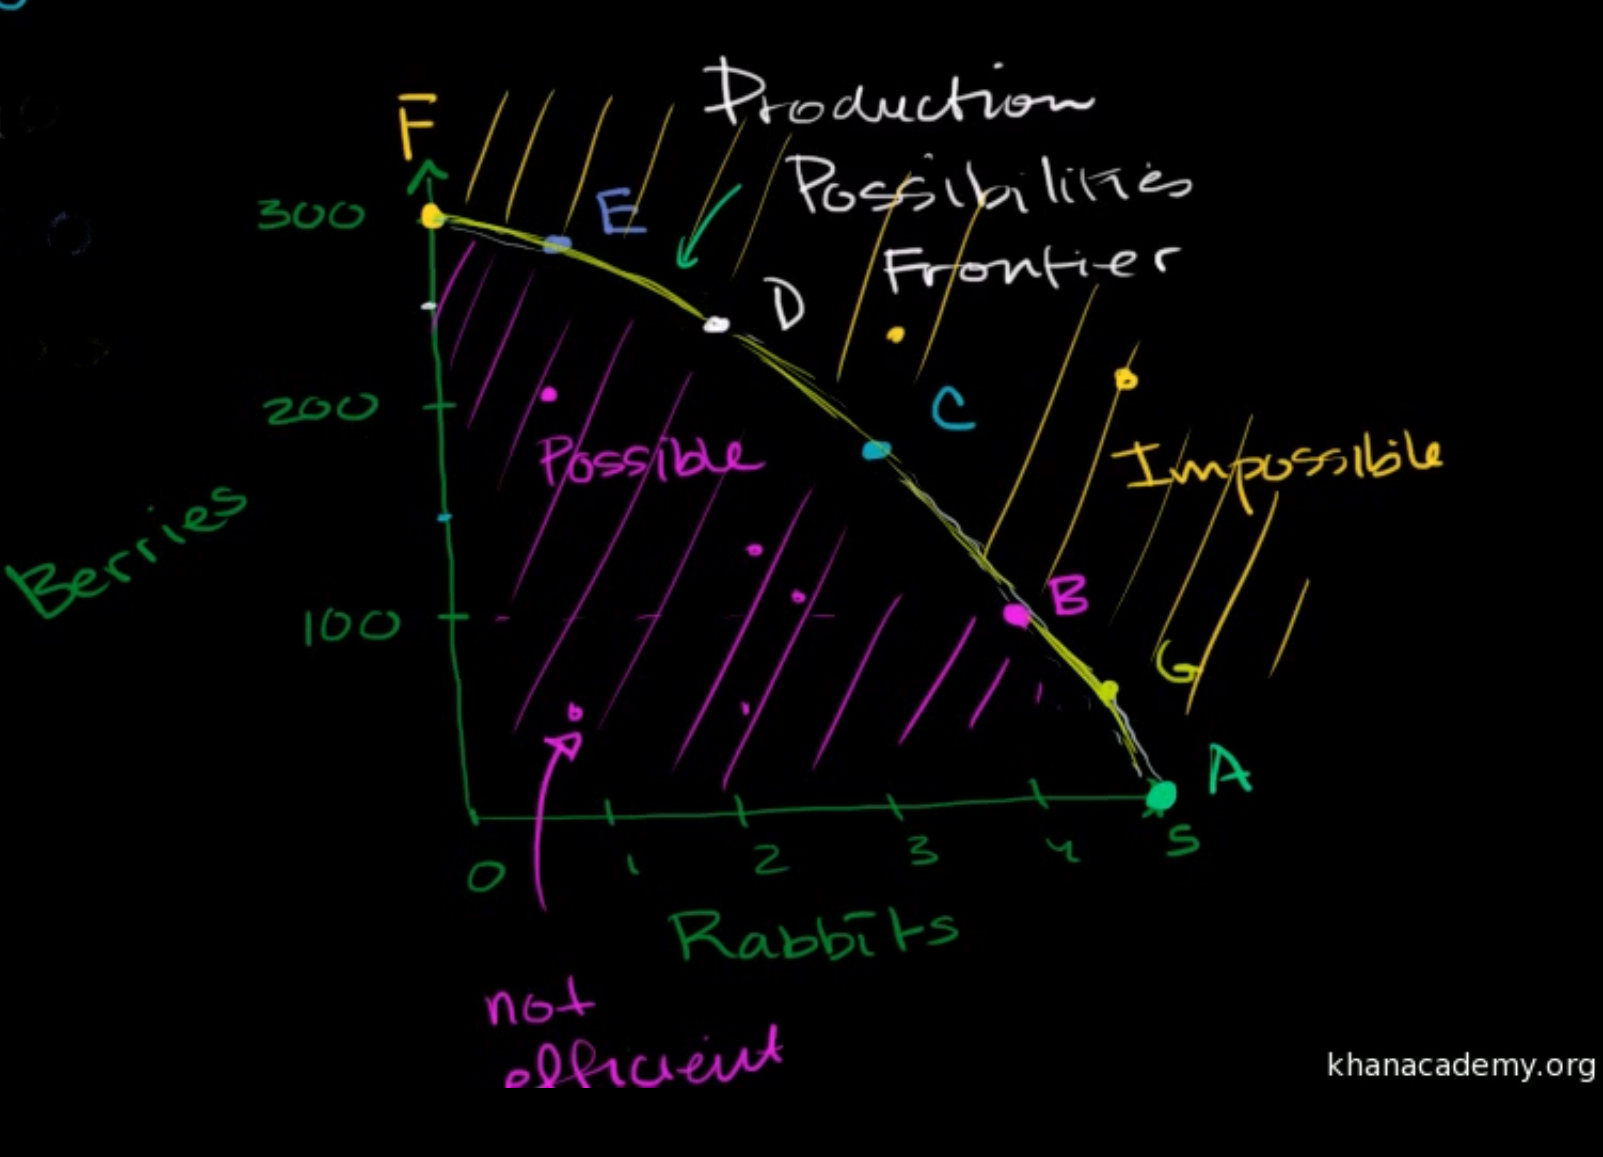
The curve created is known as the Production Possibilities Frontier (PPF). Any point on the curve represents an efficient use of all available resources. Points outside the curve are currently impossible to achieve, given the existing resources and technology (assuming Ceteris Paribus
All other things are equal, meaning resources and technology are fixed. Points inside the curve are possible, but indicate that resources are being used inefficiently or are underutilized.
Opportunity Cost
Opportunity cost is the trade-off that one makes when deciding between two options. In the example of the hunter, if you are currently in Scenario F, where you have decided to spend all of your time picking berries and not catching rabbits, but now want more rabbits, you will have to calculate your marginal cost.
So you would add one rabbit while decreasing the amount of berries by 20 (which is the marginal cost)
You would write this calculation as: Opportunity cost of 1 more rabbit is 20 berries.
Increasing, Decreasing and Constant Opportunity Cost
Let’s say you are in scenario F still, and you are only going after berries, although because you keep picking berries, it becomes harder to find them, and you might need to hike further or go into spiky bushes.
While you are doing this, there is a rabbit that is right next to you and is an extremely easy-to-catch target and would take less time to hunt than picking 20 more berries. This means that it is a better choice to increase your opportunity cost by switching to scenario E. Here, you only lose hard to get 20 berries while still getting one rabbit.
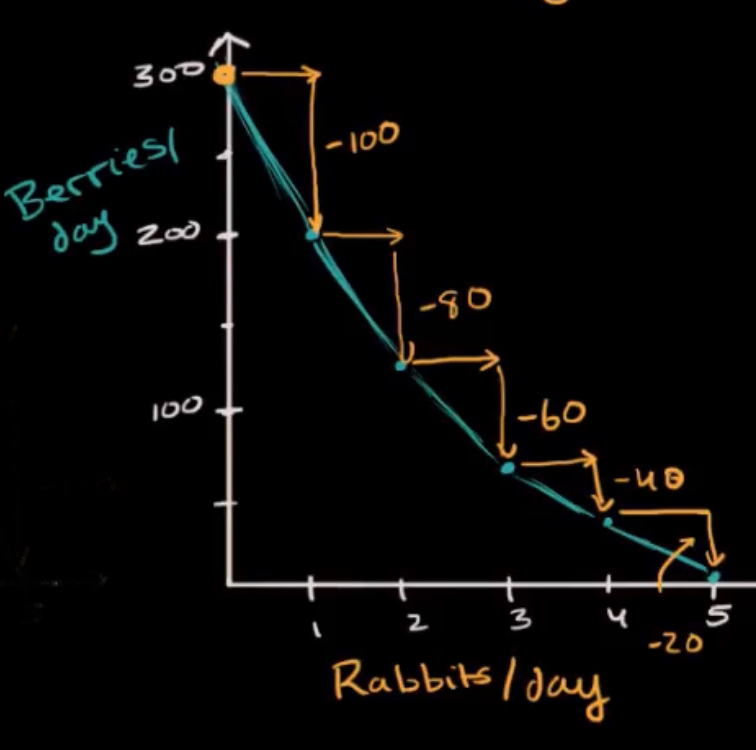
Although now you see two rabbits farther away and you decide to hunt them, this will take more time, and you will have to sacrifice another 40 berries in scenario D, and so on, until you are trying to find 5 hard-to-get rabbits and are not finding any easy-to-get berries.
*When you see a bow curve, you know that you are increasing your opportunity cost.
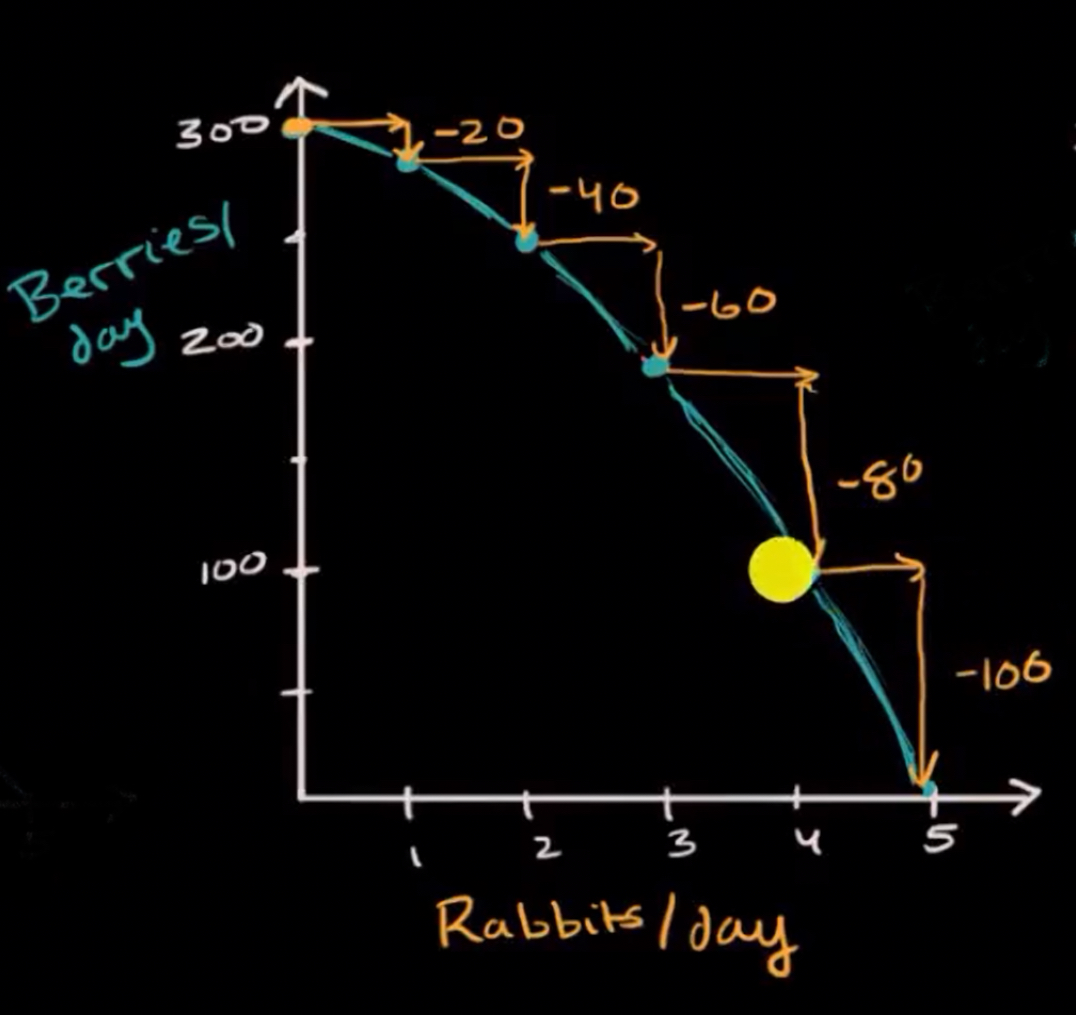
Although in the same scenario, you start to become very good at catching rabbits, which means that you are not losing as many berries in the process. This means you are now decreasing your opportunity cost.
* When you see an inverted bow curve, you know that you are decreasing your opportunity cost.
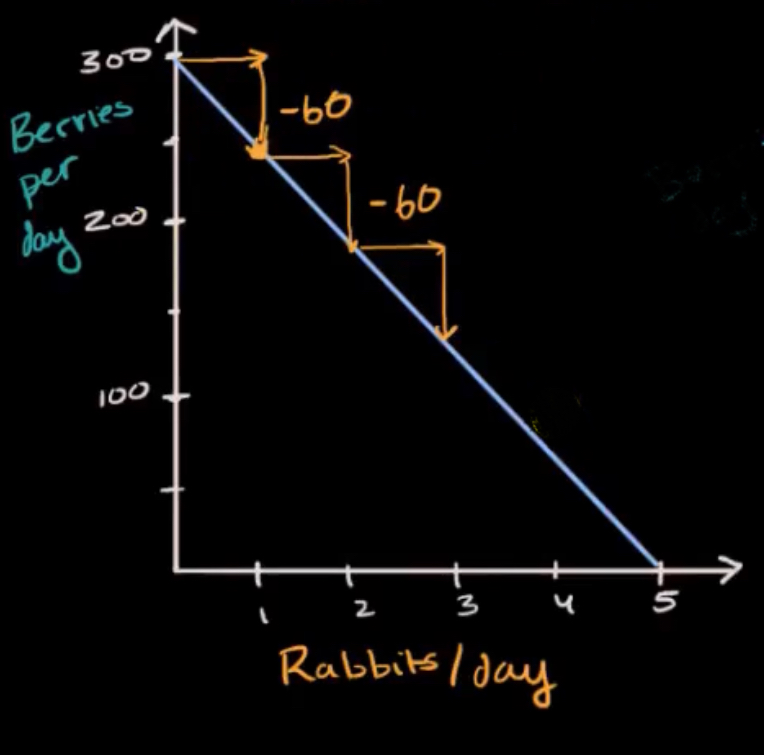
When you have a Constant opportunity cost, that means that it takes an equal amount of effort to catch each rabbit as it does to lose a certain amount of berries. (Maybe all of the rabbits are all the same speed, etc)
*When you have a diagonal line, you know that you have a constant opportunity cost.
PPCs for increasing, decreasing and constant opportunity cost
Production Possibilities Graph: Decreasing Opportunity Cost
Production Possibilities Graph: Increasing Opportunity Cost
Production Possibilities Graph: Constant Opportunity Cost
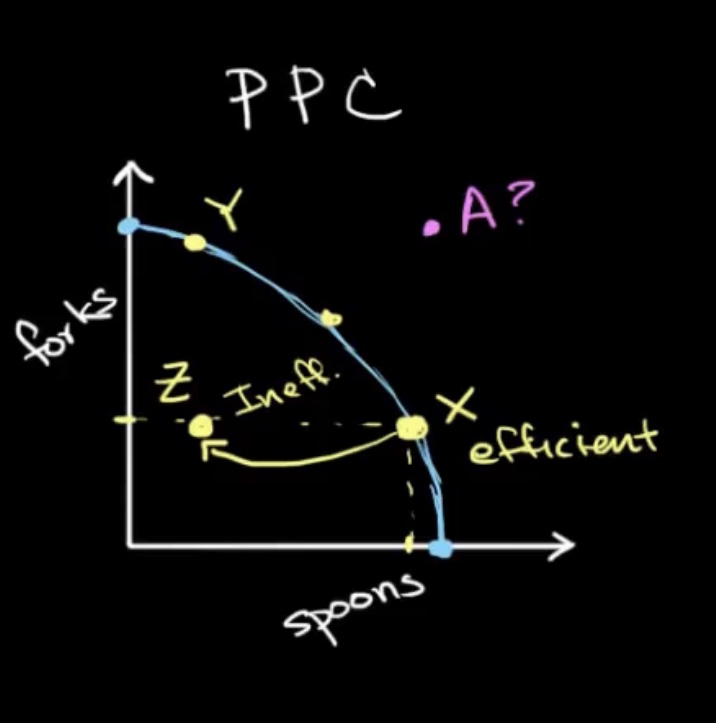
The Production Possibilities Curve is a model of a country’s economy.
In this example, you are the president of a country called Utenial United, and youare the main manufacturer of forks and spoons. And you are currently using your resources (labour, land, materials) efficiently, w hich means you will land on the production possibilities frontier (the curve). Although one day your country goes into a recession, you don’t have as many resources to use anymore, so you are ineffectively manufacturing these spoons. But after you start to recover from your recession, you decide that you want to do the seemingly impossible, get your productions to point A.
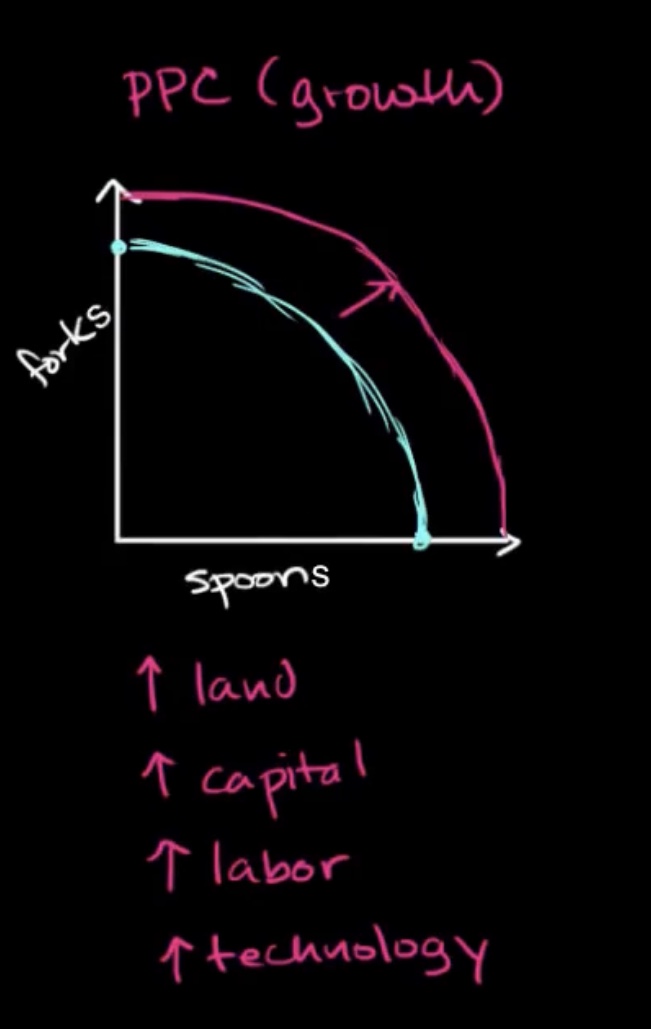
Although you cannot do this without gathering more resources so you can take over your neighbouring country and succeed. Now you have more materials, so your production of possibilities curve will grow.
(The main drivers of growth are land, capital, labour, and technology)
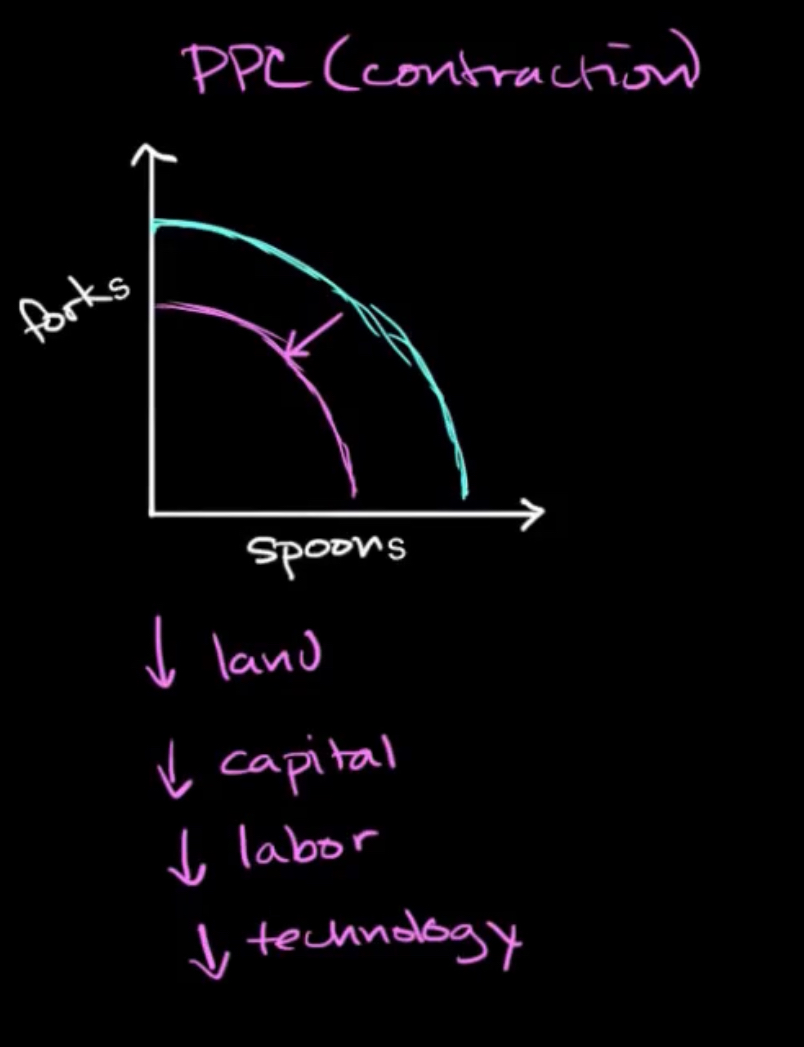
Suddenly, a few months later, another country gets jealous of your PPC growth and decides to start destroying your utensil factories. So now you have fewer drivers of growth, which has caused a contraction of PPC.
Summerized
When in a recession, a country will have an ineffective PPC
When more drivers of growth the PPC will grow
Q: Why is spending money on clothing a part of the opportunity cost of going to college and not paying tuition?
A: Because you would buy clothes whether or not you went to school, but you only have to pay tuition if you decide to go to college.
Q: What does a bow shape signify?
A: The two items being produced need completely different materials to be produced.
1.3 Comparative Advantage and the gains from trade
Comparative Advantage, Specialization and gains from trade
Let’s say two companies make both plates and cups. The first business owner is named Charlie, and his opportunity cost(OC) for making 1 plate 3 cups ( when he makes one plate ,he gives up the chance to produce 3 cups)
The other business owner is named Patty, and her opportunity cost for making 1 plate = 1/3 cup (when she makes 1 plat,e she only loses the opportunity to make 1/3 of a cup)
This means that Patty has a Comparative advantage in plates.
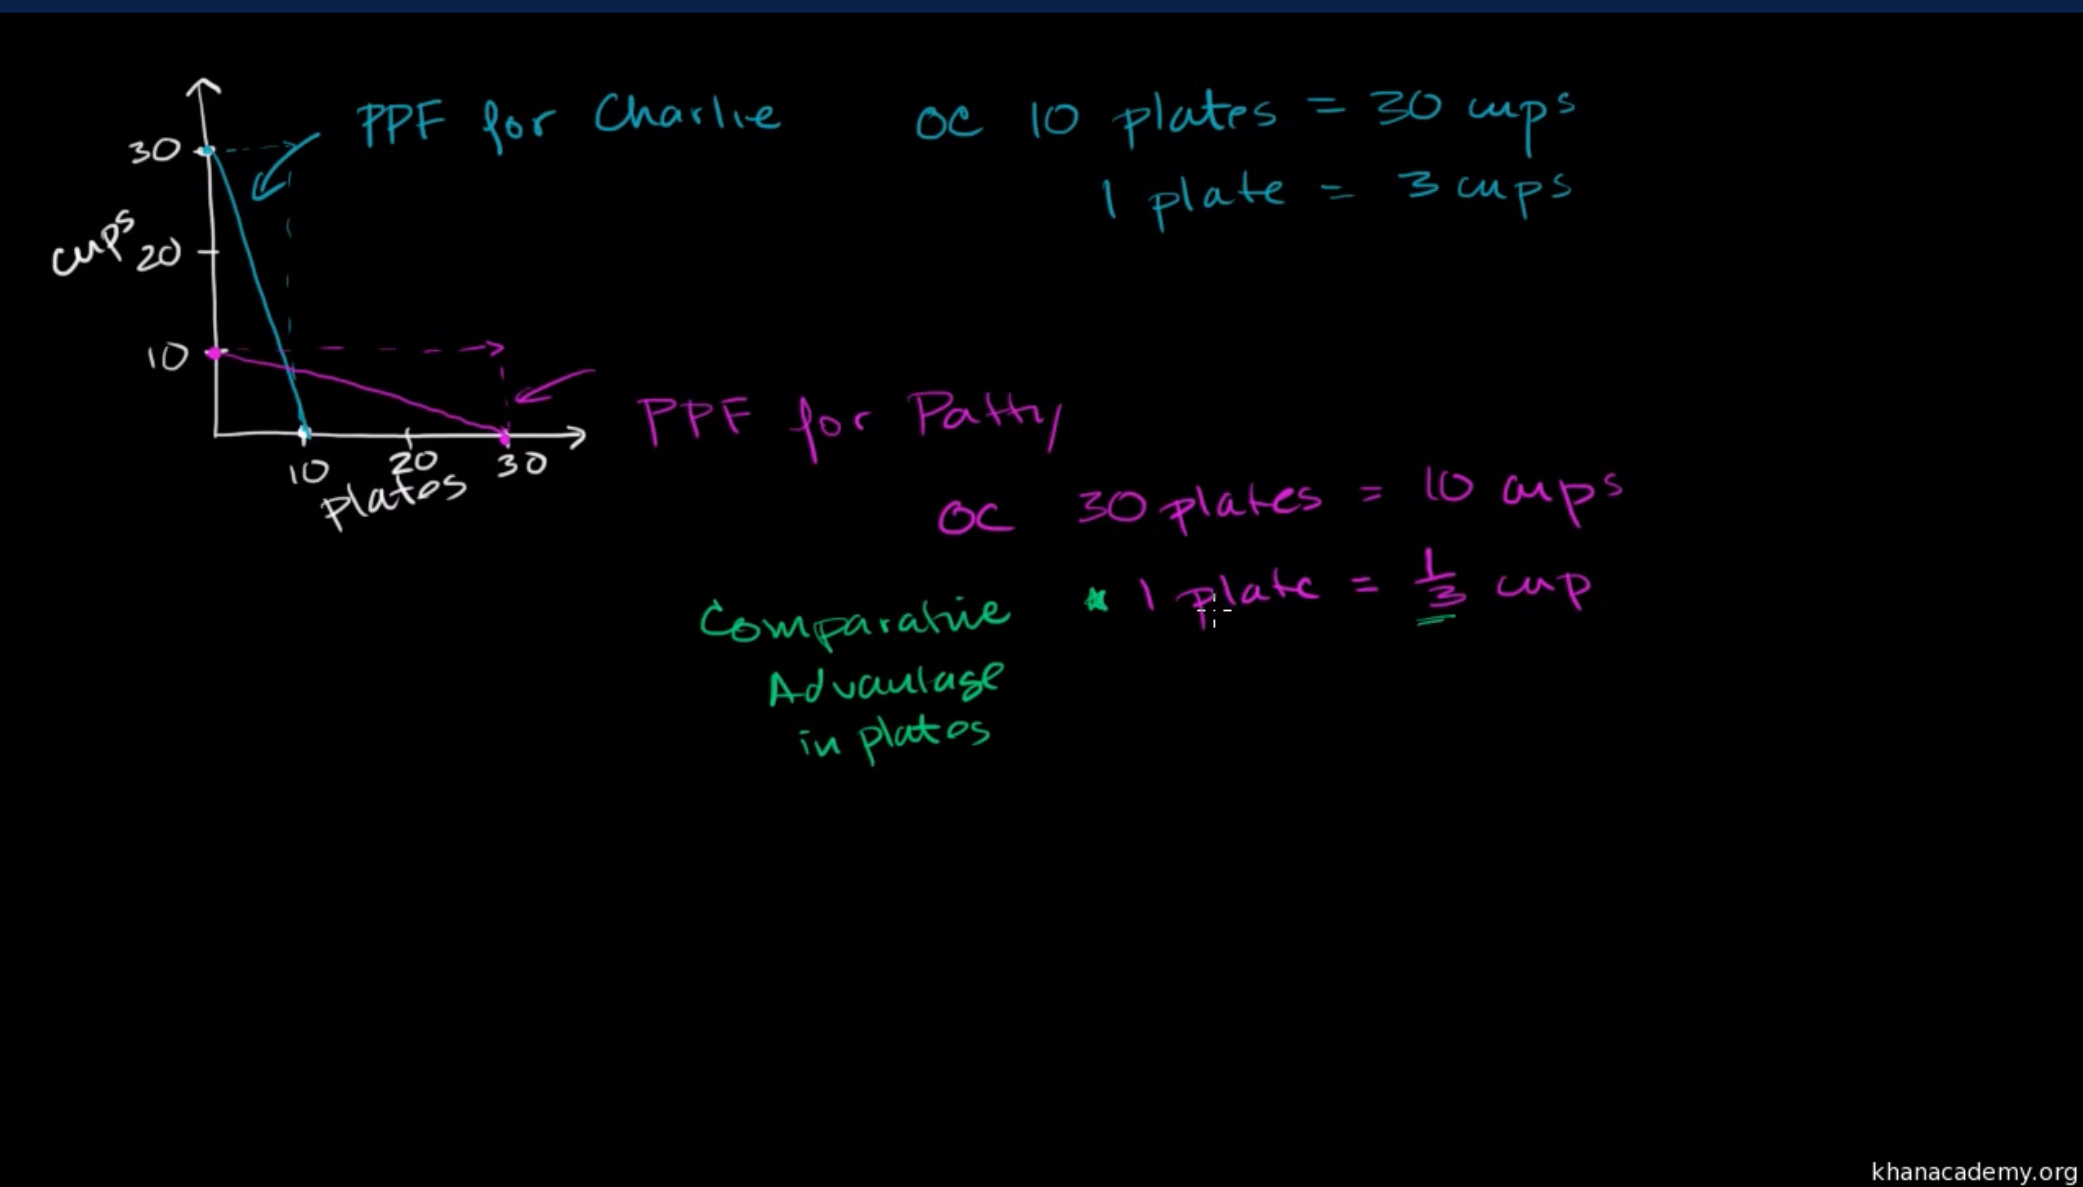
Although it is the opposite way around for producting cups. Charlies OC is 1 Cup= 1/3 plate and Pattys OC 1 Cup = 3 plates. So Charlie has the Comparative advantage for Cups.The two buissnes owners each of specializations (Charlies is in Cups and Patty’s is in Plates).
They decide to trade with each other because the Market price is 1 Cup for 1 Plate. So now if Charlie wants to make one plate he doesnt have to give up 3 cups and can instead only give up one. And patty doesnt have to give up 3 Cups for every plate. Now if Charlie and Patty trade 15 Cups for 15 Plates they can get into an unatamable are that was not possible without there specializationa dn trading.
Comparative Advantage vs Absolute Advantage
Absolute advantage is an economic concept that refers to the ability of a person, company, or country to produce a good or service more efficiently than another, meaning they can produce more output using the same amount of resources, or produce the same output using fewer resources.
Two producers can benefit from specializing and trading even if one has an absolute advantage in both products because they have different comparative advantages.
Comparative advantage means one producer gives up less of something else to make a product (lower opportunity cost). Each producer should specialize in the good they produce at a lower opportunity cost. By doing this and trading, both can end up with more than they could make on their own.
*You Can Only Benifit from trades if it is lower than your Opportunity Cost.
Opportunity Cost and Comparative Advantage using an Output Table
An output table shows how much of different goods each person, company, or country can produce in a given time (like a day, week, etc.), using the same amount of resources.
It helps you compare productivity and calculate opportunity cost and comparative advantage.
Let’s use an example:
Person | Cups | Plates |
|---|---|---|
Charlie | 6 | 18 |
Patty | 3 | 1 |
This shows how many Cups and Plates each person can make in 1 day.
Calculate Opportunity Cost
To find the opportunity cost of making one good: Divide the output of the other good by the output of the good you're analyzing.
Example:
Charlie:
1 Cup = 18 ÷ 6 = 3 Plates
1 Plate = 6 ÷ 18 = 1/3 Cup
Patty:
1 Cup = 1 ÷ 3 = 1/3 Plate
1 Plate = 3 ÷ 1 = 3 Cups
Comparative Advantage goes to the person with the lower opportunity cost for a good.
Charlie has a lower cost for Plates: he should make Plates.
Patty has a lower cost for Cups: she should make Cups.
*Now you know who should specialize in what and how trade can benefit both.
Terms of Trade and the Gains from Trade
Terms of Trade refer to the rate at which one good is exchanged for another between two producers or countries.
To be beneficial, the terms must fall between the two opportunity costs of the good being traded.
Rule: A Trade is only beneficial if the “price” (terms of trade) is lower than the buyers opportunity cost and higher than the sellers opportunity cost.
Example:
Let’s say:
Country | 1 Cup Costs | 1 Plate Costs |
|---|---|---|
A | 1 Cup = 2 Plates | 1 Plate = 1/2 Cup |
B | 1 Cup = 4 Plates | 1 Plate = 1/4 Cup |
Comparative advantage:
Country A should produce Cups (lower OC).
Country B should produce Plates (lower OC).
Terms of Trade Example:
1 Cup for 3 Plates is a good trade.
A gains because it gets 3 Plates > 2 (its OC).
B gains because it gives up 3 Plates < 4 (its OC).
Gains from trade are the extra goods a country or producer gets beyond what they could produce alone by specializing and trading.
Specialize in what you’re relatively best at (comparative advantage), trade at good terms, and both sides get more.
Input Approach to Determing Comparative Advantage
The input approach focuses on how much input (like time, labor, or resources) is needed to produce one unit of output.
Key Rule: When using the input method, lower input = abslute advantage, and comparative advantage goes to the one with the lower opportunity cost.
But here's the main trick:
For input problems, flip the numbers (or use the inverse) to calculate opportunity cost.
Example: Let’s say it takes:
Person | Time to Make 1 Cup | Time to Make 1 Plate |
|---|---|---|
Charlie | 2 hours | 6 hours |
Patty | 4 hours | 8 hours |
Step One Find Opportunity Cost:
Use this formula for input problems:
Opportunity cost of Good A = Input of A divided by Input of B
For Charlie:
1 Cup = 2 ÷ 6 = 1/3 Plate
1 Plate = 6 ÷ 2 = 3 Cups
For Patty
1 Cup = 4 ÷ 8 = 1/2 Plate
1 Plate = 8 ÷ 4 = 2 Cups
Determine Comparative Advantage
Charlie has a lower opportunity cost for Cups → Comparative advantage in Cups
Patty has a lower opportunity cost for Plates → Comparative advantage in Plates
Concept | Output Approach | Input Approach |
|---|---|---|
You’re given... | Amount produced | Time or resources needed |
Opportunity cost rule | What you give up / What you get | What you get / What you give up |
Lower OC → | Comparative Advantage | Comparative Advantage |
When there aren’t gains from trade
There are no gains from trade when one person or country has a lower opportunity cost for producing everything. Meaning they have a comparative advantage in all goods. In that case, trading won’t help because the other side can’t produce anything more efficiently.
Also, if the terms of trade aren’t between the producers’ opportunity costs, neither side benefits from trading.
1.4 Demand
What is the difference between demand and quantaity demand? Demand is just based off of the supply of the item. However the main idea of quantity demand is that it relates to the price of the goods, when all else is equal. When the price increases then the quantity demand decreases and vis versa.
Let’s say I own a ebook store and I normally sell books for 2 dollars each and I sell an average of 60,000 a day, and I suddenly increase to 4 dollar each balloon and sell 40,000. Now because of this increase in the price less people will want to buy from my store.
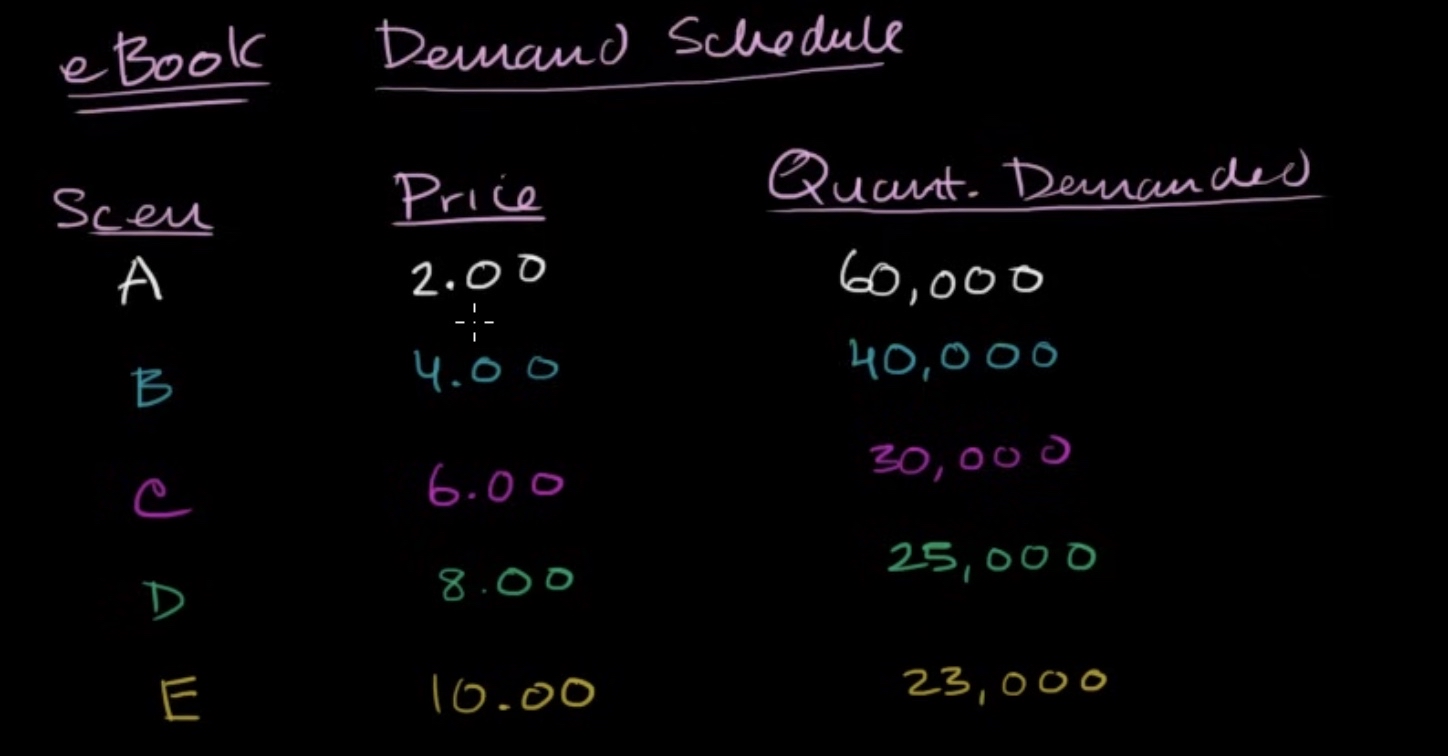
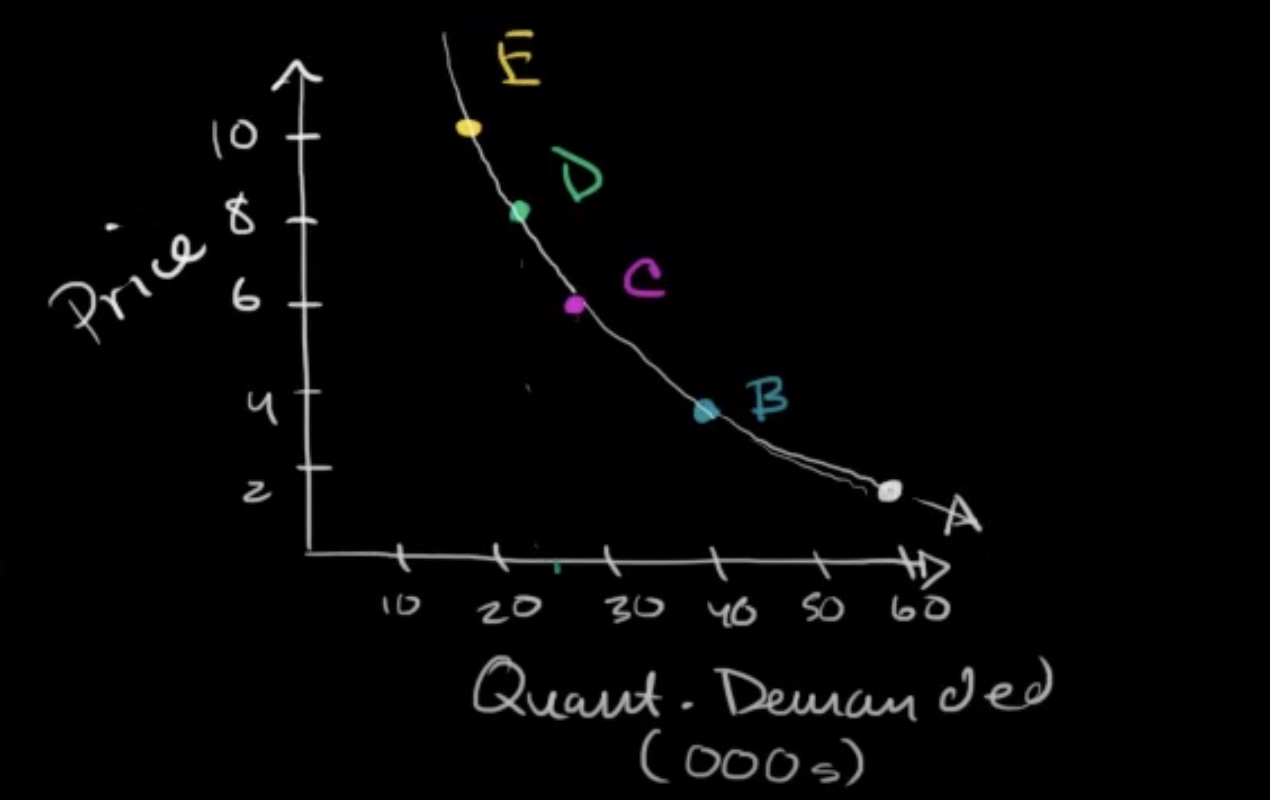
(The curve here is called the demand curve)
Unit 1 Difficult Vocab: Ceteris Paribus: all other things are equal
Unit 1 Formulas: