Modelling Economic Growth
We use two models
production possibility Frontier
Aggregate Production Function
They can be used to ecplain how economic growth results from an:
Increase in the quantity of resources - EG:
Labour force will grow over time due to population increasing
stock of capital equipment increasing over time due to investment
Improvement in the way that they are used/ quality (i.e., productivity) – EG:
•Training of people in a certain industry
•Developments and application of new technology
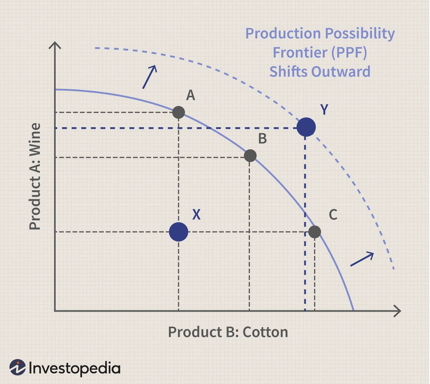
Growth and the PPF model
Shows the combination of output that an economy can produce using its available resources and level of technology for a give time period
Review:
all points along the PPF are productive/efficient
A point inside the PPF means resources aren’t being utilised efficiently – there is a gap between actual output and potential output
Curve shifts outwards if quantity or quality of resources increases/improves
New idea:
A shift from a point inside the PPF is growth in the sense of utilising resources that exist in the economy
An increase in quantity or quality of resources causes an increase in potential growth
This is not the most useful model – the APF in a few slides is a better representation of growth considered in economics
The PPF model also can illustrate how a trade off between present and future consumption might influence the potential rate of growth.
Investment is the keystone of this – it is the creation of capital goods that are used to produce goods in the future.
Sacrificing some current consumption enables resources to be used to produce capital goods = more production and therefore consumption in the future.
A higher rate of investment will always lead to a higher rate of economic growth – choices today can have a significant impact on future living standards.
Rule of 70 (70/ growth rate):
•If an economy grows at 2% per year – time taken for GDP to double = 70/ 2 = 35 years
•If an economy grows at 3.5% per year – time taken for GDP to double = 70/3.5 = 20 years
how a trade off between present and future consumption might influence the potential rate of growth.
Investment is the keystone of this – it is the creation of capital goods that are used to produce goods in the future.
Sacrificing some current consumption enables resources to be used to produce capital goods = more production and therefore consumption in the future.
A higher rate of investment will always lead to a higher rate of economic growth – choices today can have a significant impact on future living standards.
Rule of 70 (70/ growth rate):
•If an economy grows at 2% per year – time taken for GDP to double = 70/ 2 = 35 years
•If an economy grows at 3.5% per year – time taken for GDP to double = 70/3.5 = 20 years

Growth and the APF
Goods and services are produced by combining resources.
At the firm level:
Production occurs when a firm eploys labour and caputal to convert inputs into a final good or service
At the Macro level:
All firm’s production - therefore the aggregate production function
This is a more useful model than the PPF as it models actual growth
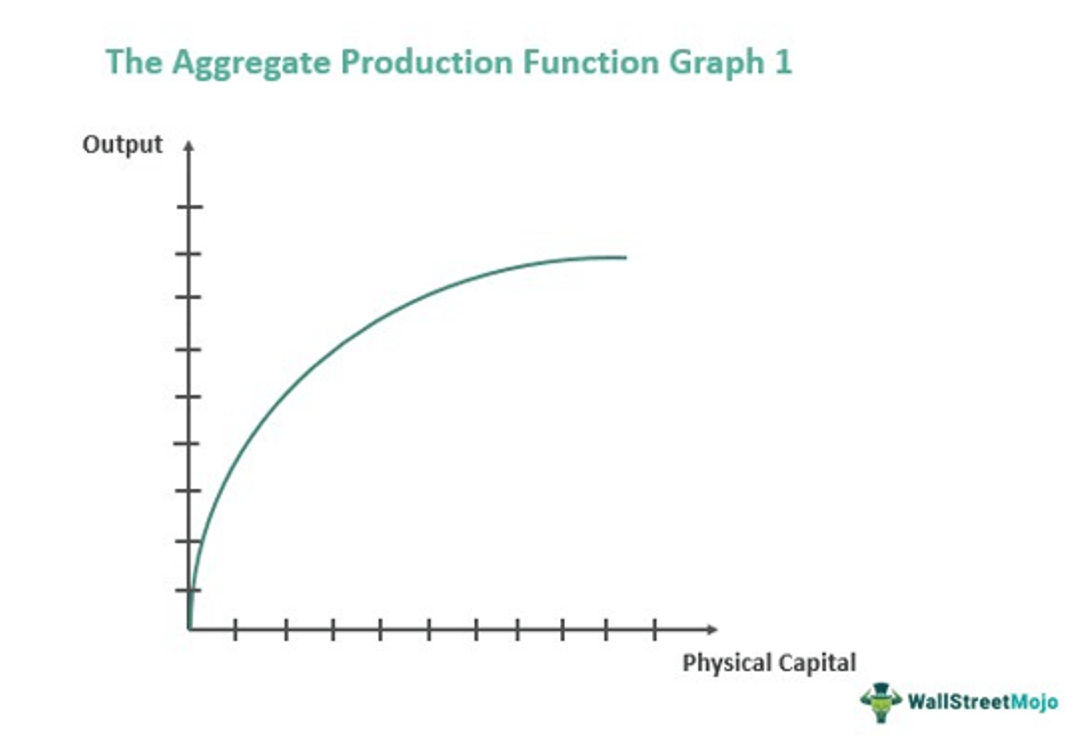
The function shows the relationship between the labour force and ecoomic growth ( Holding all other factors constant).
X axis - size of the labour force (millions)
Y axis - real GDP
The function shows a positive relationship between the quantity of labour and total production.
If the quantity of labour increases then real GDP will increase - movement along the curve/APF
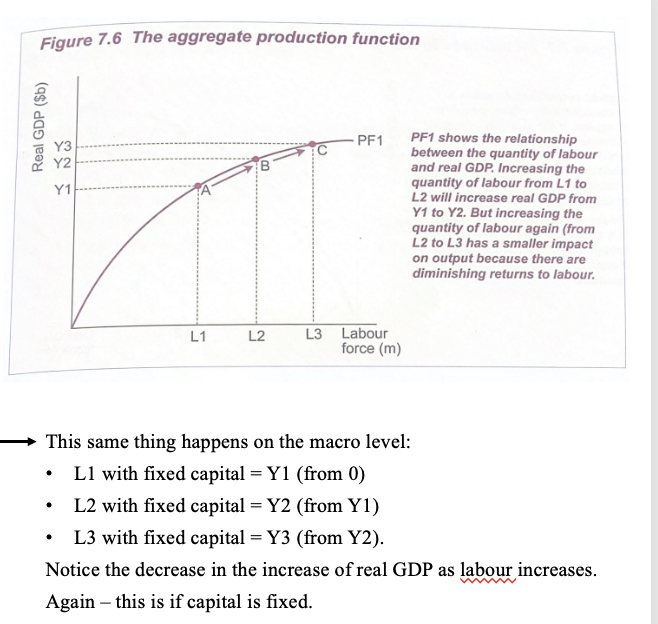
Law of diminishing returns:
With a fixed amount of capital, the return on an increase in labour (ie output) increases but at a declining/diminishing rate
For Example:
•If there are 0 machines and 0 people = 0 output
•If there is 1 machine and 1 person = output
•If there is 1 machine and 2 people = increased output but less than from 0 to 1
•If there is 1 machine and 3 people = increased output but less than from 1-2
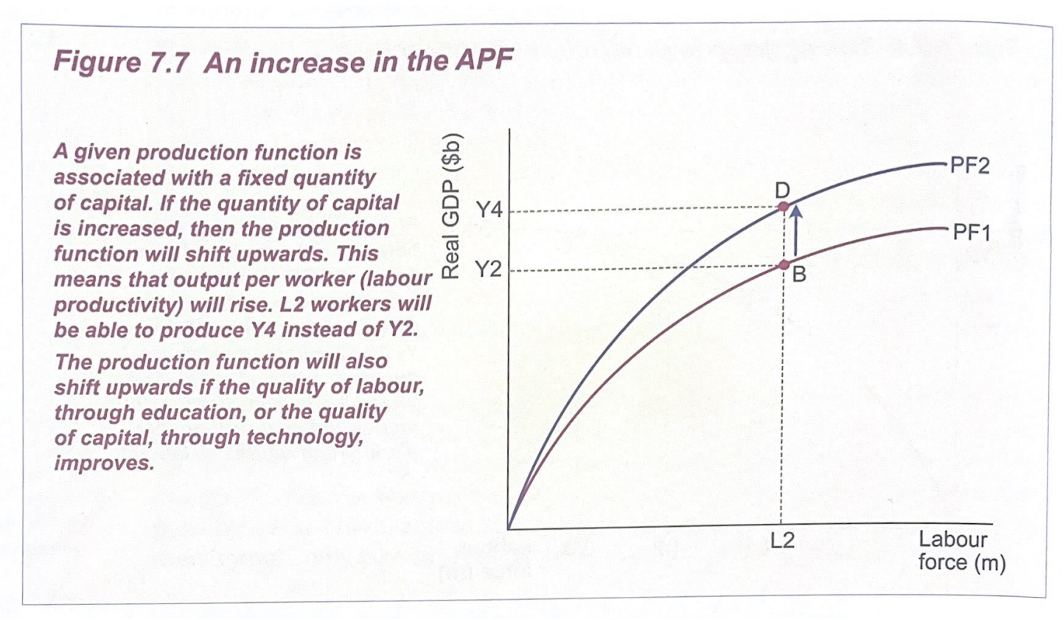
Increasing the amount of capital per worker will always result in an increase in labour productivity.
Productivity will also increase if the quality of capital increases.
Either of these will result in an upwards shift of the APF.
This means the amount that each worker can produce has increases - IE
L2 labour can now produce Y4
This increase in quantity or quality of capital causes output to increase at every level of labour input - IE
Labour is now more productive at each level
There are other ways to bring about an upward shift of the APF - EG:
Workers undergo training and development to improve their skills
Managers and business owners think about ways to bring innovations to their businesses to increase efficiency
The capital equipment people use is gradually improved as technology improves
People become more educated
Community health programs improve health outcomes
APF:
increase quantity of labour = movement along the curve
increase quantity of capital = movement upwards of the curve
increase quality of capital and/or labour= movement upwards of the curve