Data-Driven Project Management
Intro
Establish desired outcomees
KPI
Collect data
Present data
Metric - quantitative assessment
KPI Key indicator of progress
Quant measure thresholds for performance
Acceptable - within 5% of target
At Risk - within 5-10%
Unacceptable - more than 10% variance
Qualitative
Team Morale
Turnover
Stakeholder satisfaction
Collecting and Analyzing Business and Work Data
Net Present Value
CF = Cash Flow (investment - return)
i = discount rate (interest rate)
t = time periods
future money has less value than current money
Positive NPV is worth investing
To calculate
Required investment
Expected return
Timing of investments and returns
Time value of money
Usually provided by sponsor
Payback Period
Lower number is better - less time to get back investment
Cumulative Net Value over all time periods
NOT using NPV - doesn’t take discount/interest rate into account.
ROI
Highest ROI is best investment
Cost-Benefit Analysis
Anything over 1 is good investment
Root Cause Analysis (RCA)
Column 1: Cause
Column 2: Frequency
Use to create pareto chart (bar chart)
Should Identify things you have control over
Things that can then have solutions implemented
Collecting and Analyzing Schedule Metrics
Burnup Chart
Measures velocity
Total Work
Target velocity
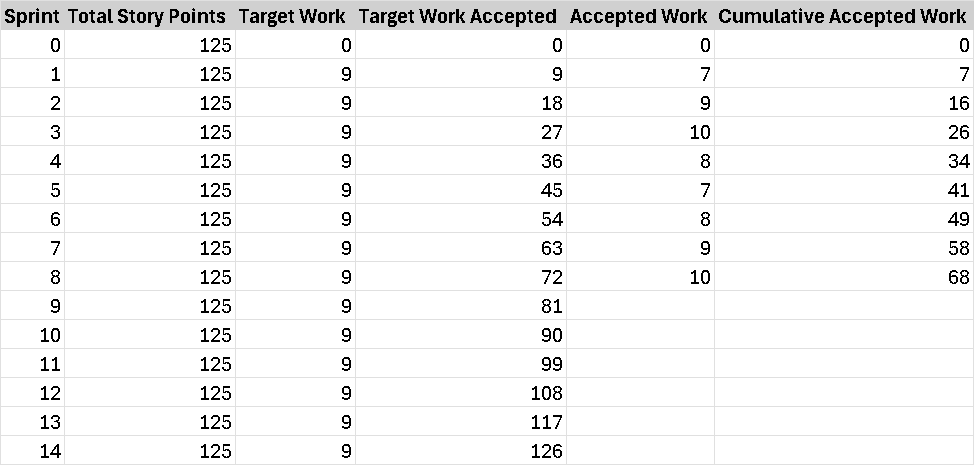
Target Work Accepted and Cumulative Work Accepted are key columns
If Cumulative<Target, behind schedule
If Scope increases/decreases, add or remove story points from their column in respective sprint/interval row.
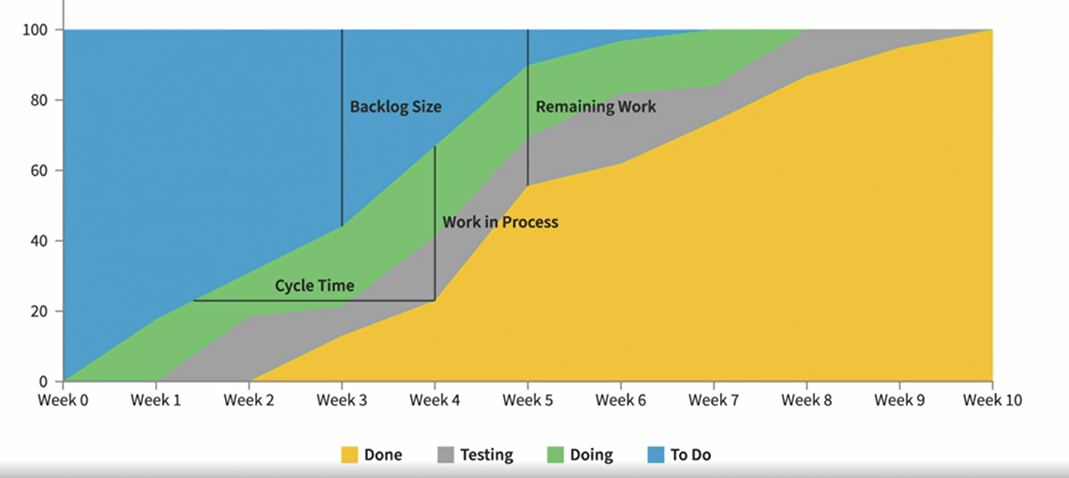
Cumulative Flow Diagram from Kanban
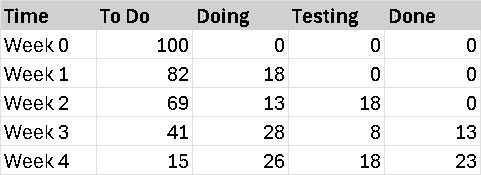
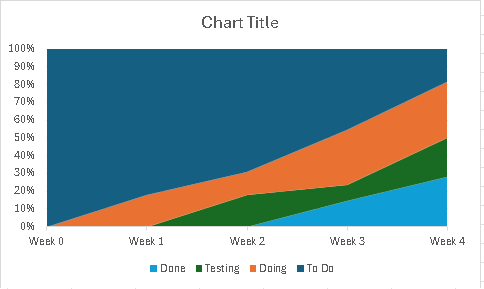
Week 3 - Less work in testing, more in doing, could be causing bottleneck.
Waterfall Approach counts tasks in progress, behind, etc, too.
Collecting and Analyzing Cost and Resource Data
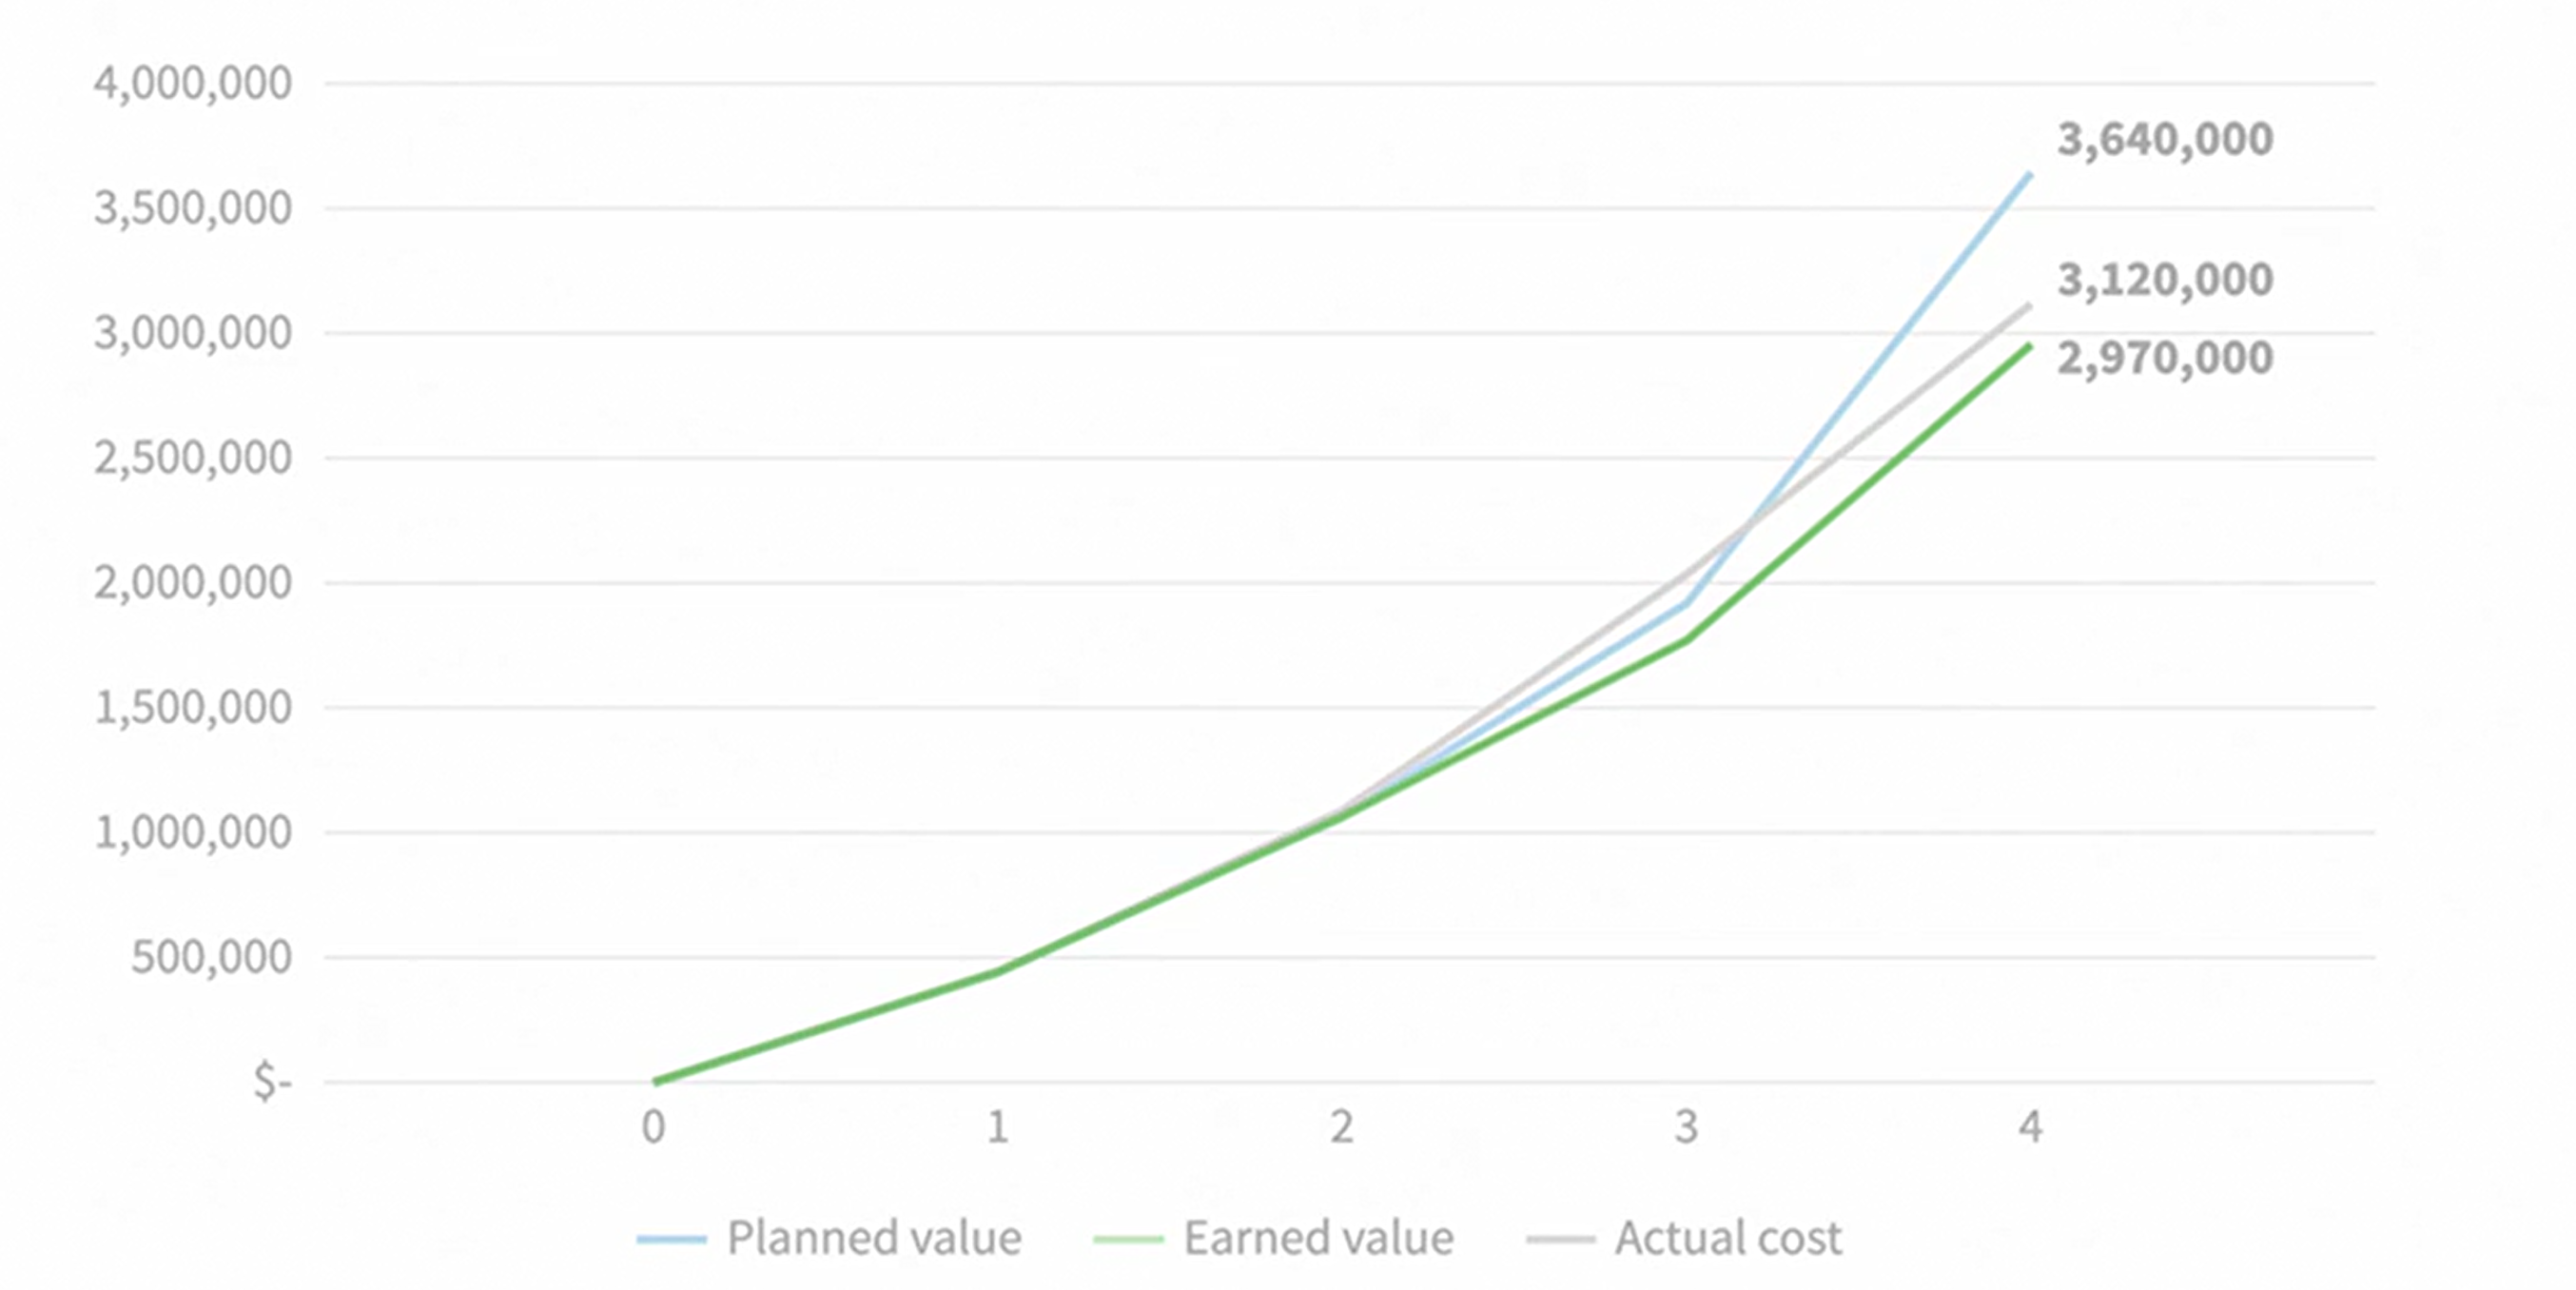
Earned Value Management
BAC - Budget at completion
Performance Measurement Baseline
Planned Value - budget for scheduled work.
Steps
Organize work with WBS
Develop a Schedule
Estimate costs for scheduled work
Calculate cumulative cost by period
Create performance measurement baseline chart
Time and Cost - Ahead or behind
Earned value - value of work accomplished.
Independent of actual cost of the work.
Forecasting Metrics
Schedule Variance = Earned Value - Planned value
ALWAYS EV first.
If negative, means more has been planned than completed. Behind schedule
Schedule Performance Index
“SPI = EVPV”
Result is “percentage efficient on our schedule”
If 0.82 (82%), means we are earning 8.2 days of value for every 10 days worked. Not good.
If 1.2 (120%), means we are earning 12 days of value for every 10 days worked. Good.
Cost Variance
Same rules as Schedule Variance. Negative is bad - over budget.
Cost Performance Index
"CPI = EVAC”
Less than 1 is bad. Means getting less than $1 for every $1 budgeted
Usually stabilizes after about 20% of project. If it’s in the hole, probably not getting out.
EVM only tells you about state, does not indicate causes.
Resource Metrics
Sources - difference in quantity (hours, 2×4’s, etc) or price

Usage Variance
AQ = Actual Quantity
EQ = Estimated Quantity
EP = Estimated Price
Price Variance
AP = Actual Price
EP = Estimated Price
AU = Actual Usage
Total Variance
Forecasting Metrics
Estimate to Complete
Two ways
1 - assumes original estimates are correct and variances are one-time events
AKA “Work Remaining”
BAC = Budget at Completion
EV = Earned Value
2 - Assumes variances will continue
Takes first way and divides by CPI.
CPI = Cost Performance Index
Estimate At Completion
Three Ways
1
assumes estimates correct and variances are one-offs
OR
2
Assumes future performance will be at same rate as current performance
3
Assumes schedule variance to account for crashing or extended time needed to complete.
OR
To Complete Performance Index
How good you need to perform for rest of project in order to achieve specific target. Usually BAC or EAC.
Divides work remaining by funds remaining.
Collecting and Analyzing Risk Data
Risk = Uncertain event that has positive or negative.
Impediment = Obstacle that prevents team from achieving goals.
Risk Score
P=Probability
I=Impact
Expected Monetary Value
L=Likelihood
C=Cost
Quantifies uncertainty associated with multiple options.
EV is only as good as information
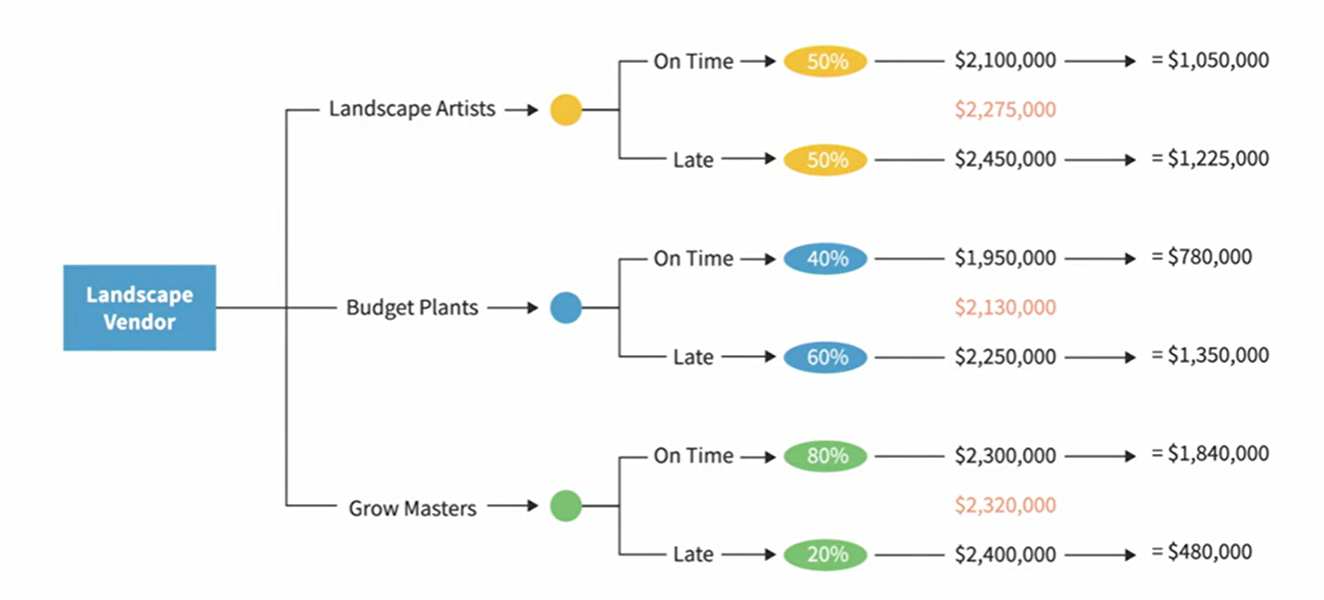
Decision Tree
Calculating Reserves
Risk analysis
Probability and impact of each risk (EMV)
Sum all EV’s to get total analysis
Reserve Using Optimisitc - Most Likely - Pessimistic
Cost Reserve Distribution accross phases
5% Concept
15% Organizing
50% Developing
20% Testing
10% Transition
Other Data Considerations
Dashboard - at a glance view of Key Performance Indicators
Information radiator - A hand drawn or electric display placed in a visible location for anyone to see a project’s current status
Kanban, Burnup, mood charts
Pitfalls
Correlations vs causation
Measuring what’s easy vs what’s meaningful
visitors to a site is not helpful, people that visit a certain page and complete a sale does.
Confirmation bias
Analyzing data in support of your theory
MoSCoW
Must Have
The ability to collect, import, and update data.
Tools to perform a what-if and alternatives analysis for scheduling and resource allocation
Modeling and forecasting software
Clear charts and graphics
Should Have
At a glance customizable dashboards
Customizable reports
Drill down capabilities
Could have
Integration with other project apps
Realtime data updates
secure mobile access
self serve capabilities for approved stakeholders
Business analysis and business intelligence specialists
Won’t Have
Vanity Metrics and Bias