Life-History Parameters
Life History and Strategies
Life History
Sequence, timing, and nature of events in an organism’s life, from birth to reproduction to death
An individual’s life history is determined by a set of life-history traits
A population’s life history is often represented as average age-specific rates (e.g. fecundity, survivorship)
Life History Strategies
A pattern of life-history traits (heritable trait that determines some aspect of life history for an organism/species). This could be age and size at maturity (first reproduction), number and size of offspring produced, or longevity
Evolved through natural selection over time in a population as a response to ecological/environmental conditions
Different life histories can succeed within the same environmental conditions
Successful and Unsuccessful Life History Strategies
A successful strategy in relation to estimated growth rate values (r)
Population estimated growth rate (per capita): Growing or stable r-value
Unsuccessful: contracting/shrinking population
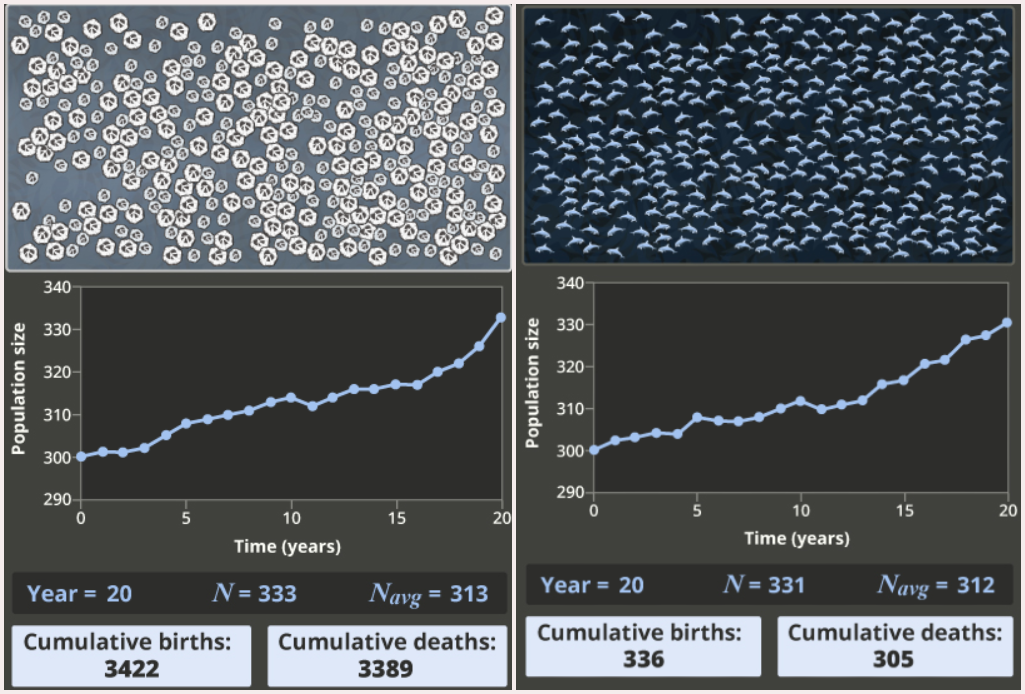
A Case Study of Differing Life-History Strategies
Different life histories can succeed within the same environmental conditions
Dolphins: Very few high-investment offspring (low birth rate) and offspring frequently survives to live a fairly long life (low death rate)
Barnacles: Produce thousands of offspring at a time (high birth rate), but invest very little in any one of them (offspring is vulnerable to predation/starvation; high mortality)
Demographic Parameters Explained and Equations
Demographic Parameters
Qualitative values that characterize the life history of a species (all per capita/per individual)
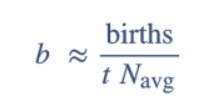
Birth rate (b): # of individuals born per individual in pop. per unit of time
Death rate (d): same as birth, but switch birth with death
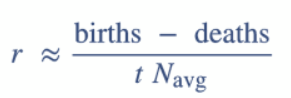
(Estimated) Growth rate (r): net change in pop. size per unit of time
Growing population size: r-value ≥ 0
Stable population: r-value ~ 0
Contracting/shrinking population: r-value ≤ 0
Fecundity
Represents the average number of offspring per reproductive female per unit of time
Estimated birth accounts for all females, fecundity only considers females within the reproductive age demographic
High fecundity: Large number of offspring in a short period of time
Calculation: Number of babies born per year divided by the number of females within the reproductive age demographic
Population Age Structures and Population Pyramids
Population Age Structure
Distribution of individuals across ages, from birth to the species’ maximum life span
Distribution of ages within a population
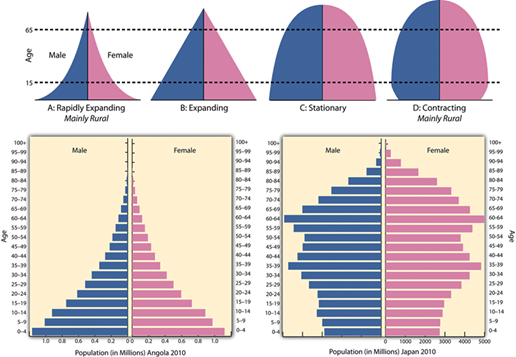
Age/Population Pyramids
Graphical way to illustrate a population’s age structure/distribution
Its shape can determine whether the population size is growing shrinking/contracting/stable