(6) Validation in QC
1) Linearity & range
Linearity
The method’s ability to give results proportional to analyte conc.
Determined by a calibration curve with at least five conc. levels ‘points’.
Expressed as:
correlation coefficient R= approx. 1.
Regression line: y=aX + b
Range
The interval between upper and lower level of an analyte in a calibration curve. It’s to determine the diff. between upper & lower limits.
Expressed as:
Concentration
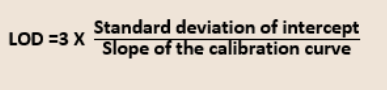
2) Limits of detection (LOD)
The lowest conc. of analyte that can be detected.
Determined by:
Signal—→ noise ratio 3:1
Expressed as: concentration
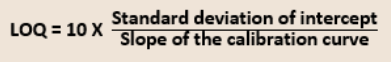
3) Limits of quantification (LOQ)
The lowest conc. of analyte that can be determined accurately & precisely.
Determined by:
Signal—→ noise ratio 10:1
Expressed as: concentration
4) Precision
The degree of agreement among individual results “how close the values are to each other”. Closer agreement—→ more precise results.
Precise does not imply accuracy.
Determined by:
At least nine determinations (3 conc. repeated 3 times).
Expressed as: standard deviation (S.D) or relative SD (% RSD)—→ Recommended to be <= 2.

A method’s precision is evaluated at levels:
Repeatability (intra-day precision) | Intermediate precision (inter-day precision)/Ruggedness | Reproducibility |
A measure of a method’s ability to generate similar results for multiple preparations in a short time interval (e.g. same day) under same conditions. | A measure of the variability of results when samples are tested and compared using diff. analysts, equipment and on diff. days. | The precision obtained when samples are prepared and compared bw. diff. testing sites (inter-laboratory variability). |
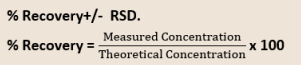
5) Accuracy
A measure for the closeness of the experiment results to the true/reference value.
Determined by:
at least nine determinations (3 conc. repeated 3 times).
Expressed as:
Measured conc. is y=aX+b
6) Specificity
The ability of a method to discriminate between intended analyte and other components in sample.
Expressed as: resolution.
7) Robustness
A method insensitive ‘unaffected’ to small changes in experimental conditions such as temp., pH or % organic phase—→ considered robust.
A method is not robust if changes in those conditions leads to significantly different results (large SD and RSD). Expressed as %RSD.
8) System suitability test (SST)
To indicate that the instrumental system is operating properly. It is performed before, within and after analyzing batches of sample.
Ex. in HPLC/UPLC, ensure that the system yields same parameters (retention time, peak area, etc) already demonstrated when method was first validated.
Expressed as: variable acc. to parameters being measured. Compared to reference value.
Expressed as: | Determined by: | |
Linearity |
| Calibration curve with at least five conc. levels ‘points’. |
Range | Concentrations | Difference between upper & lower limits. |
LOD | Concentration | Signal—→ noise ratio 3:1 |
LOQ | Concentration | Signal—→ noise ratio 10:1 |
Precision | standard deviation (S.D) or relative SD (% RSD)—→ Recommended to be <= 2. | At least nine determinations (3 conc. repeated 3 times). |
Accuracy | | At least nine determinations (3 conc. repeated 3 times). |
Specificity | Resolution | |
Robustness | %RSD. | |
SST | Variable acc. to parameters being measured. |