Topic 7
A Simple Model of Evolution
Overview of White Butterflies Population
A population of white butterflies is presented as a foundational model for evolutionary study.
Introduction of a rare brown mutant raises questions regarding its fate in the population.
Introduction of Brown Mutant
A rare brown mutant appears in the white butterfly population.
Questions Raised: What will happen to this mutant?
Genetic Basis of Traits
Discussion of genotype representation:
Genotypes are represented as CW and CB at a single genetic locus (C).
Two alternative alleles: CW (white) and CB (brown), where CB is dominant over CW.
Spreading of the CB Allele
Inquiry into whether the CB allele will spread in the population.
Models suggest that the presence of the brown morph will influence evolutionary dynamics.
Fitness of the Brown Morph
The fitness of genotypes is evaluated:
Average Offspring Numbers:
CW CW: 49
Cw CB: 50
CB CB: 50
Definition: Fitness is defined as a measure of a genotype's contribution to the next generation.
Performance of the Brown Mutant
An analysis of whether the brown morph performs better or worse than existing variants.
Conclusion: The brown morph is found to be fitter, indicating that it will be favored by natural selection and thus increase in frequency.
Matrix of average numbers of offspring affirms Mating Success rates.
Rate of Spread of the Brown Mutant
Key Question: How quickly will it spread?
Importance of a standardized measure of fitness to determine the spread rate of the brown morph in the population.
Relative Fitness (W)
Definition: Relative Fitness (W) is introduced as the fitness of a genotype relative to the fittest genotype in the population.
In evolutionary terms, relative success matters more than absolute success.
Calculation of Relative Fitness
Calculation Example:
Genotypes and their relative fitness values:
CW CW: 49/50 = 0.98
Cw CB: 1
CB CB: 1
Relative fitness is crucial for understanding evolutionary trajectories.
Derivation of the Coefficient of Selection (s):
Formula: determines fitness losses against the fittest genotype.
Future Frequencies of Alleles
If frequencies of CW and CB are known, population genetic equations can project future frequencies based on relative fitness.
Initial frequencies of genotypes in generations:
Generation 1:
Frequency of CW = 0.99
Frequency of CB = 0.01
Generation 2 projections show evolutionary dynamics:
Frequency of CW = 0.9898
Frequency of CB = 0.0102
Visualization of Allele Spread
Graphs show the frequency of the brown allele over time:
Tracking alleles through generations visualizes predicted shifts in population genetics.
Impact of Selective Advantage
Hypothetical scenarios examine the consequences of varying selective advantages.
Higher fitness advantages lead to faster rates of evolution.
Exploration into implications of recessive alleles shows how fitness dynamics change with allele dominance status.
Recessive Alleles and Initial Spreading Rate
Recessive alleles often spread more slowly initially due to their presence primarily in heterozygotes.
A genotype frequency of CB at 0.01 reflects Hardy-Weinberg equilibrium assumptions, leading to observations of low visibility to selection.
Highlights the difference in visibility to selection experienced by recessive alleles versus dominant alleles.
Summary of Simple Evolutionary Models
Key points for understanding evolutionary mechanisms:
Rates of beneficial allele spread rely on:
A) Relative fitness of different genotypes.
B) Whether the allele is dominant or recessive.
Even small differences in relative fitness can catalyze rapid evolutionary change.
Evolution of Continuous Traits
Definition and Examples
Continuous traits defined as characteristics affected by multiple genes and environmental interactions (e.g., height, weight)—classified as polygenic traits.
Initial Generation Dynamics
Generation characteristics are measured in beetle populations:
Body sizes observed:
Average size = 20.1 mg on population metrics.
Assessments of variations and fitness profiles help in charting evolutionary dynamics of body size across generations.
Changes Over Generations
Discussion of how average body size in generation 2 increased reflecting evolutionary success:
Average size = 21.1 mg, which illustrates shifts in average metrics due to evolutionary pressure.
Speed of Evolution
The steepness of the fitness profile is tied to evolution speed:
Addressing strong versus weak selection pressures shows variability in the evolutionary response.
Types of Selection
Directional Selection: Cultivates a push in one direction (traits become more pronounced).
Stabilizing Selection: Maintains average trait values, potentially refining the population's uniformity with decreased variance.
Disruptive Selection: Rare yet capable of fostering multiple forms within a species.
Heritability Discussion
Determining how heritable a trait is reveals its evolutionary tractability:
Strong heritability leads to efficient response to selection, while lower heritability indicates slower evolutionary adjustments.
Practical Examples in Nature
Real-world scenarios showcase how directional selection is commonplace during environmental shifts:
Transfer of guppies to different environments illustrates body size changes due to predation pressures exerted by killifish.
Conclusion on Continuous Traits
Summary emphasizes that natural selection can influence continuous traits significantly:
The functionality of directional, stabilizing, and disruptive selection reflect complex dynamics in evolutionary trajectories leading to diversity within populations.
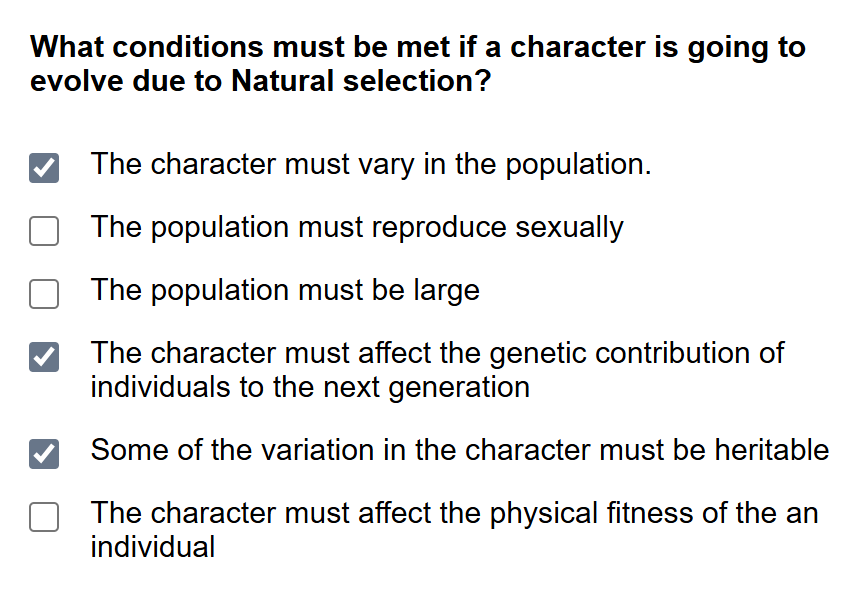
This dynamic can result in shifts in phenotypic distributions, where certain traits become more advantageous under specific environmental pressures, thereby shaping future generations.