SOCSC 13 - LT1
Economic Development: A Global Perspective |
|---|
Economic Development
Dualism
Two extreme worlds coexisting with each other
The world is evolving
Asia has been growing at an average rate almost triple that of high-income Western countries, and growth has returned to Africa
Health has improved strongly, with dramatic declines in child mortality
Goal of universal primary education is coming into sight.
Poverty has fallen
Innocaation has accelerated
However, many things are still at risk
Future of economic development and poverty reduction is far from assured — many people who have come out of poverty remain vulnerable
Natural environment is deteriorating
National economic growth remains uncertain.
Economic development is a process, not of years, but of many decades.
Absolute Poverty
Situation of being unable to meet the minimum levels of income, food, clothing, healthcare, shelter, and other essentials
734 million people are living in extreme poverty (10% of the world population)
How the Other Half Live=
(Rich) Reasonably good life
Own house, cards
Have consumer good and appliances sourced locally and abroad
Eat 3 meals a day
Complete schooling
Embark on careers
Live an average of 78 years
(Poor) Tough life
Many people living in the household (extended family)
Real per capita annual income of $300
Poor living conditions
Long working hours and poor working conditions
Literacy is low and education is a challenge
Eat 2 meals a day and it is common to recycle food
Frequent sickness happens
“The work is hard, the sun is hot, and aspirations for a better life are continually being snuffed out. For families such as theirs, the only relief from the daily struggle for physical survival lies in the spiritual traditions of the people.”
Subsistence Economy
An economy in which production is mainly for personal consumption and the standard of living yields little more than basic necessities of life—food, shelter, and clothing.
Example: You are living in a remote area, and each culter contains a group of extended families, all participating in and sharing the work.
Little money income = most food, clothing, shelter, and worldly goods are consumed by the people themselves
Development
The process of improving the quality of all human lives and capabilities by raising people’s levels of living, self-esteem, and freedom.
Developing Countries (Less Developed Countries) → low levels of living and development deficits
Asia, Africa, the Middle East, Latin America, Eastern Europe, and the former Soviet Union
Paying attention to the plight of the half or more of the world’s population for whom low levels of living are a fact of life
Developing Countries cannot be analyzed realistically without also considering the role of economically developed nations in directly or indirectly promoting or retarding that development.
Common future for humankind + rapidly shrinking world = importance of economic development
People are selfish, but we can compromise! :>
Buyer Goal (tumawad): Consumer Surplus
Reservation Price: the amount I’m willing to pay
Actual price
Seller Goal (kumita): Product Surplus
Average cost
Rate
Equilibrium: Buyer Goal and Seller Goal achieved their goals
Traditional Economics
An approach to economics that emphasizes utility, profit maximization, market efficiency, and determination of equilibrium.
Least-cost allocation of scarce productive resources and with the optimal growth of these resources over time so as to produce an ever-expanding range of goods and services
Political Economy
Attempt to merge economic analysis with practical politics — to view economic activity in its political context
Study social and institutional processes through which certain groups of economic and political elites influence the allocation of scarce productive resources (either for their own benefit or the larger population)
Role of power in economic decision making
Development Economics
The study of how economies are transformed from stagnation to growth and from low-income to high-income status, and overcome problems of absolute poverty.
Deal with the economic, social, political, and institutional mechanisms, both public and private, necessary to bring about rapid (at least by historical standards) and large-scale improvements in levels of living for the peoples of Africa, Asia, Latin America, and the formerly socialist transition economies.
It must focus on the mechanisms that keep families, regions, and even entire nations in poverty traps, in which past poverty causes future poverty, and on the most effective strategies for breaking out of these traps.
Role of a larger government role
Ultimate Purpose: Help us understand developing economies in order to help improve the material lives of the majority of the global population.
More Developed Countries
Western Europe, North America, Australia, New Zealand, and Japan
Less Developed/Developing Countries
Commodity and resource markets are typically highly imperfect, consumers and producers have limited information, major structural changes are taking place in both the society and the economy, the potential for multiple equilibria rather than a single equilibrium is more common, and disequilibrium situations often prevail (prices do not equate supply and demand).
Globalization
The increasing integration of national economies into expanding international markets.
Process of speeding up the movement and exchange of goods and services across the globe
Values Matter
Value premises = what the numbers are and what the values
Needed by economic analysis and economic policy
Development Economics goes beyond Trad Economic
Social System
Development Economics covers the organizational and institutional structure of society, including its values, attitudes, power structures and traditions
Values
Principles, standards, or qualities that a society or groups within it considers worthwhile or desirable
Attitudes
State of mind or feelings of an individual, group or society regarding issues such as material gain, hard work, saving for the future and sharing wealth
Institutions
Norms, rules of conduct and generally accepted ways of doing things
General accepted ways of doing things
Development
Traditional Economics = sustained rates of growth in income per capita to enable a notion to expound its output at a rate faster than its population growth
Development strategies have therefore focused on rapid industrialization, often at the expense of agriculture and rural development
Problems of poverty, discrimination, unemployment, and income distribution were of secondary importance to “getting the growth job done.”
What do we mean by development?
Income per capita
Total gross national income of a country divided by its total population (GNI/total population)
Gross National Income
The total domestic and foreign output claimed by residents of a country
GDP + factor incomes occurring to residents from abroad - income earned in the domestic economy occurring to persons abroad.
Gross Domestic Product
The total final output of goods and services produced by the country’s economy, within the country’s territory by residents and nonresidents, regardless of its allocation between domestic and foreign claims
Bibingka analogy → Goal: Make it bigger (Emphasis on increased output)
Transactions captured in formal economy are included in the GDP
Those without the receipts won’t be included in the the overall GDP (Informal Economy)
GDP vs GNP
Gawa Dito sa Pilipinas (GDP)
Measures value of all production done domestically (within the Philippines) regardless of who did it
Gawa ng Pilipino (GNP)
Output made of the Filipinos regardless of where they are
It can be both GDP and GNP
I’m a Filipino and I live in the PH
(*prob for quiz) Is San Mig, which is a filo company, makes beer in Thailand. What is it part of? GNP [baka may trick question] [pwede multiple choice like can be both GDP and GNP]
Is the Philippines developing?
Average might give us indicators that tell us they’re improving. However, it’s important that we consider the context of other people because the representative sample DOES NOT encapsulate everything!
PH citizen lives on around PHP 491 daily
Dudley Seers on Development
Question to ask about a country’s development:
What has been happening to poverty? What has been happening to unemployment? What has been happening to inequality? If all three of these have declined from high levels, then beyond doubt this has been a period of development for the country concerned.
Income per capita is not enough
Consider: Poverty, Unemployment, and Inequality
If all three failed = would it still be “development” even if per capita income doubled → no!
Development Is a multidimensional process involves major changes in
Social Structures
Popular Attitudes
National Institutions
Multidimensional process involves
Acceleration of economic growth (Grow the economy)
Reduction of inequality (Everybody gets a piece of it)
Eradication of poverty
Development should represent the whole gamut of change
Entire social system tuned to the diverse basic needs and evolving aspirations of individuals and social groups
Moves away from a condition of life perceived as unsatisfactory or a condition of life regarded as materially and spiritually better
Amartya Sen’s Capability Approach
Development is the capability of a person to function
“The expansion of commodity productions...are valued, ultimately, not for their own sake, but as means to human welfare and freedom.”
Consumer’s capacity rather than characteristics of commodities
What matters fundamentally is not the things a person has—or the feelings these provide—but what a person is, or can be, and does, or can do.
Functionings = what people do or can do with the commodities of given characteristics that thet can come to possess/control
More functioning = more development
Example of Functioning → what you like + aligned with the resources you have = development; having a relevant asset that will help you grow !
Do I have a bike?
Do I like biking?
Do I know how to bike?
Can I bike outside?
Subjective Well-being = Kind of psychological state of being — a functioning — that could be pursued alongside other functionings (health and dignity)
Talents + Tools = Trade
You should have access to the tools that will help you enhance your skills
Amartya’s 5 Sources of Disparity
Personal Heterogeneities
Disability, Illness, age, gender
Environmental Diversities
Heating and clothing requirements in the cold, infectious diseases in the tropics, impact of population
Variation in Social Climate
Crime and violence and Social Capital
Distribution within the family
Economic statistics measure incomes received in a family, family resources are distributed unevenly, girls getting less medical attention/education
Differences in relational perspectives
Some goods are essential because of local customs and conventions
“To appear in public without shame”
Therefore:
Looking at real income levels/levels of consumption of specific commodities cannot suffice as a measure of well-being
One may have income, but certain commodities essential for well-being (nutritious food) may be unavailable
Consumption must be framed based on personal and social context
Bread as the most basic commodity
It has product “characteristics” such as taste and nutrition such as protein; and it helps to meet conventions of social exchange in the sense of breaking bread together.
But many of these benefits depend on the person and her circumstances, such as her activity level, metabolism, weight, whether she is pregnant or lactating, nutrition knowledge, whether she is infected with parasites, and her access to medical
Functioning depends on:
Social conventions in force in the society in which the person lives
Position of the person in the family and in the society
Presence or absence of festivities such as marriages, seasonal activities, and other occasions (funerals)
Physical distance from the homes of friends and relatives
External Capabilities
The capacity to maintain valued social relationships and to network leads
Abilities to function that are conferred by direct connection or relationship with another person
Capabilities (still by Amartya Sen)
The freedom that a person has in terms of the choice of functionings, given his personal features (conversion of characteristics into functionings) and his command over commodities.
Health/Education and Social Inclusion/Empowerrment >>
Countries with high levels of income but poor health and education standards as cases of “growth without development.
Real income is essential, but to convert the characteristics of commodities into functionings, in most important cases, surely requires health and education as well as income.
People living in poverty are often deprived—at times deliberately— of capabilities to make substantive choices and to take valuable actions, and often the behavior of the poor can be understood in that light.
According to Amartya Sen, well-being means being well
Healthy
Well-nourished
Well-clothed
Literate
Long-lived
Take part in the life of the community
Being mobile
Having freedom of choice in what one can become and can do
Development and Happiness
Happiness
Part of human well-being
Can expand individual’s capability to function
Can increase with increases in average income
Findings: Average level of happiness or satisfaction increases with a country’s average income.
Financial Security is only one factor affecting happiness
According to Richard Layard, there are 7 factors that affect national happiness
Family Relationships
Financial Situation
Work
Community
Friends
Health
Personal Freedom
Personal Values
Philippines and Happiness
No 60 of 146
According to the survey, here are countries whose happiness levels are high:
Finland, Denmark, Iceland, Switzerland, Netherlands, Luxembourg, Sweden, Norway, Israel, New Zealand
Additional thoughts from the book
People are happier when they are not unemployed, not divorced or separated, and have high trust of others in society, as well as enjoy high government quality with democratic freedoms and have religious faith.
Happiness is not the only dimension of subjective well-being of importance
Subjective well-being encompasses different aspects (cognitive evaluations of one’s life, happiness, satisfaction, positive emotions such as joy and pride, and negative emotions such as pain and worry): each of them should be measured separately to derive a more comprehensive appreciation of people’s lives.
3 Core Values of Development → conceptual basis and practical guideline for understanding the inner meaning of development
Sustenance: The Ability to Meet Basic Needs
Basic goods and services (food, shelter, clothing) that are necessary to sustain human being at the bare minimum level of living
When any of these is absent/short supply: Absolute underdevelopment exists
“Have enough in order to be more” → Rising per capita incomes, the elimination of absolute poverty, greater employment opportunities, and lessening income inequalities therefore constitute the necessary but not the sufficient conditions for development.
Self-esteem: To be a Person
Feeling of worthiness that a society enjoys when its social, political and economic systems and institutions promote human values such as respect, dignity, integrity, and self-determination
National Prosperity = universal measure of worth
Significance attached to material values in developed nations, worthiness and esteem → countries that possess economic wealth and technological power
“Development is legitimized as a goal because it is an important, even an indispensable, way of gaining esteem”
Freedom from Servitude: To be able to Choose
Emancipation from alienating material conditions of life and from social servitude to nature, other people, misery, oppressive institutions, and dogmatic beliefs, especially that poverty is predestination.
Expected range of choices for societies and their members, with minimization of external constraints in the pursuit of social goal
“The advantage of economic growth is not that wealth increases happiness, but it increases the range of human choice”
Wealth can enable people to gain greater control over nature and the physical environment
Central Role of Women
Globally, women are poorer than men
They are more deprived in health and education
Responsibilty for child rearing
Resources that they have will determine whether the cycle of transmission of poverty from generation to generation will be broken
Transmit Values to the next generation
Empower and invest in women → make biggest impact on development
3 Objectives of Development
To increase the availability and widen the distribution of basic life-sustaining goods such as food, shelter, health, and protection
To raise levels of living, including, in addition to higher incomes, the provision of more jobs, better education, and greater attention to cultural and human values, all of which will serve not only to enhance material well-being but also to generate greater individual and national self-esteem
To expand range of economic and social choices choices available to individuals and nations by freeing them from servitude and dependence, not only in relation to other people and nation-states, but also to the forces of ignorance and human misery
Development is both a physical reality and a state of mind in which society has (w/ combination of social, economic, and institutional processes) secured the means of obtaining a better life.
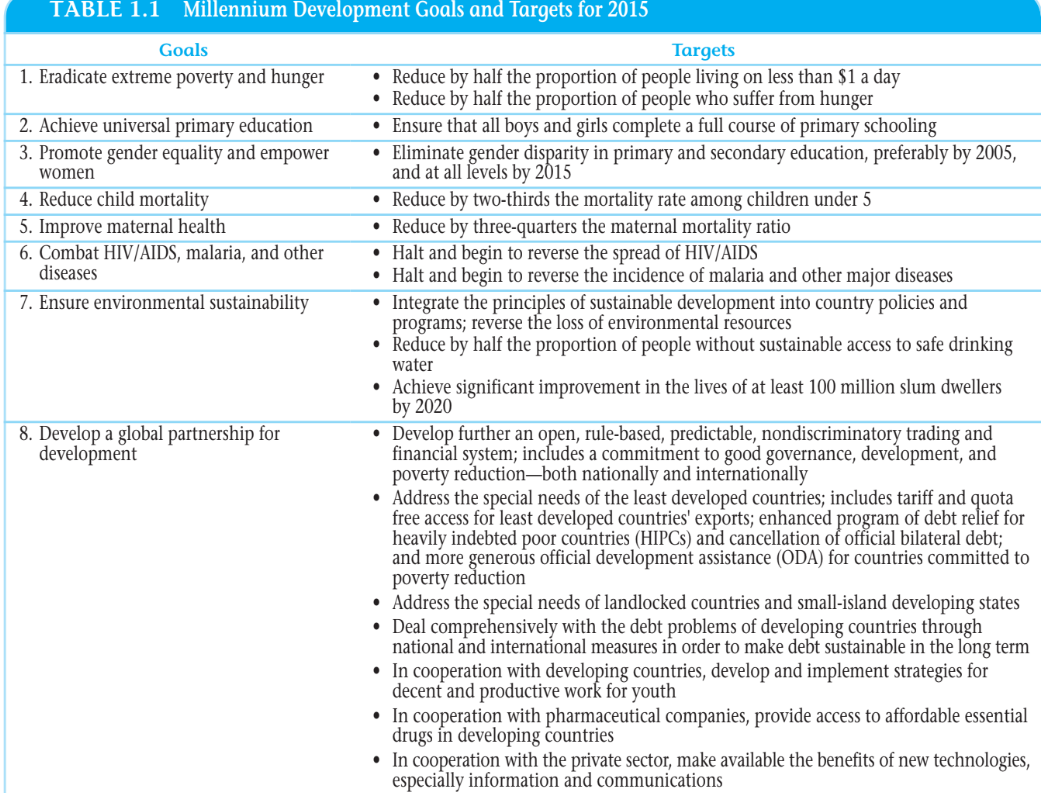
The Future of the Millennium Development Goals
8 Millennium Development Goals
Strongest statement yet of the international commitment to ending global poverty
Achieving the MDGs will be an important milestone on the long journey to sustainable and just development
Sector
A subset (part) of an economy, with four usages in economic development: technology (modern and traditional sectors); activity (industry or product sectors); trade (export sector); and sphere (private and public sectors)
From MDGs to SDGs:
Leave no one behind—to move “from reducing to ending extreme poverty, in all its forms;” in particular, to “design goals that focus on reaching excluded groups.”
Put sustainable development at the core, “to integrate the social, economic and environmental dimensions of sustainability.”
Transform economies for jobs and inclusive growth, while moving to sustainable patterns of work and life.
Build peace and effective, open, and accountable institutions for all, which “encourage the rule of law, property rights, freedom of speech and the media, open political choice, access to justice, and accountable government and public institutions.”
Forge a new global partnership so that each priority should involve governments and also others, including people living in poverty, civil society and indigenous and local communities, multilateral institutions, business academia, and philanthropy.
Sustainable Development Goals (SDGs) 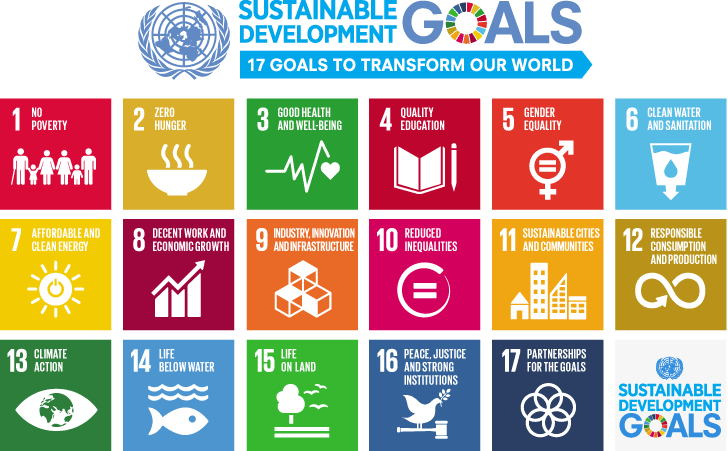
[Canvas/DBs notes]
SDGs: From paper to practice
2030 agenda is a composition of intertwined social economic and environmental goals and targets that requires a new way of thinking about development
MAPS (Mainstreaming, Acceleration, and Policy Making)
Mainstreaming
Making the 17 goals a part of people’s lives by including them in national and local policies, action plans, and budgets
Raising public awareness and engaging with civil society businesses
Establishing practices for monitoring and reporting securing financing for the agenda
Acceleration
Action to support women and girls in Parliament that will also boost local economies enable safe for childbirth and build more inclusive communities
Policy Making
Reaches across all aspects of development, education, jobs, local governance, healthcare, biodiversity, and clean energy to support SDG implementation
Sustainable Development Goals
Most comprehensive agendas for the world.
Fight against extreme poverty and give attention to the limitation of global resources and its fair distribution
Achieving economic, social, and environmental sustainability
The 2030 SDGs further develop the understanding of global sustainable development laid out in the 1987 published book titled Our Common Future. There are 2 important points:
Importance of intergenerational equity
Don’t lower potential living standards of future generations
Sustainable development must consider economic, environmental, and social sustainability
Social Sustainability = Human rights are respected
Environmental Sustainability = Increase in economic growth that does not have a negative impact on the natural and social capitals
Economic Sustainability = Human demand for resources is brought to and maintained within the global supply of these resources.
Poverty, Inequality, and Development |
|---|
Extreme poverty remains widespread in the developing world = Need for Higher Gross National Income and Sustained Growth
Measuring Inequality
2 principal Measures of Income Distribution
Personal or Size Distribution of Income
Individual persons or households and the total incomes they receive
What matters is how much each earns irrespective of whether the income is derived solely from employment or comes also from other sources such as interest, profits, rents, gifts, or inheritance
The distribution of income according to size class of persons
Share of total income accruing to the poorest specific percentage or the richest specific percentage of a population without regard to the sources of that income
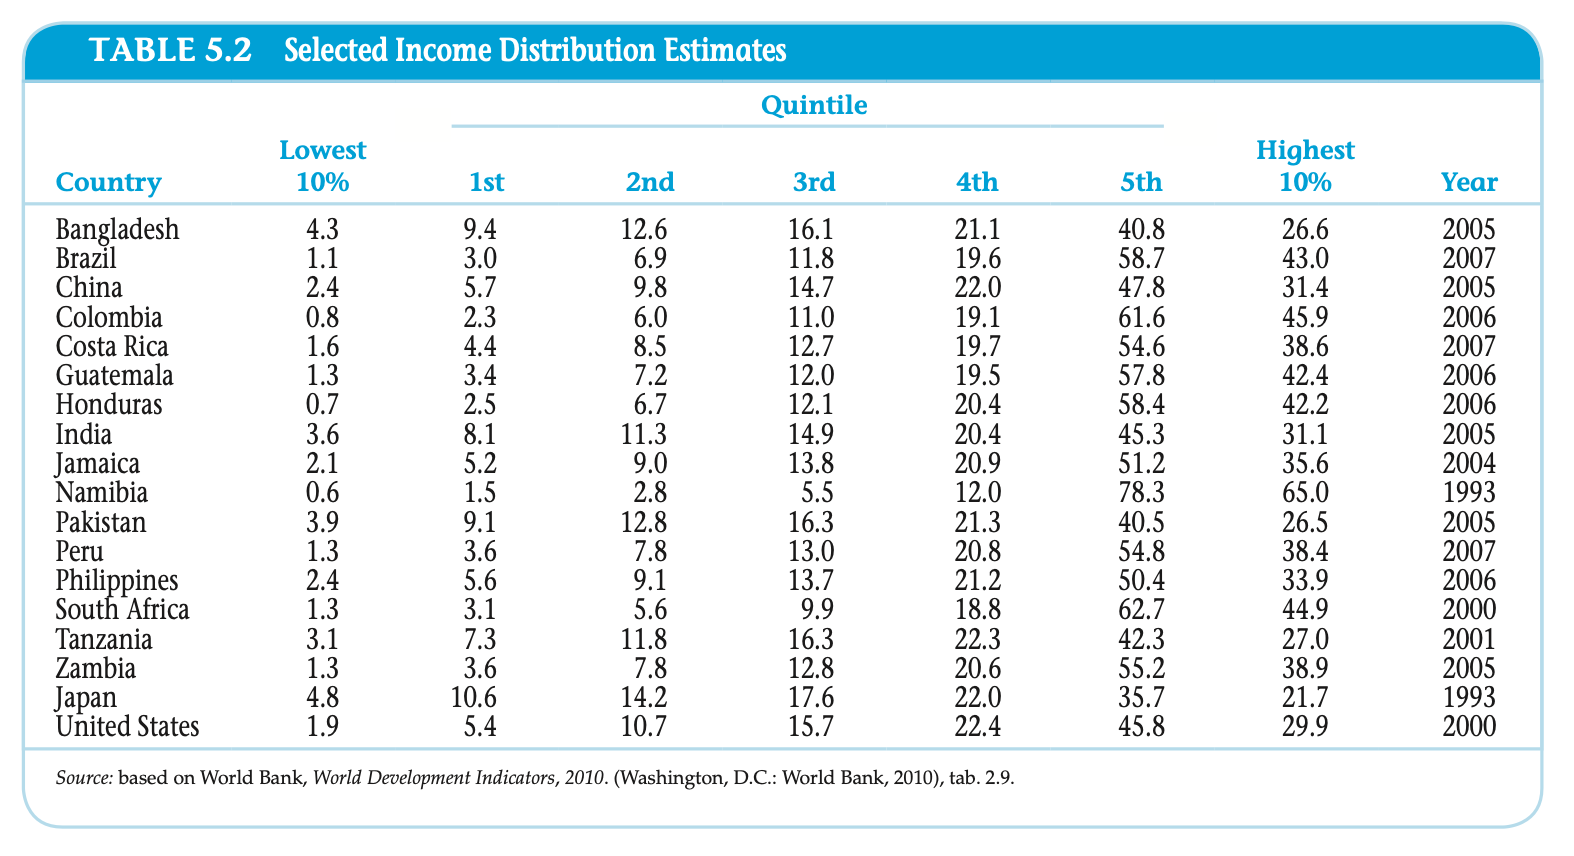
Quintile
20% proportion of any numerical quantity
A population divided into quintiles would be divided into 5 groups of equal size
Decile
10% portion of any numerical quantity
A population divided into deciles would be divided into 10 equal numerical groups
Functional or Distributive factor share of Income (on page 11)
Income Inequality
Economists and Statisticians like to arrange individuals by ascending personal incomes
Income Inequality
The disproportionate distribution of total national income among households
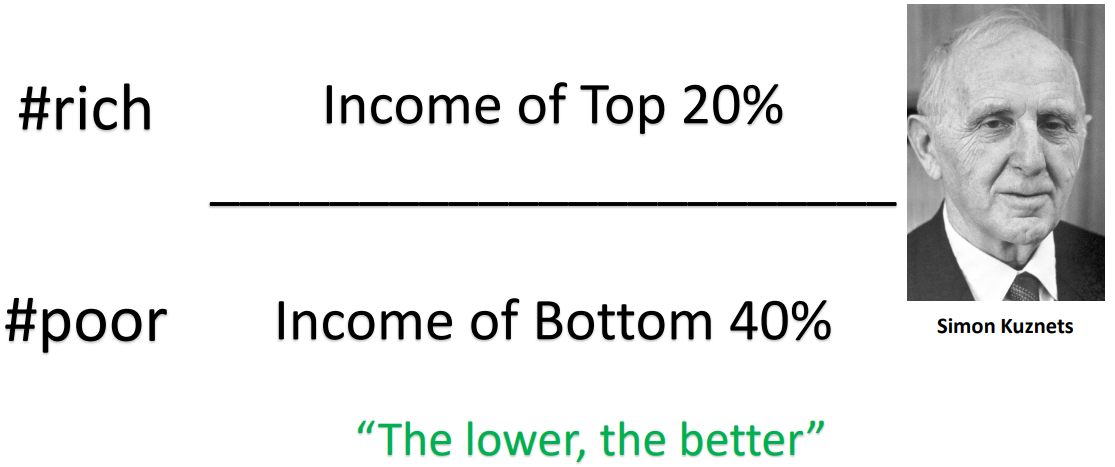
Kuznets Ratio
Used as a measure of the degree of inequality between high and low income groups in a country
The lower, the better
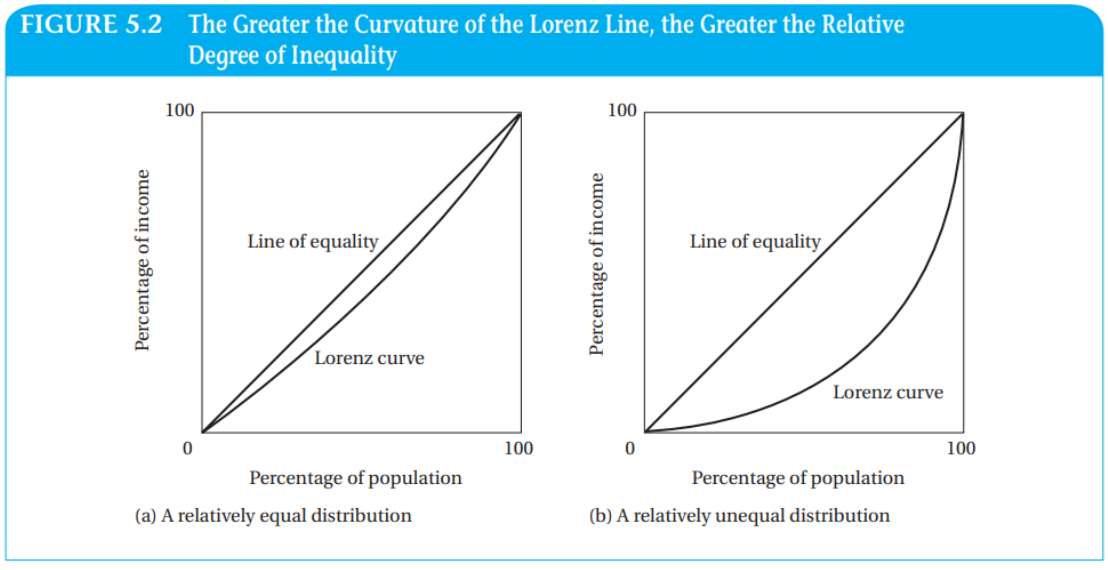
Lorenz Curve
A graph depicting the variance of the size distribution of income from perfect equality
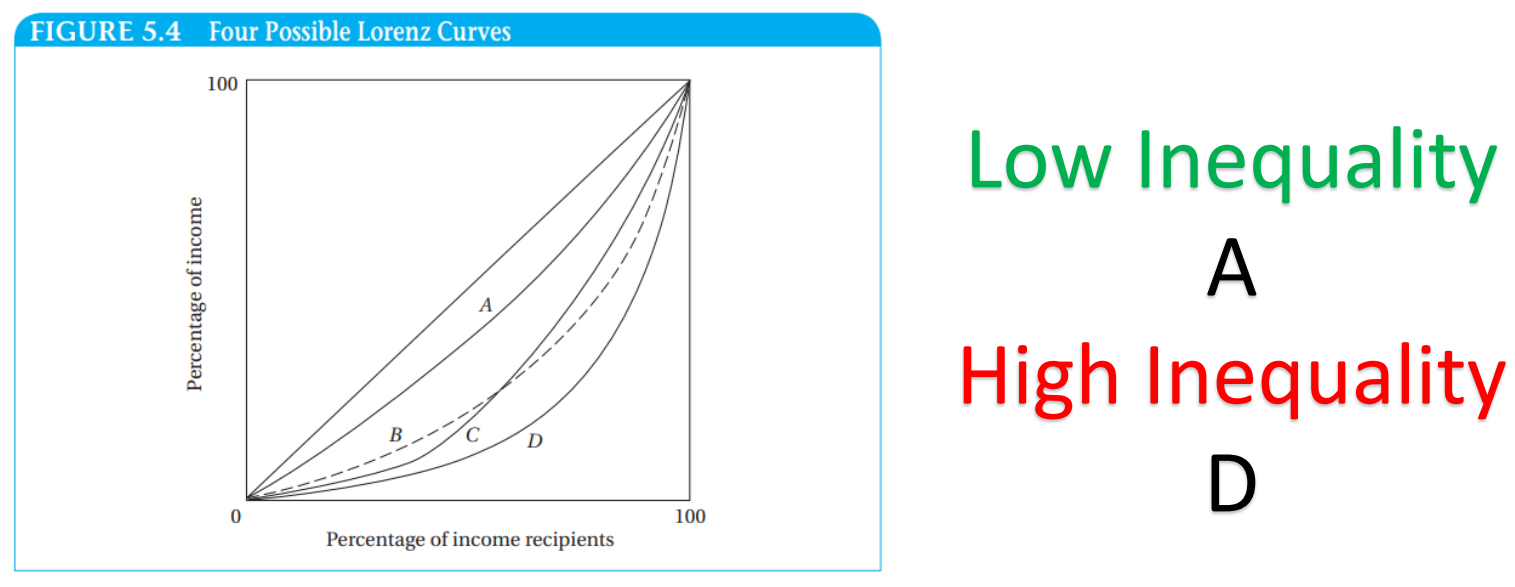
The more the Lorenz line curves away from the diagonal line the greater the degree of inequality
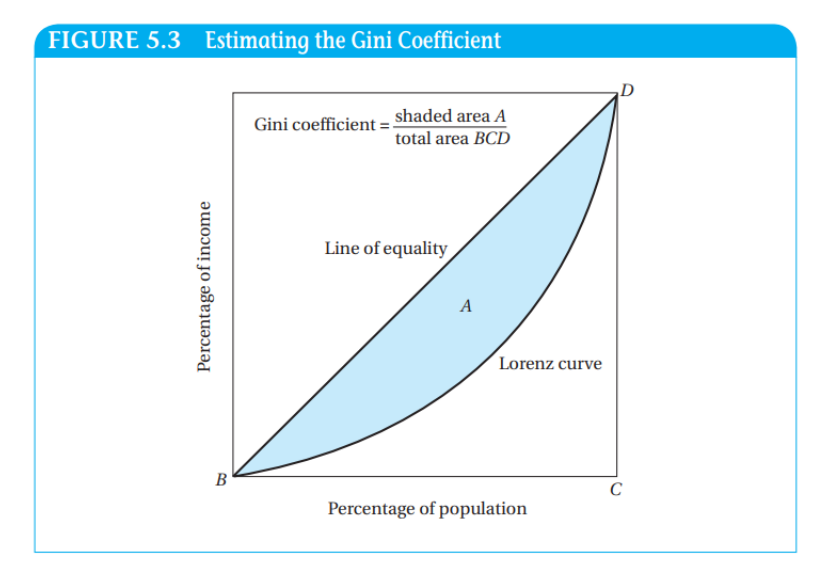
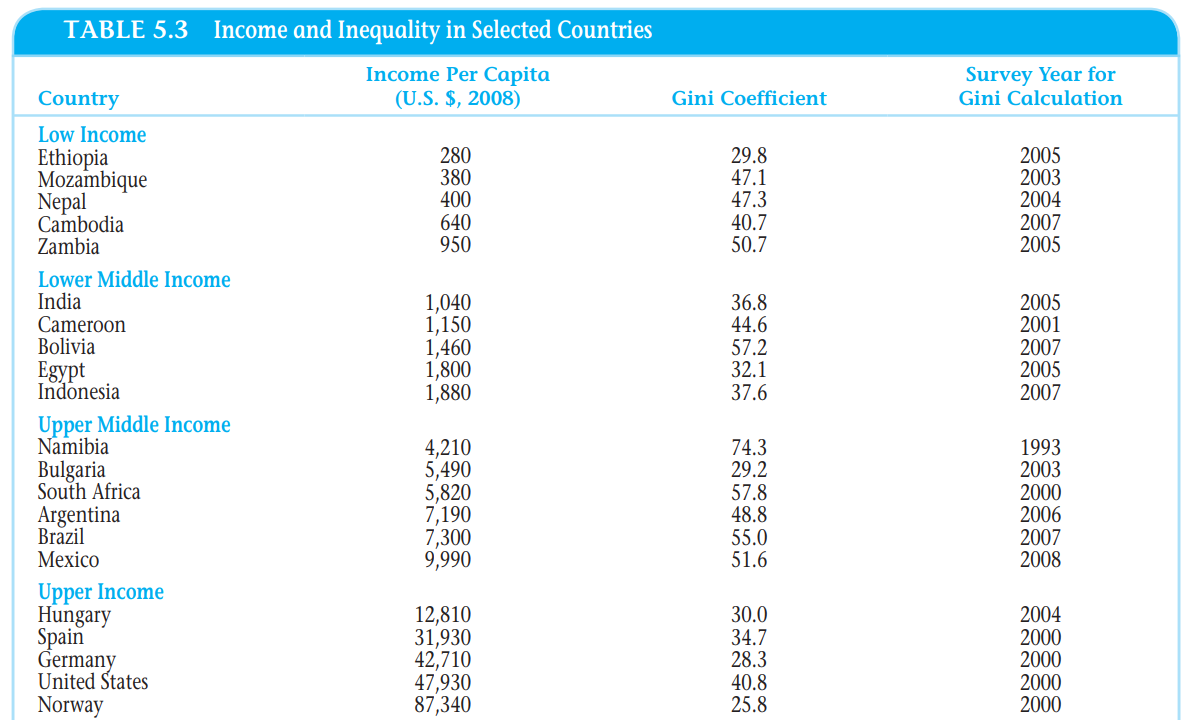
Gini Coefficient and Aggregate Measures of Inequality
Aggregate numerical measure of income inequality ranging from 0 (perfect equality) to 1 (perfect inequality)
Measured graphically by dividing the area between the perfect equality line and the Lorenz curve by the total area lying to the right of the equality line
High Gini = Higher Inequality; Lower Gini = more equal the distribution of income
Gini coefficient for countries with highly unequal income distributions typically lies between 0.50 and 0.70, while for countries with relatively equal distributions, it is on the order of 0.20 to 0.35
Gini coefficient is among a class of measures that satisfy four highly desirable properties:
Desirable Property of Measure 1: Anonymity
Measure of inequality should not depend on who has the higher income
It should not depend on whether we believe that the rich or poor to be good or bad people
Desirable Property of Measure 2: Scale Independence
Should not depend on the size of the economy or the way we measure its income
Our inequality measure should not depend on whether we measure income in dollars or in cents or in rupees or rupiahs or for that matter on whether the economy is rich on average or poor on average—because if we are interested in inequality, we want a measure of the dispersion of income, not its magnitude (inequality = measure of dispersion of income not magnitude)
Desirable Property of Measure 3: Population Independence Principle
Should not be based on the number of income receipts
For example, the economy of China should be considered no more or less equal than the economy of Vietnam simply because China has a larger population than Vietnam.
Desirable Property of Measure 4: Transfer Principle
Also called as Pigou-Dalton principle
If we transfer some income from a richer person to a poorer person, the resulting new income distribution is more equal
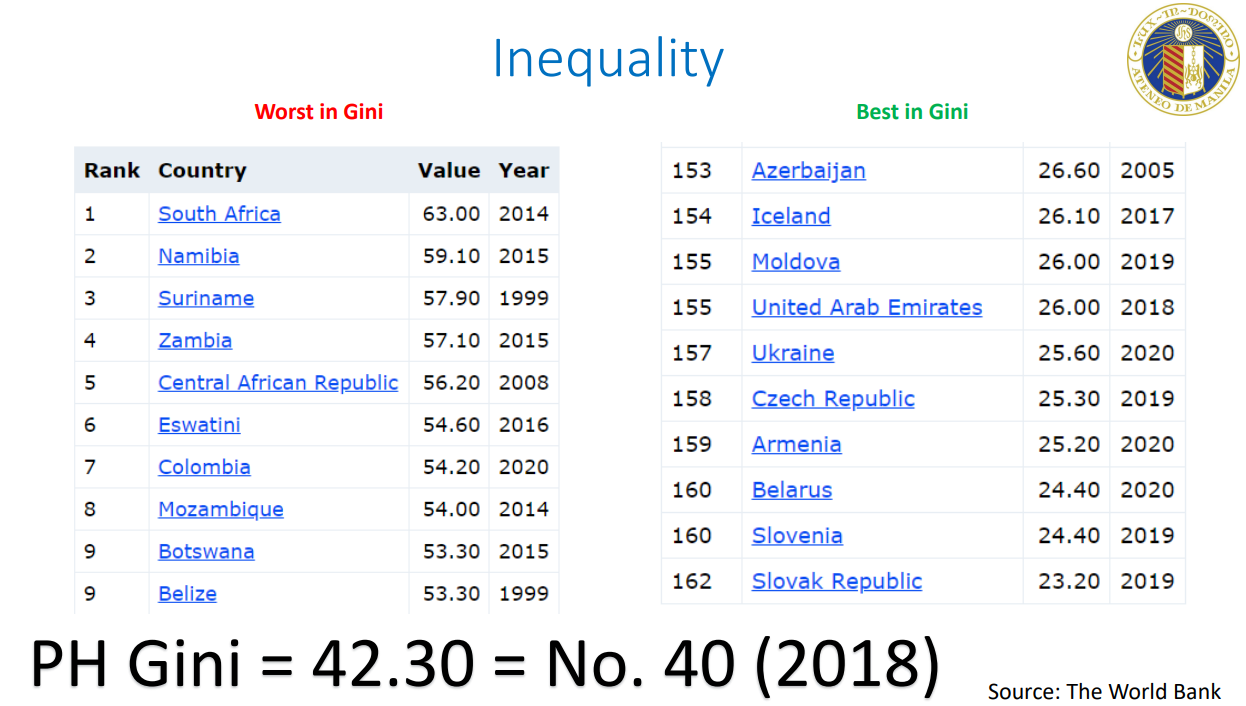
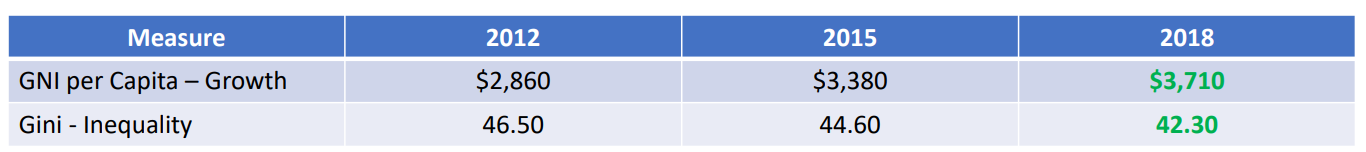
Gini in Numbers (World and Philippines’ standing)
PH Gini = 42.30
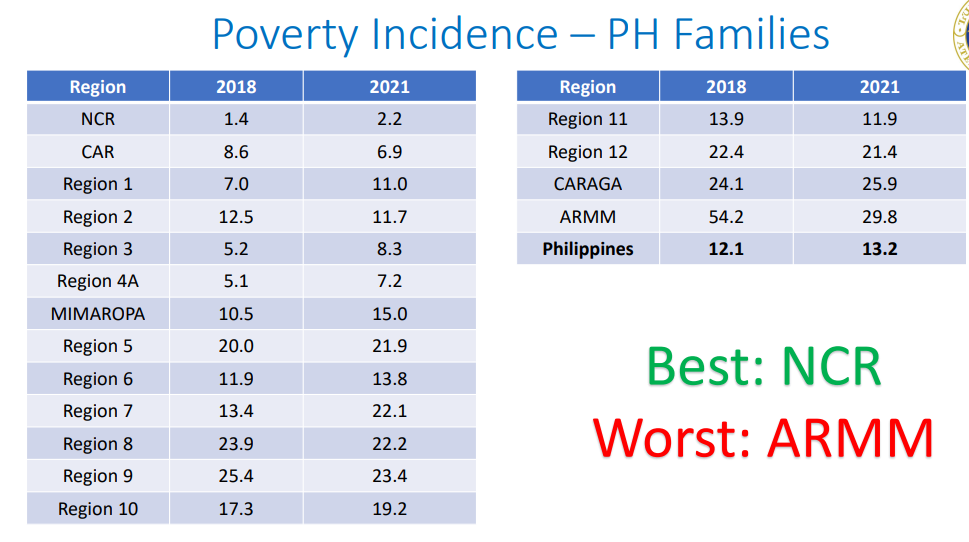
Average annual family income in regions
Highest: NCR
Lowest: ARMM
Gini concentration ratio by region
Best: NCR
Worst: Regions 7, 8, 10, 12
2. Functional or Factor Share Distribution of Income
The distribution of income to factors of production without regard to the ownership of the factors
Attempts to explain the share of total national income that each of the factors of production receives
Instead of looking at individuals as separate entities, the theory of functional income distribution inquires into the percentage that labor receives as a whole and compares this with the percentages of total income distributed in the form of rent, interest, and profit (i.e., the returns to land and financial and physical capital).
Factors of Production
Resources or inputs required to produce a good or service
Scarce Factor | Price |
|---|---|
Labor (Factor of P) | Wage |
Land | Rent |
Capital (Factor of P) | Interest/Rent |
Entrepreneurship | Profit |
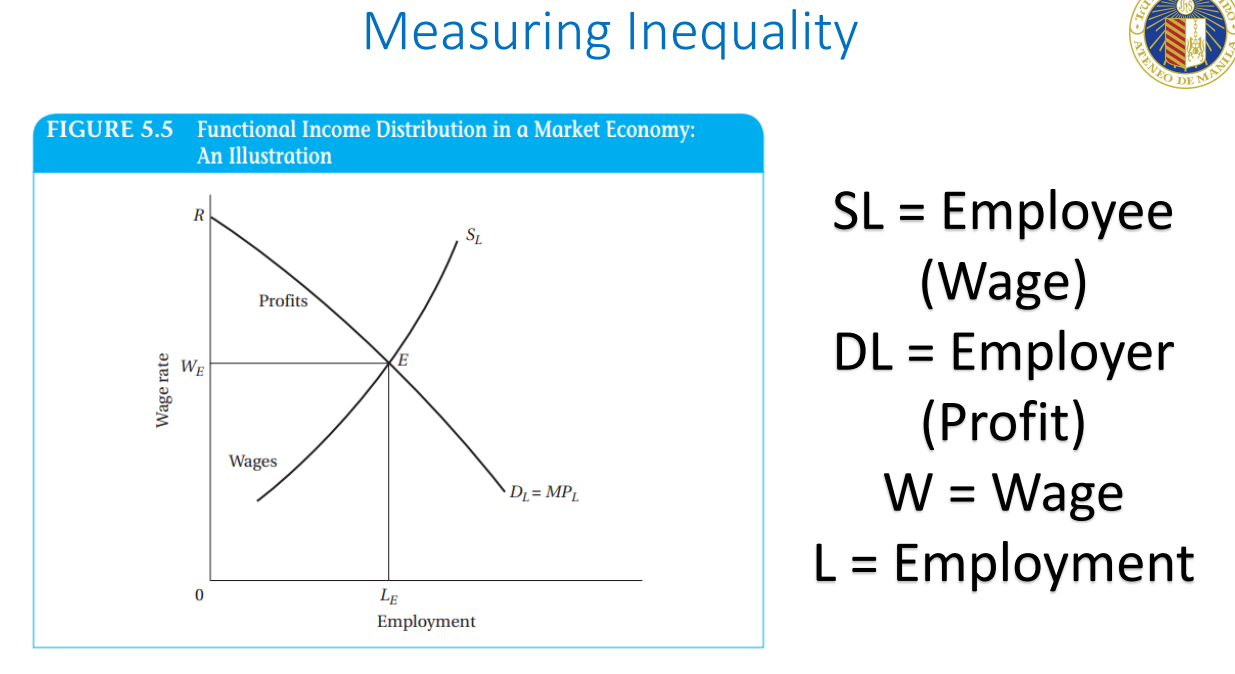
Criticism of Functional Theory
Doesn’t take into account non-market forces
Collective bargaining between employers and trade unions in the setting of modern-sector wage rates
Power of rich people to manipulate prices
Absolute Poverty
The situation of being unable or only barely able to meet the subsistence essentials of food, clothing and shelter
They are counted as the total number living below a specified minimum level of real income—an international poverty line.
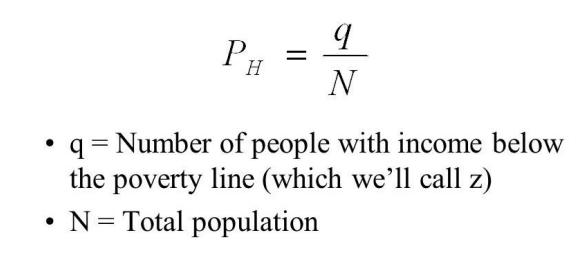
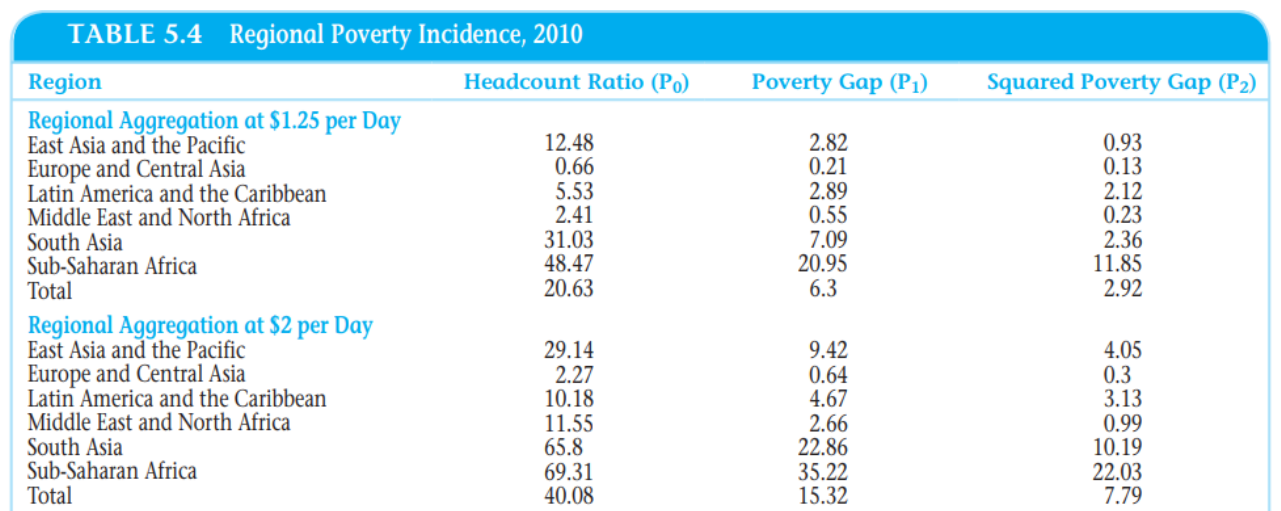
Headcount Index
Proportion of a country’s population living below the poverty line
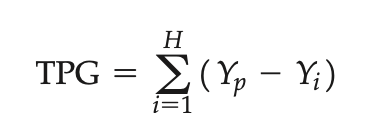
Total Poverty Gap (TPG)
The sum of the difference between the poverty line and actual income levels of all people living below that line
Economists therefore attempt to calculate a total poverty gap (TPG) that measures the total amount of income necessary to raise everyone who is below the poverty line up to that line
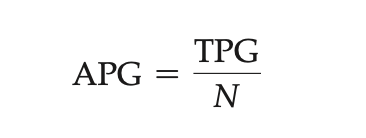
Another Poverty Gap measures are the following:
Average Income Shortfall (AIS)
Formula: Total Poverty Gap/Headcount of the Poor
Meaning: Average amount by which the income of a poor person falls below the poverty line
Normalized Income Shortfall (NIS)
Formula: Average Income Shortfall/Income of the Poor
What’s so bad about Extreme Inequality?
We have seen that inequality among the poor is a critical factor in understanding the severity of poverty and the impact of market and policy changes on the poor, but why should we be concerned with inequality among those above the poverty line?
Extreme inequality leads to economic inefficiency
The higher the inequality is, the smaller the fraction of the population that qualifies for a loan or other credit (lack of collateral)
Landlords, business leaders, politicians, and other rich elites are known to spend much of their incomes on imported luxury goods, gold, jewelry, expensive houses, and foreign travel or to seek safe havens abroad for their savings in what is known as capital flight.
Such savings and investments do not add to the nation’s productive resources; in fact, they represent substantial drains on these resources.
Extreme income disparities undermine social stability and solidarity
High inequality strengthens the political power of the rich and their economic bargaining power
Makes poor institutions very difficult to improve
Injustice/Unfair
W = W (Y, I, P)
W = Welfare
Y = Income per capita and enters our welfare function positively
I = Inequality and enters negatively
P = absolute poverty
Y, I, P = have distinct significance and we need to consider all three elements to achieve an overall assessment of welfare in developing countries
Dualistic Development and Shifting Lorenz Curves: Some Stylized Typologies
As introduced by Gary Fields, Lorenz curves may be used to analyze three limiting cases of dualistic development:
Cases of Dualistic Development
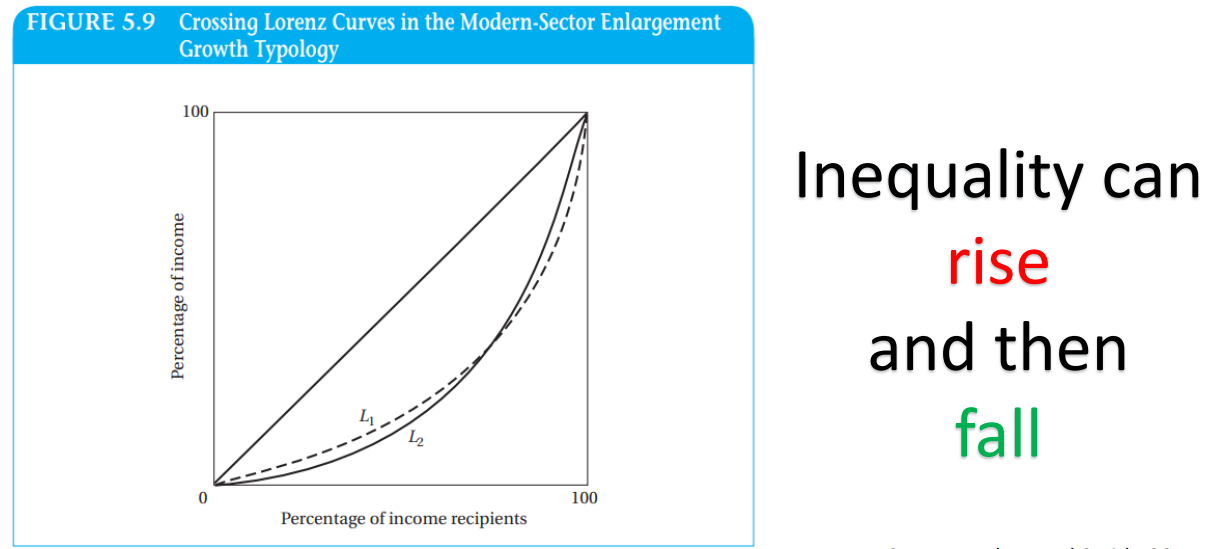
Modern-Sector Enlargement | Two-sector economy develops by enlarging the size of its modern sector while maintaining constant wages in both sectors Example: It corresponds roughly to the historical growth pattern of Western developed nations and, to some extent, the pattern in East Asian economies such as China, South Korea, and Taiwan |
|---|---|
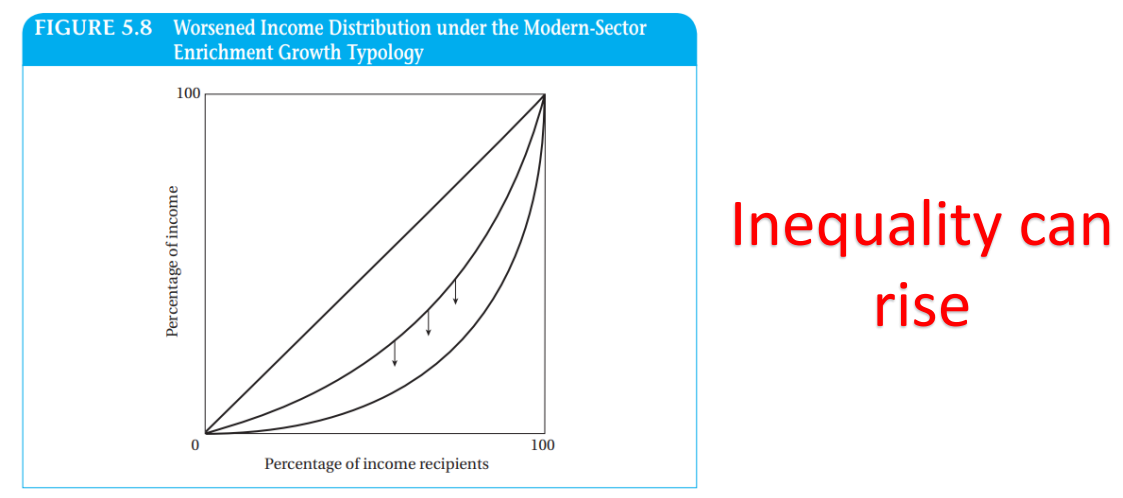
Modern-Sector Enrichment | The economy grows but such growth is limited to a fixed number of people in the modern sector, with both the numbers of workers and their wages held constant in the traditional sector. Example: Latin America, Africa |
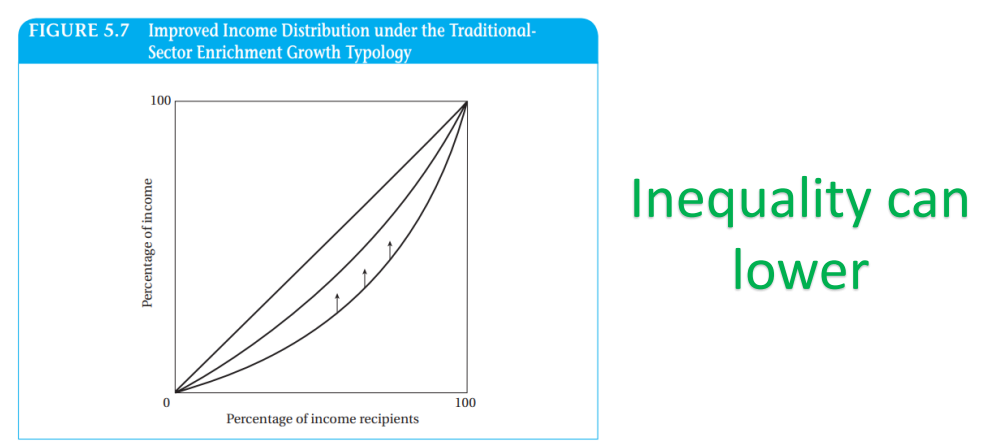
Traditional-Sector Enrichment | All of the benefits of growth are divided among traditional-sector workers, with little or no growth occurring in the modern sector. Example: Experiences of countries whose policies focused on achieving substantial reductions in absolute poverty even at low incomes and relatively low growth rates (Sri Lanka, Kerala in southwestern India) |
Using these three special cases and Lorenz curves, Fields demonstrated the validity of the following propositions (reversing the order just presented):
Traditional-Sector Enrichment = growth results in higher income, more equal relative distribution of income, and less poverty
Modern-Sector Enrichment = higher income, less equal relative distribution of income, and no change in poverty
Modern-Sector Enlargement = absolute incomes rise, and absolute poverty is reduced. This style of growth experience is predominant, inequality is likely first to worsen in the early stages of development and then to improve.
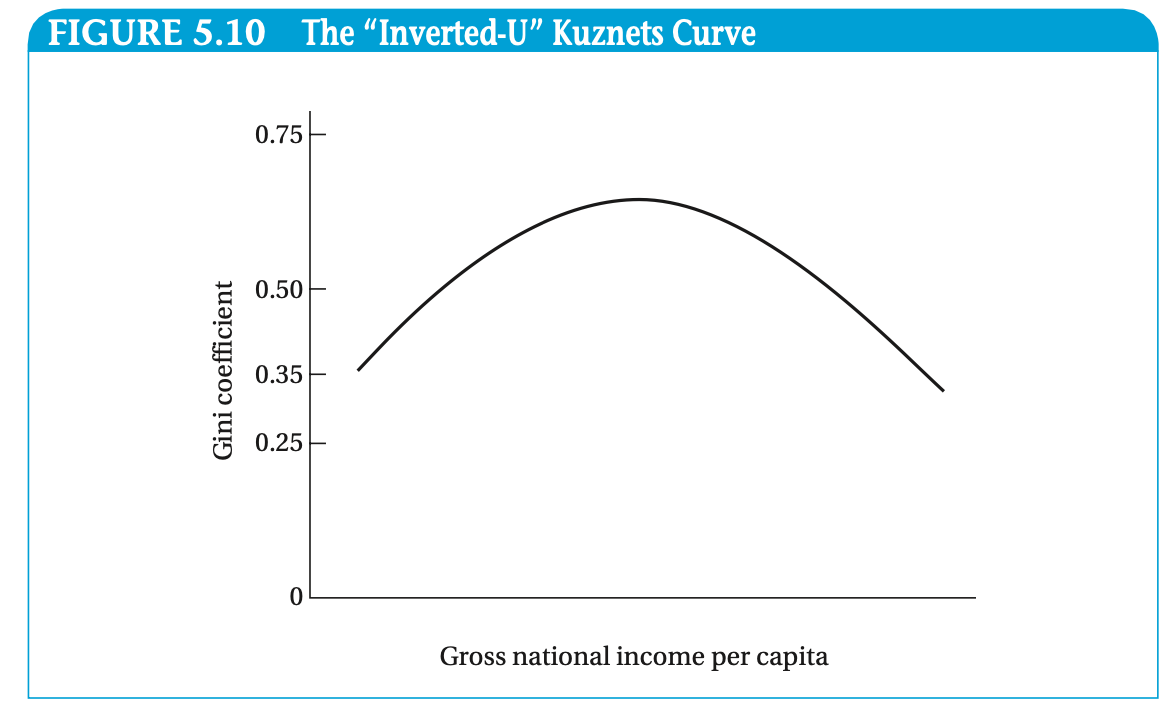
Kuznet’s Inverted U-Hypothesis
Kuznet’s Curve
A graph reflecting the relationship between a country’s income per capita and its inequality of income distribution
Philippines vis-à-vis the Kuznets Curve
Philippines
Bottom 40% → 16.8%
Top 10% → 31.3 %
Slight improvement from 2010 to 2019
Growth and Inequality
Grow GDP + Share GDP
Character of Economic Growth
The distributive implications of economic growth as reflected in such factors as participation in the growth process and asset ownership
Degree to which that growth is or is not reflected in improved living standards for the poor
Absolute Poverty: Extend and Magnitude
Extreme Poverty is uneven in the developing world
There is great disparity among developing nations
Poverty Lines
International Poverty Line → Person living on less than USD 1.90 daily
Philippines Poverty Line → Family of 5 living on less than PHP 12, 030 monthly
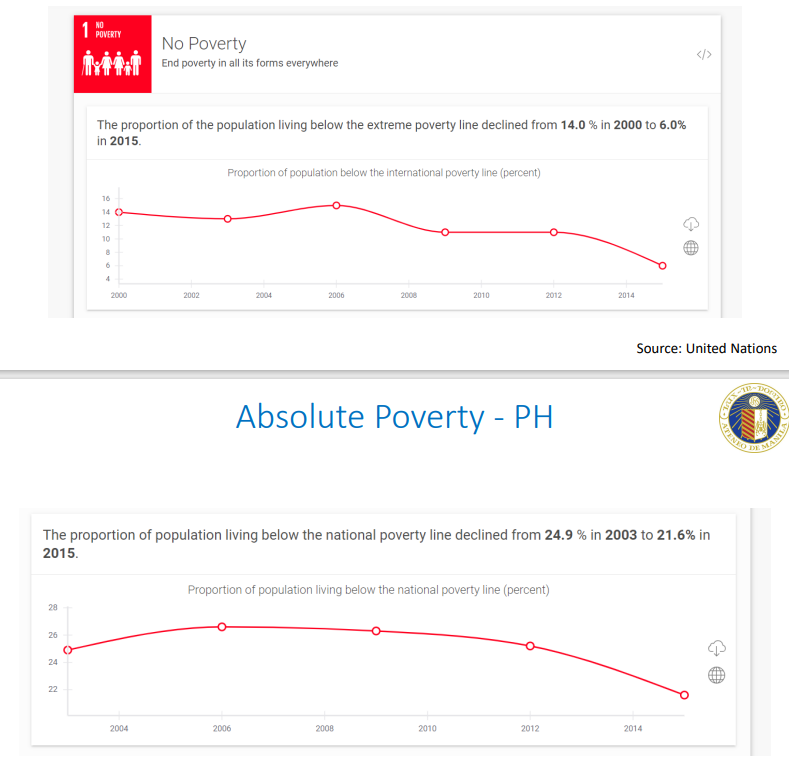
[Philippines] 2021 Official Poverty Statistics
Filipino family with five members needed around 12, 030 on average (per month) to meet their basic food and non-food needs
Food Threshold: PHP 8379
18.1% of Filipinos were poor in 2021, which translates to 19.99 million poor filipinos
13.2% of Filipino families were poor in 2021, which translates to 3.50 million poor Filipino families
Poverty Incidence – PH families
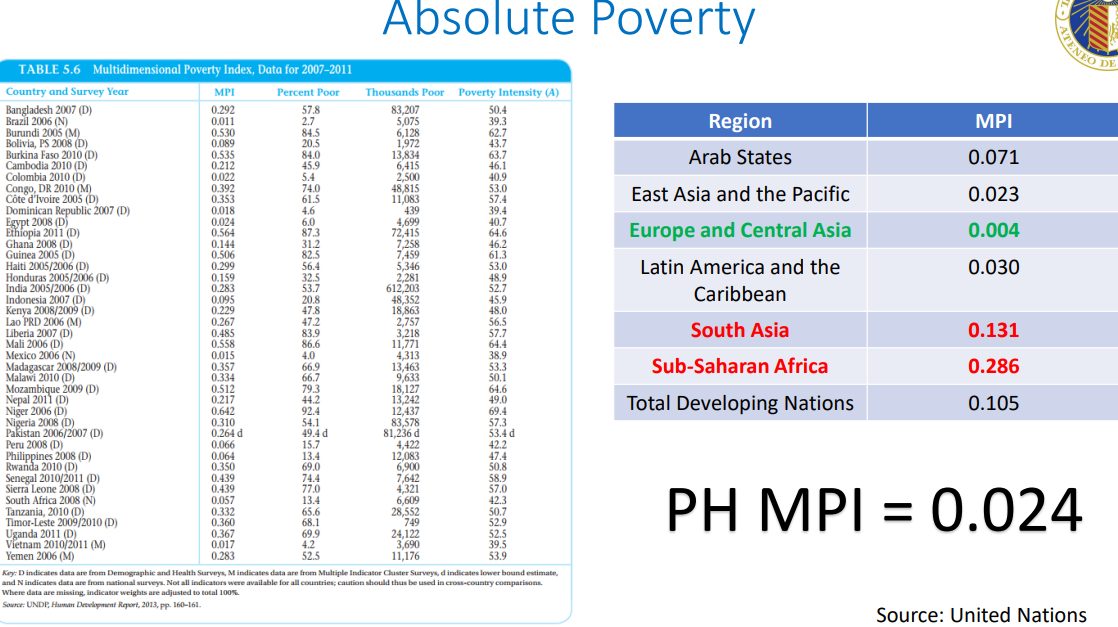
Multidimensional Poverty Index (MPI)
A poverty measure that identifies the poor using dual cutoffs for levels and numbers of deprivations, and then multiplies the percentage of people living in poverty times the percent of weighted indicators for which poor households are deprived on average.
It is determined if we reach the poorest of the poor by squaring the poverty gap.
The MPI takes into account that there are negative interaction effects when people have multiple deprivations—worse poverty than can be seen by simply adding up separate deprivations for the whole country, then taking averages, and only then combining them
It incorporates three dimensions at the household level: health, education, and wealth/standard of living.
Health
Whether any child has died in the family
Whether any adult or child in the family is malnourished
Education
Whether not even one household member has completed five years of schooling
Whether any school-age child is out of school for grades one through eight—are given equal weight
Standard of living
Equal weight is placed on six deprivations (each counting one-eighteenth toward the maximum possible): lack of electricity, insufficiently safe drinking water, inadequate sanitation, inadequate flooring, unimproved cooking fuel, and lack of more than one of five assets—telephone, radio, television, bicycle, and motorbike or similar vehicle
Limitations of MPI
Data are from the household rather than individual level
Does not fully distinguish between past and present conditions
Does not distinguish differences within households
Education considers only inputs such as enrolling or attending for five years, not outputs such as being able to read.
Chronic Poverty
Research suggests that approximately 1/3 of all people who are income poor at any one time are chronically (always) poor
How to end poverty?
Economic Growth – shared and sustainable
Poverty Programs – resources and quality
Growth and Poverty
Traditionally, a body of opinion held that rapid growth is bad for the poor because they would be bypassed and marginalized by the structural changes of modern growth.
There had been considerable concern in policy circles that the public expenditures required for the reduction of poverty would entail a reduction in the rate of growth.
There are at least five reasons why policies focused toward reducing poverty levels need not lead to a slower rate of growth—and indeed could help to accelerate growth.
Widespread poverty creates conditions in which the poor have no access to credit
Unable to finance their children’s education
In the absence of physical or monetary investment opportunities, have many children as a source of old-age financial security
Lack of credit denies people living in poverty of opportunities for entrepreneurship that could help to spur growth
The rich in many contemporary poor countries are generally not noted for their frugality or for their desire to save and invest substantial proportions of their incomes in the local economy
ChatGpt explanation: Despite having substantial wealth, rich people in these countries do not necessarily contribute significantly to the economic development and growth of their own nation.
Low incomes and low levels of living for the poor, which are manifested in poor health, nutrition, and education, can lower their economic productivity and thereby lead directly and indirectly to a slower-growing economy.
Raising the income levels of the poor will stimulate an overall increase in the demand for locally produced necessity products like food and clothing, whereas the rich tend to spend more of their additional incomes on imported luxury goods.
Rising demand for local goods provides a greater stimulus to local production, local employment and local investment
Reduction of mass poverty can stimulate healthy economic expansion by acting as a powerful material and psychological incentive to widespread public participation in the development process
Economic Characteristics of High-Poverty Groups
Magnitude of Absolute Poverty results from a combination of low per capita income and highly unequal distributions of that income
Rural Poverty
[PPT]: Poverty is in rural areas, but government spends more in urban areas
They are disproportionately located in rural areas
Primarily engaged in agricultural and associated activities, that they are more likely to be women and children than adult males
Often concentrated among minority ethnic groups and indigenous people
About two-thirds of the very poor scratch out their livelihood from subsistence agriculture either as small farmers or as low-paid farmwork; the remaining one-third are engaged in petty services
Majority of government expenditures in most developing countries over the past several decades has been directed toward the urban area and especially toward the relatively affluent modern manufacturing and commercial sectors.
Whether in the realm of directly productive economic investments or in the fields of education, health, housing, and other social services, this urban modern-sector bias in government expenditures is at the core of many of the development problems
Women and Poverty
[PPT]: Women make up a substantial majority of the world’s poor (50% of extreme poor population)
Women and children experience the harshest deprivation
Have less access to education, formal-sector employment, social security, and government employment programs
Women in female-headed households have less education and lower incomes. Furthermore, the larger the household is, the greater the strain on the single parent and the lower the per capita food expenditure
Women are often paid less for performing similar tasks
In urban areas, women are much less likely to obtain formal employment in private companies or public agencies
Similarly, rural women have less access to the resources necessary to generate stable incomes and are frequently subject to laws that further compromise earning potential.
Legislation and social custom often prohibit women from owning property or signing financial contracts without a husband’s signature.
With a few notable exceptions, government employment or income-enhancing programs are accessible primarily if not exclusively by men, exacerbating existing income disparities between men and women
Higher proportion of female-headed households are situated in the poorest areas, which have little or no access to government-sponsored services such as piped water, sanitation, and health care, household members are more likely to fall ill and are less likely to receive medical attention.
Household income is a poor measure of individual welfare because the distribution of income within the household may be quite unequal.
Women’s control over household resources may also be constrained by the fact that many women from poor households are not paid for the work they perform in family agriculture or business.
To improve living conditions for the poorest individuals, women must be drawn into the economic mainstream.
Increase female participation rates in educational and training programs
Precautions must be taken to ensure schooling, services, employment, and social security programs.
Legalizing informal-sector employment where the majority of the female labor force is employed would also improve the economic status of women.
The consequences of declines in women’s relative or absolute economic status have both ethical and long-term economic implications
Low status of women is likely to translate into slower rates of economic growth
Educational attainment and future financial status of children are much more likely to reflect those of the mother than those of the father.
“Add women and stir”
Ethnic Minorities, Indigenous Populations, and Poverty
[PPT] 370 million globally; 15% of extreme poor population
40% of the world’s nation-states have more than five sizable ethnic populations, one or more of which faces serious economic, political, and social discrimination.
Majority of indigenous groups live in extreme poverty and that being indigenous greatly increases the chances that an individual will be malnourished, illiterate, in poor health, and unemployed
Poor Countries
Poor come from poor countries
Many of the poorest countries in sub-Saharan Africa experienced outright declines in per capita income throughout the 1980s and 1990s and in some cases during the first decade of this century
Brazil, which has been solidly middle-income for decades, still has 8% of its population living on less than $1.25 per day
Higher national incomes greatly facilitate poverty reduction, while at the same time, poverty still needs to be addressed directly
Policy Options on Income Inequality and Poverty: Some Basic Considerations
Four broad areas of possible government policy intervention, which correspond to the following four major elements in the determination of a developing economy’s distribution of income.
Altering the functional distribution
Returns to labor, land and capital as determined by factor prices, utilization levels and the consequent shares of national income that accrue to the owners of each factor.
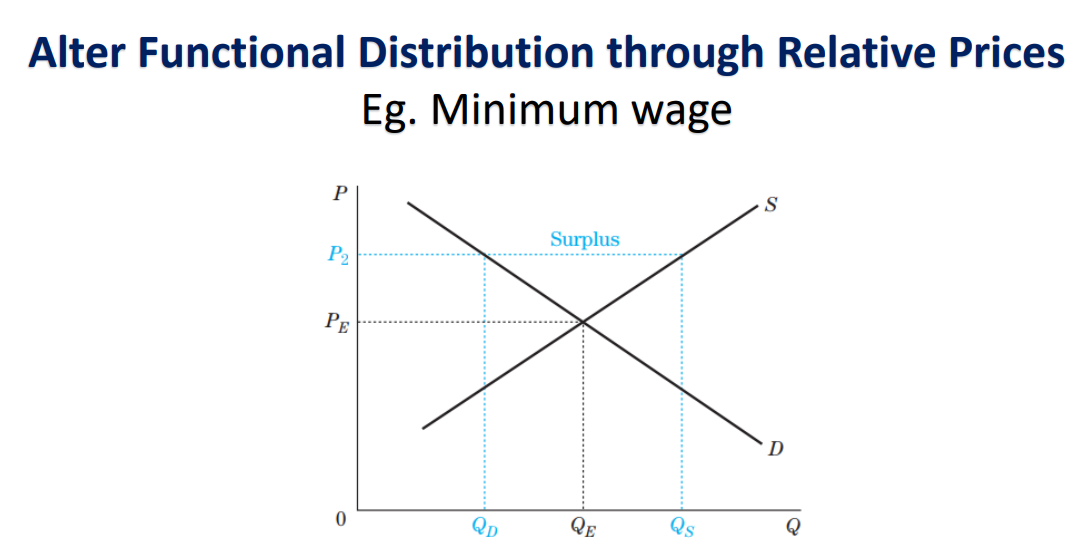
Traditional Economic Approach
As a result of institutional constraints and faulty government policies, the relative price of labor in the formal, modern, urban sector is higher than what would be determined by the free interplay of the forces of supply and demand.
For example, the power of trade unions to raise minimum wages to artificially high levels (higher than those that would result from supply and demand) even in the face of widespread unemployment is often cited as an example of the “distorted” price of labor.
Mitigating the size distribution
The functional income distribution of an economy translated into a size distribution by knowledge of how ownership and control over productive assets and labor skills are concentrated and distributed throughout the population. The distribution of these asset holdings and skill endowments ultimately determines the distribution of personal income.
Asset Ownership
The ownership of land, physical capital, human capital and financial resources that generate income for owners
Retribution from Growth (Get from Rich → Give to Poor)
Governments at least in developing countries that are growing could facilitate the transfer of a certain proportion of annual savings and investments to low-income groups so as to bring about a more gradual and perhaps politically more acceptable redistribution of additional assets as they accumulate over time
Human capital in the form of education and skills is another example of the unequal distribution of productive asset ownership.
Public policy should therefore promote wider access to educational opportunities (for girls as well as boys) as a means of increasing income-earning potential for more people.
Redistribution Policies
Policies geared to reducing income inequality and expanding economic opportunities in order to promote development, includng income tax policies, rural development policies, and publicly financed services.
Reduce poverty and inequality to focus directly on reducing the concentrated control of assets, the unequal distribution of power, and the unequal access to educational and income-earning opportunities that characterize many developing countries
Land Reform
A deliberate attempt to reorganize and transform existing agrarian systems with the intention of improving the distribution of agricultural incomes and thus fostering rural development.
Land reform may be a weak instrument of income redistribution if other institutional and price distortions in the economic system prevent small farm holders from securing access to much needed critical inputs such as credit, fertilizers, seeds, marketing facilities, and agricultural education.
Moderating (reducing) the size distribution at the upper levels
Progressive taxation of personal income and wealth
Taxation increases government revenues that decrease the share of disposable income of the very rich — revenues that can, with good policies, be invested in human capital and rural and other lagging infrastructure needs, thereby promoting inclusive growth
Disposable income → income that is available to households for spending and saving after personal income taxes have been deducted.
Formula: Personal Income - (Payable Taxes - Other Deductions)
Moderating (increasing) the size distribution at the lower levels
Public expenditures of tax revenues to raise the incomes of the poor either directly (conditional or unconditional cash transfers) or indirectly (e.g., through public employment creation such as local infrastructure projects or the provision of primary education and health care).
Raise the real income levels of the poor above what their personal income levels would otherwise be
Progressive Income and Wealth Taxes
Any national policy attempting to improve the living standards of the bottom 40% must secure sufficient financial resources to transform paper plans into program realities
Direct Progressive Income Taxes
Tax whose rate increases with increasing personal incomes
In other words, as individuals or businesses earn more money, they are required to pay a higher percentage of their income in taxes.
Regressive Taxes
Tax structure in which the ratio of taxes to income tends to decrease as income increases
In practice, lower and middle-income groups often end up paying a proportionally larger share of their incomes in taxes than the upper-income groups
Tax rate decreases as the income or wealth of the taxpayer increases; Regressive taxes tend to place a heavier burden on lower-income individuals or households compared to higher-income ones
Indirect taxes
Taxes levied on goods ultimately purchased by consumers, including customs duties (tariffs), excise duties, sales taxes, and export duties
By contrast, the rich derive by far the largest part of their incomes from the return on physical and financial assets, which often go unreported.
They often also have the power and ability to avoid paying taxes without fear of government reprisal
Consumption taxes
Sales TAX
VAT
Custom duties (tariffs)
Excise taxes
Why Tax?
Tool for funding
Tool for redistribution
Tool for behavior eg. Vices, Pollutio
Direct Transfer Payment and the Public Provision of Goods and Services
Public Consumption
All current expenditures for purchases of goods and services by all levels of government, including capital expenditures on national defense and security
Example: Public health projects in rural villages and urban fringe areas, school lunches and preschool nutritional supplementation programs, and the provision of clean water and electrification to remote rural areas.
Subsidies
Financial assistance provided by the government
A payment by the government to producers or distributors in an industry for such purposes as preventing the decline of that industry, expanding employment, increasing exports, or reducing selected prices paid by consumers.
Direct government policies to keep the prices of essential foodstuffs low, represent additional reforms of public consumption
Four significant problems of Subsidies
Resources for attacking poverty are limited, they need to be directed to people who are genuinely poor
Beneficiaries not become unduly dependent on the poverty program; in particular, we do not want to give the poor less incentive to build the assets, such as education, that can enable them to stay out of poverty.
But a “safety net” can also be valuable to encourage the poor to accept a more entrepreneurial attitude toward their microenterprise
We don’t want to divert people who are productively engaged in alternative economic activities to participate in the poverty program
Poverty policies are often limited by resentment from the nonpoor, including those who are working hard but are not very far above the poverty line themselves.
When a subsidy of goods consumed by the poor is planned, it should be targeted to the geographic areas where the poor are found and should emphasize goods that nonpoor people do not consume
This helps conserve resources for the program and minimizes efforts by nonpoor people to benefit from the program.
Impose a work requirement before food aid is provided
Workfare Program
A poverty alleviation program that requires program beneficiaries to work in exchange for benefits, as in a food-for-work program.
Help preserve the program’s political sustainability: When people see that the poor are getting “a hand up rather than a handout,” the programs tend to attract wider public support
In sum, we can say that workfare, such as the Food for Work Program, represents a better policy than welfare or direct handouts when the following criteria are met:
Workfare program will work if:
Program does not reduce or seriously undermine incentives for the poor to acquire human capital and other assets
Greater net benefits of the work output of the program
It is harder to screen the poor without the workfare requirement
There is lower opportunity cost of time for poor workers (so the economy loses little output when they join the workfare program)
There is higher opportunity cost of time for nonpoor workers (so they won’t avail themselves of the benefits)
The fraction of the population living in poverty is is smaller (so the extra costs of universal welfare program would be high)
Less social stigma attached to participating in a workfare program, so the poor do not suffer undue humiliation and are less deterrred from seeking the help that their families need
Additional notes
The poor often have low bargaining power in their communities, and while it is difficult politically to increase this power, well-designed programs can accomplish this indirectly by providing improved “outside options” such as guaranteed public employment programs when they are needed
Appropriate agricultural development policies represent a crucial strategy for attacking poverty because such a high fraction of the poor are located in rural areas and engaged in agricultural pursuits
By building up the working capital and other assets of microenterprises, the poor can improve their productivity and incomes
The Need for a Package of Policies
Problems of poverty and inequality = Not 1 or 2 isolated policies but rather, a package of complementary and supportize policies, including the following four basic elements:
[Correct Factor Distortions] Designed to correct factor price distortions (underpricing capital or overpricing modern-sector skilled wages)
To ensure that market established prices provide accurate signals and incentives to both producers and resource suppliers
Correcting distorted prices → contribute to greater productive efficiency, more employment, and less poverty
[Structural changes in distribution of assets] Designed to bring structural changes in the distribution of assets, power, and access to education and associated income-earning (employment) opportunities
Touch on the whole social, institutional, cultural, and political fabric of the developing world
But such fundamental structural changes and substantive asset redistributions, whether immediately achieved (e.g., through public-sector interventions) or
gradually introduced over time (through redistribution from growth), will increase the chances of improving significantly the living conditions of the masses of rural and urban poor.
[Modify size distribution — rich and poor] Designed to modify the size distribution of income at the upper levels through the enforcement of legislated progressive taxation on incomes and wealth
Provide the poor with direct transfer payments and the expanded provision of publicly provided consumption goods and services
Create a social “safety net” for people
[Improve well-being of the poor]
Goes beyond safety net schemes, to offer programs that build capabilities and human and social capital of the poor, such as microfinance, health, education, agricultural development, environmental sustainability, and community development and empowerment programs
Conclusion: Such policies can be designed to encourage and accelerate inclusive economic growth targeted at the poor, while keeping in mind the inherently multidimensional nature of poverty.
Comparative Economic Development |
|---|
There is disparity in economic development
Characteristics of Developing Countries
Developing World and describe how development is measures so as to allow for quantitative comparisons across countries
10 features that developing countries have in common
Lower levels of living and productivity
Lower levels of human capital
Higher levels of inequality and absolute poverty
Higher population growth rates
Greater social fractionalization
Larger rural populations but rapid rural-to-urban migration
Lower levels of industrialization
Adverse geography
Underdeveloped financial and other markets
Lingering colonial impacts such as poor institutions and often external dependence
Colonialism played a major role in shaping institutions that set the “rules of the economic game” which can limit or facilitate opportunities for economic development
Defining the Developing World
Most common way to define the developing world is by per capita income
Another way to classify the nations of the developing world is through their degree of international indebtedness; the World Bank has classified countries as:
Severely indebted
Moderately indebted
Less Indebted
The United Nations Development Programme (UNDP) classifies countries according to their level of human development, including health and education attainments as low, medium, high, and very high.
International Bank for Reconstruction and Development (BIRD) or also known as World Bank
An organization known as an “international financial institution” that provides development funds to developing countries in the form of interest-bearing loans, grants, and technical assistance.
Low-income countries (LCIs)
GNI per capita of less than $1,025 in 2011.
Middle-income countries
GNI per capita between $1,025 and $12,475 in 2011
High-income countries
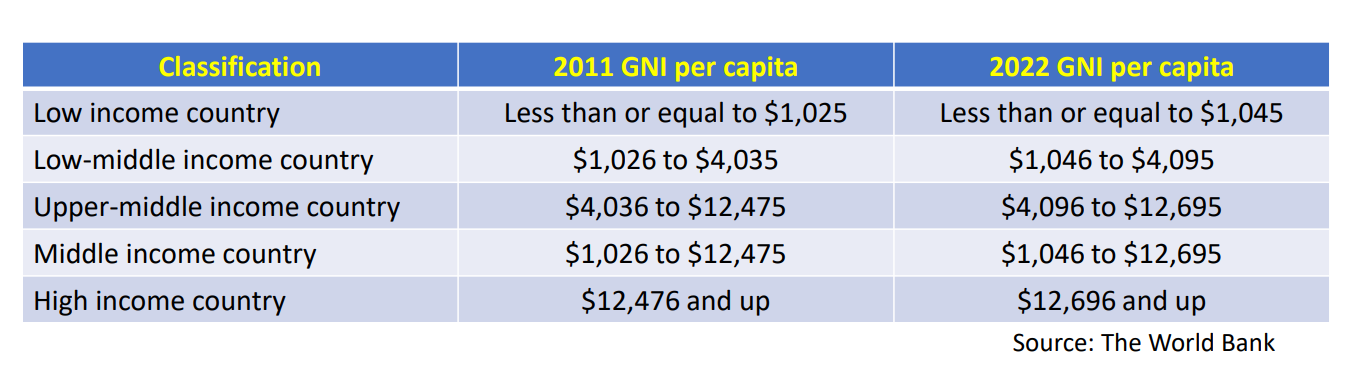
$12,475 and up
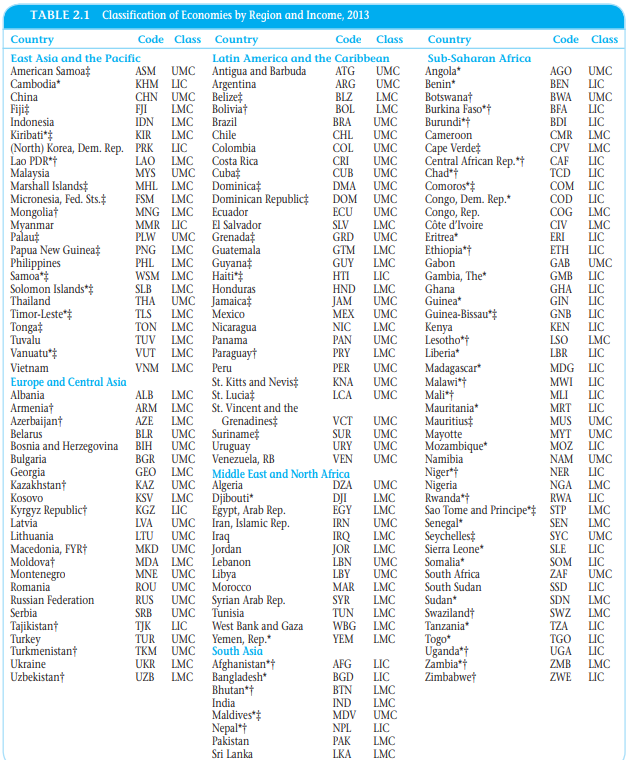
Philippines: Low Middle-income country
Newly Industrializing Countries (NICs)
Countries at a relatively advanced level of economic development with a substantial and dynamic industrial sector and with close links to the international trade, finance, and investment system
Least Developed Countries
A UN designation of countries with low income, low human capital, and high economic vulnerability.
Human Capital
Productive investments in people, such as skills, values, and health resulting from expenditures on education, on-the-job training programs, and medical care
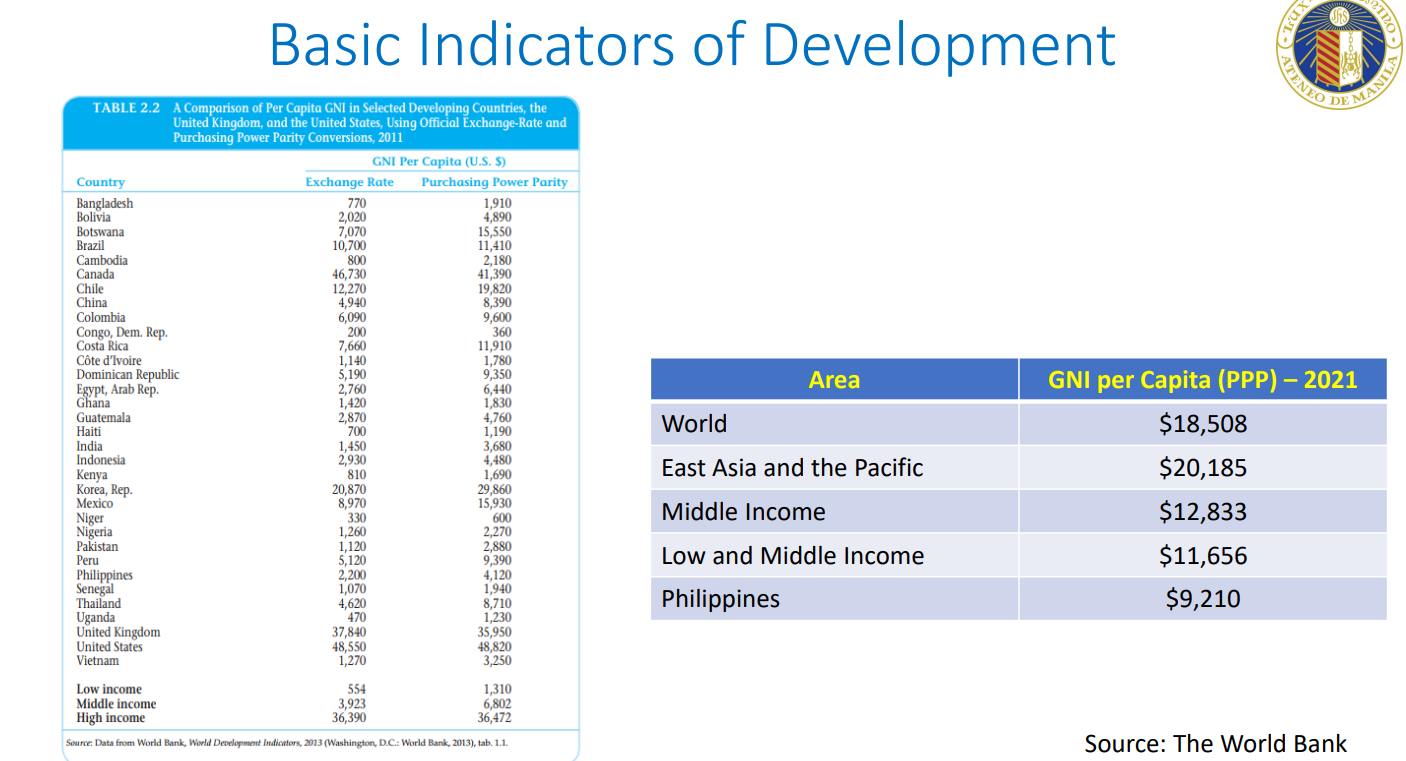
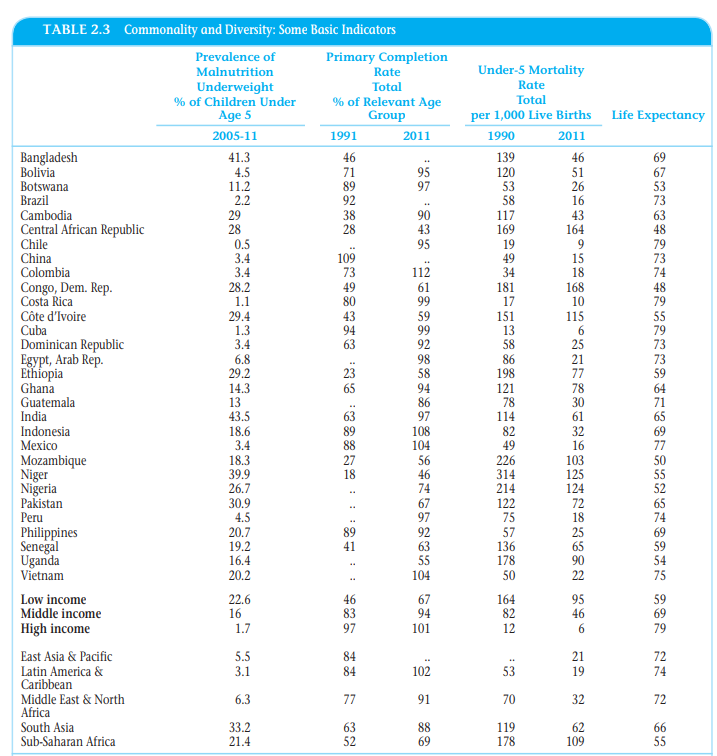
Basic Indicators of Development: Real Income, Health, and Education
Basic indicators of three facets of development: Real income per capita adjusted for purchasing power; health as measured by life expectancy + undernourishment + child mortality; and educational attainment as measured by literacy + schooling
Purchasing Power Paritt
Gross National Income
Most common measure of the overall economic well-being of people in different nations
The total domestic and foreign output claimed by residents of a country, consisting of gross domestic product (GDP) plus factor incomes earned by foreign residents, minus income earned in the domestic economy by nonresidents.
Value Added
The portion of a product’s final value that is added at each stage of production
Depreciation (of the capital stock)
The wearing out of equipment, buildings, infrastructure, and other forms of capital, reflected in write-offs to the value of the capital stock
Capital Stock
Total amount of physical goods existing at a particular time that have been produced for use in the production of other goods and services
Gross Domestic Product
The total final output of goods and services produced by the country’s economy within the country’s territory by residents and nonresidents, regardless of its allocation between domestic and foreign claims.
Made in the PH
There is a big disparity between the income per capita in selected countries 
Philippines GNI per Capita → Number 122 out of 191 countries
Purchasing power parity (PPP)
Calculation of GNI using a common set of international prices for all goods and services, to provide more accurate comparisons of living standards.
Number of units of a foreign country’s currency required to purchase the identical quantity of goods and services in the local developing country market as $1 would buy in the United States.
Level of Indebtedness - PH
External debt to GDP % as of 2022 = 25.8%
Low percentage means we can pay
If we can pay, we get good credit rating
If we get good credit rating, we get low interest rates
Low interest rates give us room to borrow from abroad
PH Debt-to-GDP Ratio
Indicators of Health and Education
Besides average incomes, it is necessary to evaluate a nation’s average health and educational attainments,
Some facts:
Life expectancy → average number of years newborn children would live if subjected to the mortality risks prevailing for their cohort at the time of their birth.
Undernourishment → problem of hunger; consuming too little food to maintain normal levels of activity; it is what is often called the problem of hunger
High fertility → both a cause and a consequence of underdevelopment
Literacy → fraction of adult males and females reported or estimated to have basic abilities to read and write
Functional literacy is generally lower than reported numbers
Philippines: Mortality and Life Expectancy
Infant morality rate + mortality rate: Getting higher, thus it means the economy is able to support, and even though the healthcare system is not perfect it’s somewhat working
Life Expectancy (years) | Philippines | World |
|---|---|---|
Female | 75.5 | 75.0 |
Male | 67.3 | 70.6 |
Philippines: Education
Expected Years of Schooling (Years) | Philippines | World |
|---|---|---|
Female | 13.5 | 12.7 |
Male | 12.8 | 12.7 |
Holistic Measures of Living Levels and Capabilities
Human Development Index (HDI)
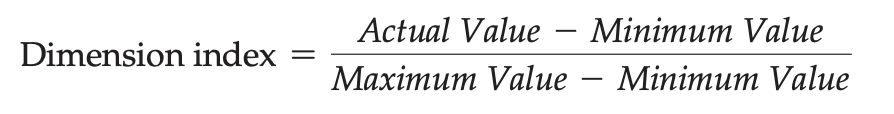
An index measuring national socioeconomic development, based on combining measures of education, health, and adjusted real income per capita.
Ranks each country on a scale of 0 (lowest human development) to 1 (highest human development) based on three goals or end products of development.
Three goals/aims of HDI include:
Long and healthy life as measured by life expectancy at birth
Knowledge as measured by a combination of average schooling attained by adults and expected years of schooling for school-age children
Decent standard of living as measured by real per capita gross domestic product adjusted for differing purchasing power parity of each country’s currency to reflect cost of living and for the assumption of diminishing marginal utility of income
Human Development Index: Social Data + Economic Data + Broader View
Big Disparity (Developed vis-a-vis Developing)
Diminishing Marginal Utility
The concept that the subjective value of additional consumption lessens as total consumption becomes higher
HDI Calculation = the higher, the better
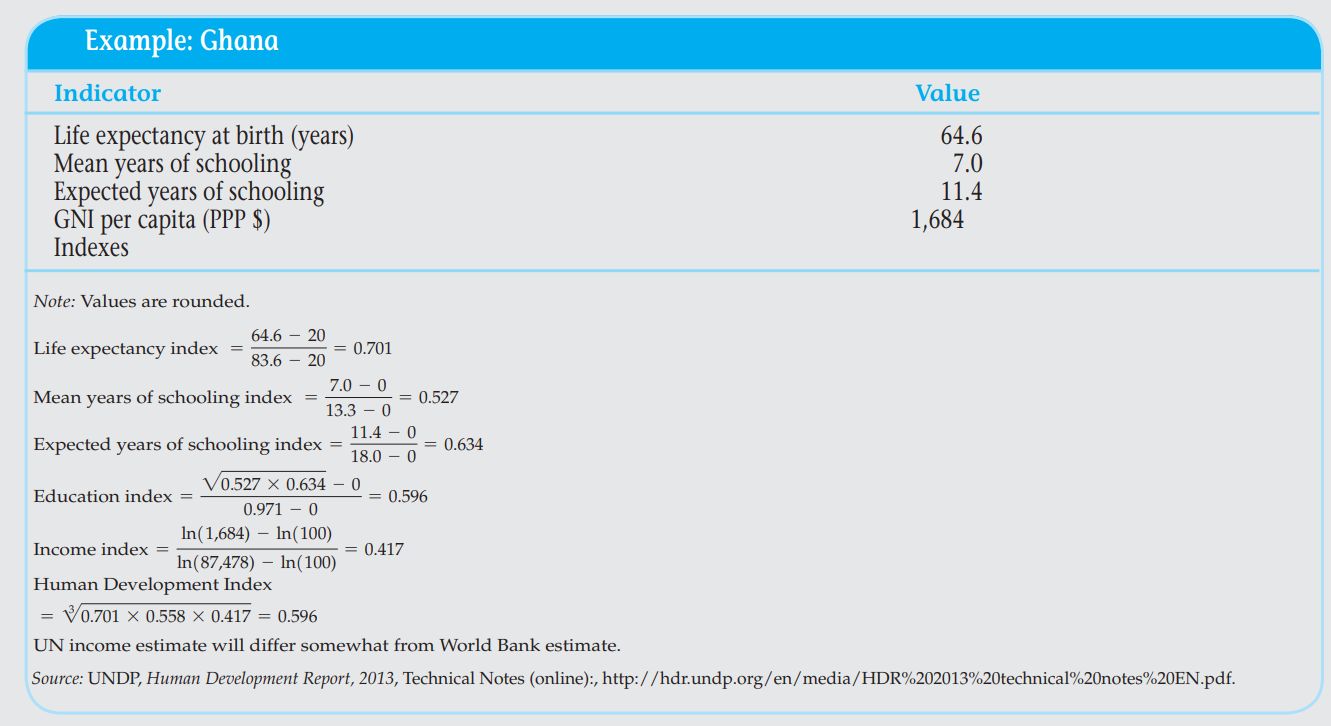
Health (Long and Healthy life) dimension of HDI
Calculated with a life expectancy at birth index, which takes a minimum value of 20 years and a maximum value of 83.57 years (the observed maximum value for any country). For example, for the case of Ghana this is
Life Expectancy Index: (64.6 - 20) / (83.6 -20) = .701 |
|---|
Education (“knowledge”)
Calculated with a combination of the average years of schooling for adults aged 25 and older and expected years of schooling for a school-age child now entering school.
As explained by the UNDP, these indicators are normalized using a minimum value of 0, and maximum values are set to the actual observed maximum value of mean years of schooling from the countries in the time series, 1980– 2012, which is 13.3 years estimated for the United States in 2010. For Ghana, the average years of schooling among adults is 7 years, so the mean years of schooling subindex is calculated as:
(7.0 - 0) / (13.3 -0) = 0.527 |
|---|
Interpretation: We can think of this as saying that Ghana is about 53% of the way to the global standard of average education
New HDI Computation
The effect is to assume perfect substitutability across income, health, and education
So in the New HDI, instead of adding up the health, education, and income indexes and dividing by 3, the New HDI is calculated with the geometric mean
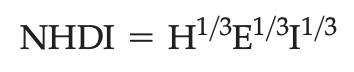
H = Health index, E = education index, and I = Income Index
HDI Classification:
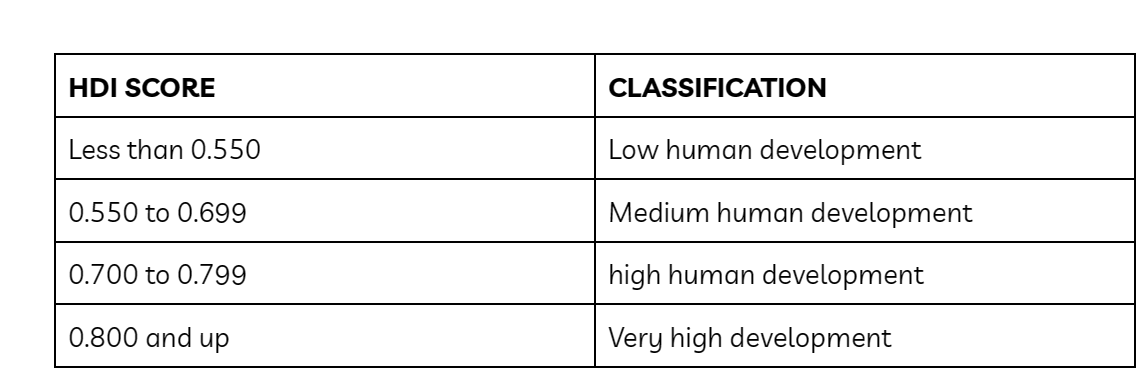
HDI score will determine your social classification
Best countries in the world are neighboring countries
Top 10 Countries with the Highest HDI
Top 10 Countries with Lowest HDI
PH’s 2021 HDI = 0.699 Medium Human Development Rank - 116/191 East Asia & Pacific = .749 World = 0.732 |
|---|

Characteristics of the Developing World
Different development problems call for different specific policy responses and general development strategies
Poverty Trap
Circular and cumulative causation
Low income leads to low investment in education and health, which in turn leads to low productivity and economic stagnation
One common misconception is that low incomes result from a country’s being too small to be self-sufficient or too large to overcome economic inertia.
Low income results from country’s being too small to be self sufficient
Low incomes results from country’s being too large to overcome economic inertia
Size of the country doesnt have any implications for development; it’s more oh who governs
Lower Levels of Human Capital
Human capital—health, education, and skills—is vital to economic growth and human development.
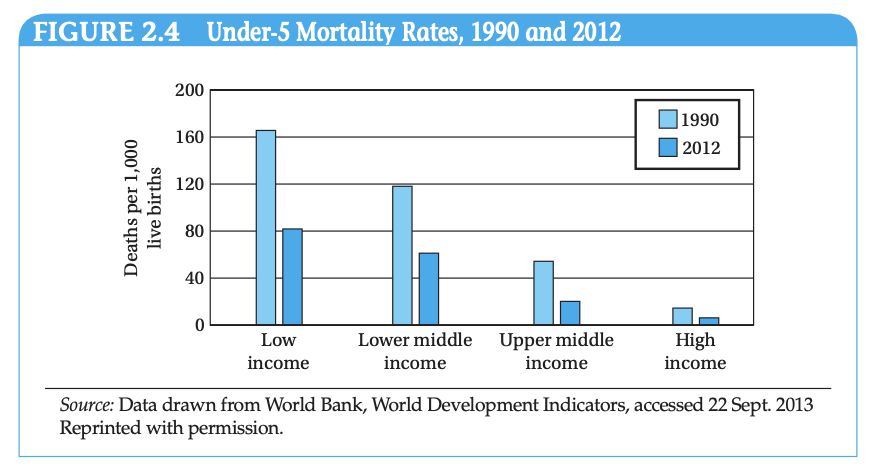
Figure 2.4 Explanation: The under-5 mortality is 17 times higher in lowincome countries than in high-income countries, although great progress has been made since 1990
PH UNDER-5 MORTALITY
2000: 37.8 deaths per 1,000 live births
2018: 28.4 deaths per 1,000 live births
It’s also:
Rich/High-income countries = low birth rate and death rate
Poor/Low-income countries = high birth rate and death rate
Mortality and Education=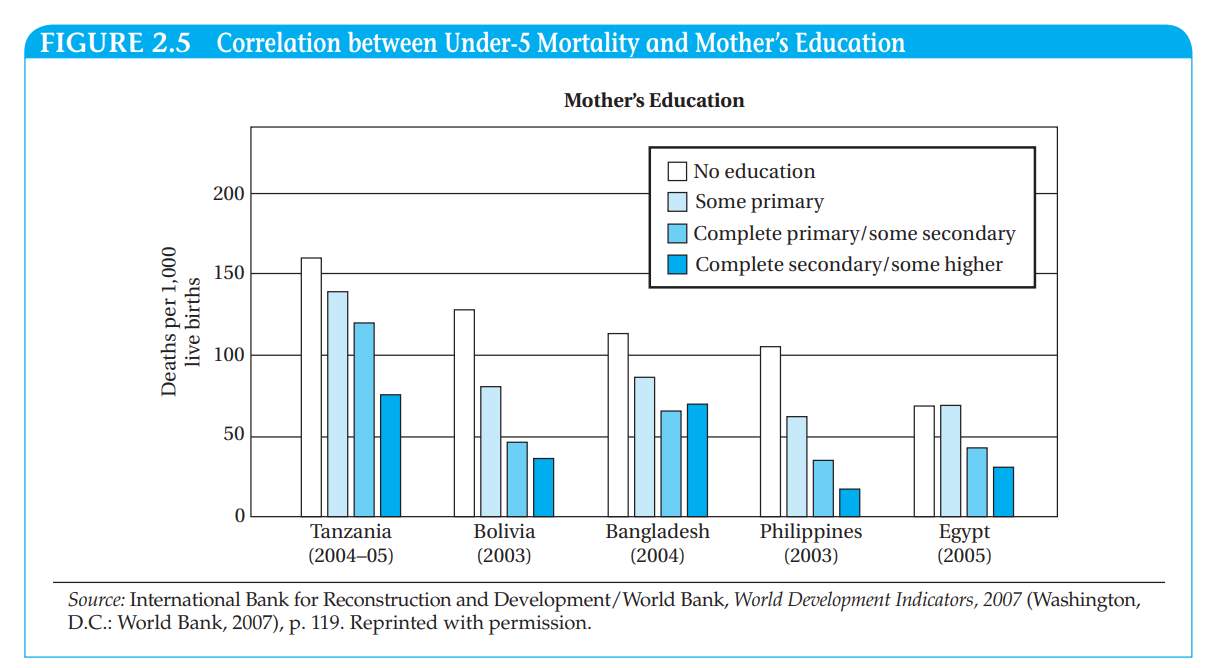
Figure 2.5 Explanation: Under-5 mortality rates improve as mothers’ education levels rise; More educated mom → more likely that their child will live
School Enrollment and Pupil-teacher ratio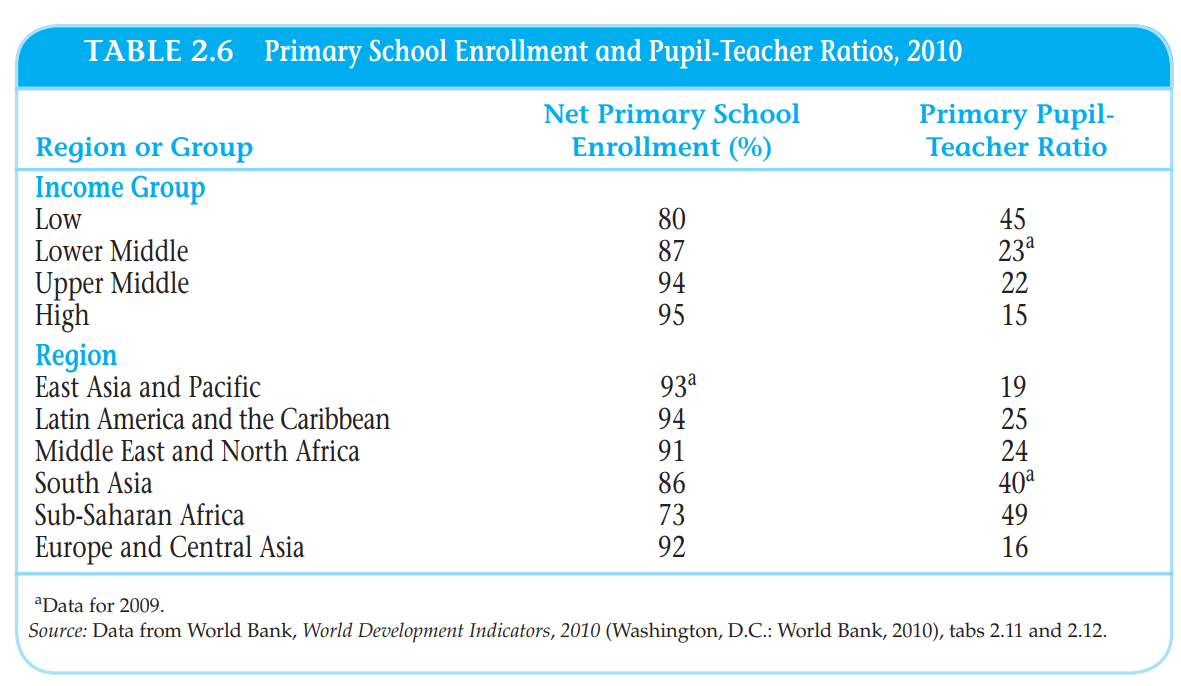
Figure 2.6 Explanation: Enrollments have strongly improved in recent years, but student attendance and completion, along with attainment of basic skills such as functional literacy, remain problems. Indeed, teacher truancy remains a serious problem in South Asia and sub-Saharan Africa.
Higher Levels of Inequality and Absolute Poverty
The poorest 20% of people receive just 1.5% of the world’s income
Lowest 20% = 1.2 billion people living in extreme poverty on less than $1.25 per day at purchasing power parity
But the enormous gap in per capita incomes between rich and poor nations is not the only manifestation of the huge global economic disparities.
Look at the gap between rich and poor WITHIN individual developing countries
Very high levels of inequality—extremes in the relative incomes of higher- and lower-income citizens—are found in many middle-income countries
A large majority of the extreme poor live in the low-income developing countries of sub-Saharan Africa and South Asia
Extreme poverty is due in part to low human capital but also to social and political exclusion and other deprivations.
Absolute Poverty
The situation of being unable or only barely able to meet the subsistence essentials of food, clothing, shelter, and basic health care
Extreme Poverty
Great human misery
Poverty and inequality can lead to slower growth
The incidence of extreme poverty varies widely around the developing world. The World Bank estimates that the share of the population living on less than $1.25 per day is:
9.1% in East Asia and the Pacific
8.6% in Latin America and the Caribbean
1.5% in the Middle East and North Africa
31.7% in South Asia
41.1% in sub-Saharan Africa
Higher Population Growth Rates
Global population has skyrocketed since the beginning of the industrial era, from just under 1 billion in 1800 to 1.65 billion in 1900 and to over 6 billion by 2000
Population dynamics varies widely among developing countries.
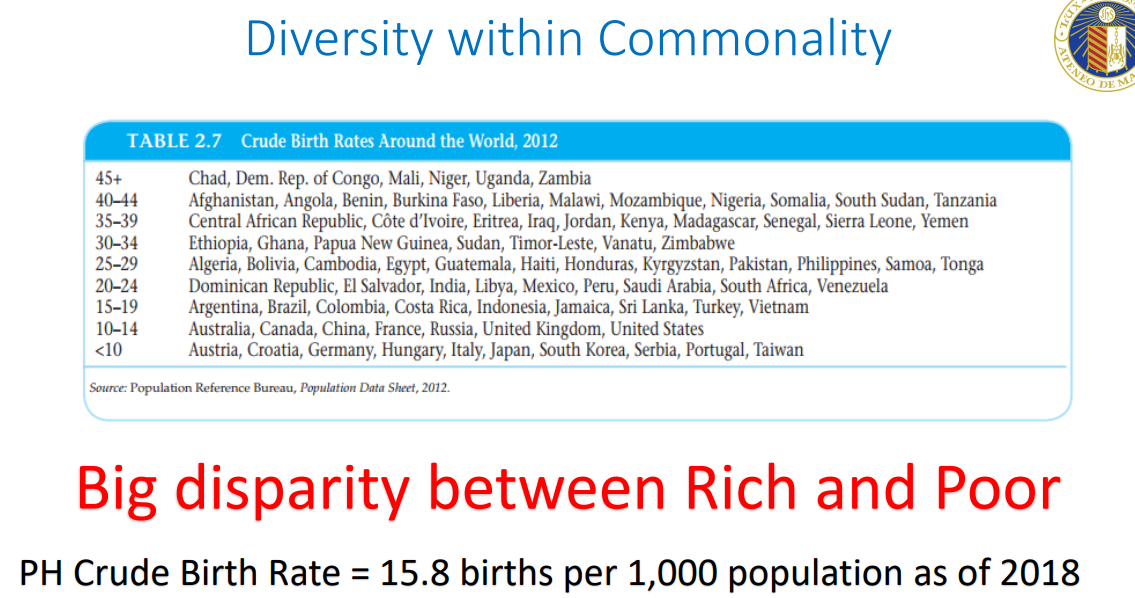
Crude Birth Rate
The number of children born alive each year per 1,000 population
Dependency Burden
Both older people (65+) and children (0-15) are often referred to as an economic dependency burden in the sense that they must be supported financially by the country’s labor force (usually defined as citizens between the ages of 15 and 64).]
Economically-unproductive; not counted in the labor force
Dependency Burden depending on the SES
Low-income countries = 66 children under 15 for each 100 working-age (15–65) adults
Middle-income countries = 41 people
High-income = 26 people
But in rich countries, older citizens are supported by their lifetime savings and by public and private pensions.
Dependency Burden in the PH
Old Age Dependency Ratio: 8
Young Age Dependency Ratio: 48
Not only are developing countries characterized by higher rates of population growth, but they must also contend with greater dependency burdens than rich nations, though with a wide gulf between low - and middle-income developing countries
Fractionalization
Significant ethic, linguistic, and other social divisions within a country
The greater the ethnic, linguistic, and religious diversity of a country, the more likely it is that there will be internal strife and political instability
Associated with civil strife and violent conflict
There is some evidence that many of the factors associated with poor economic growth performance in sub-Saharan Africa, such as low schooling, political instability, underdeveloped financial systems, and insufficient infrastructure, can be statistically explained by high ethnic fragmentation
Ethnic and religious composition of a developing nation and whether or not that diversity leads to conflict or cooperation can be important determinants of the success or failure of development efforts
Larger Rural Populations but Rapid Rural-to-Urban Migration
One of the hallmarks of economic development is a shift from agriculture *RURAL* to manufacturing and services *URBAN* (AMS)
Rural areas are poorer and tend to suffer from missing markets, limited information, and social stratification.
More people live in cities than in rural areas
But sub-Saharan Africa and most of Asia remain predominantly rural.
Developed Countries = High Urban Share
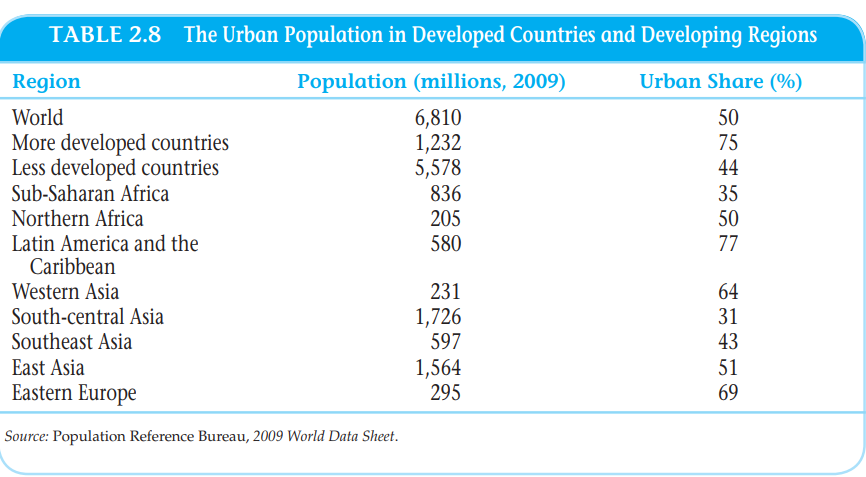
Developing Countries = Low Urban Share
Industrialization
Associated with high productivity and incomes and has been a hallmark of modernization and national economic power
Share of employment in industry in many developed countries is smaller than in developing countries
Developing nations tended to have a higher dependence on primary exports.
Most developing countries have diversified away from agricultural and mineral exports to some degree
The middle income countries are rapidly catching up with the developed world in the share of manufactured goods in their exports, even if these goods are typically less advanced in their skill and technology content.
Adverse Geography
Geography must play some role in problems of agriculture, public health, and comparative development
Land-locked economies perform lower than coastal economies
Africa
Developing Countries = primarily tropical or subtropical, and this has meant that they suffer more from tropical pests and parasites, endemic diseases such as malaria, water resource constraints, and extremes of heat
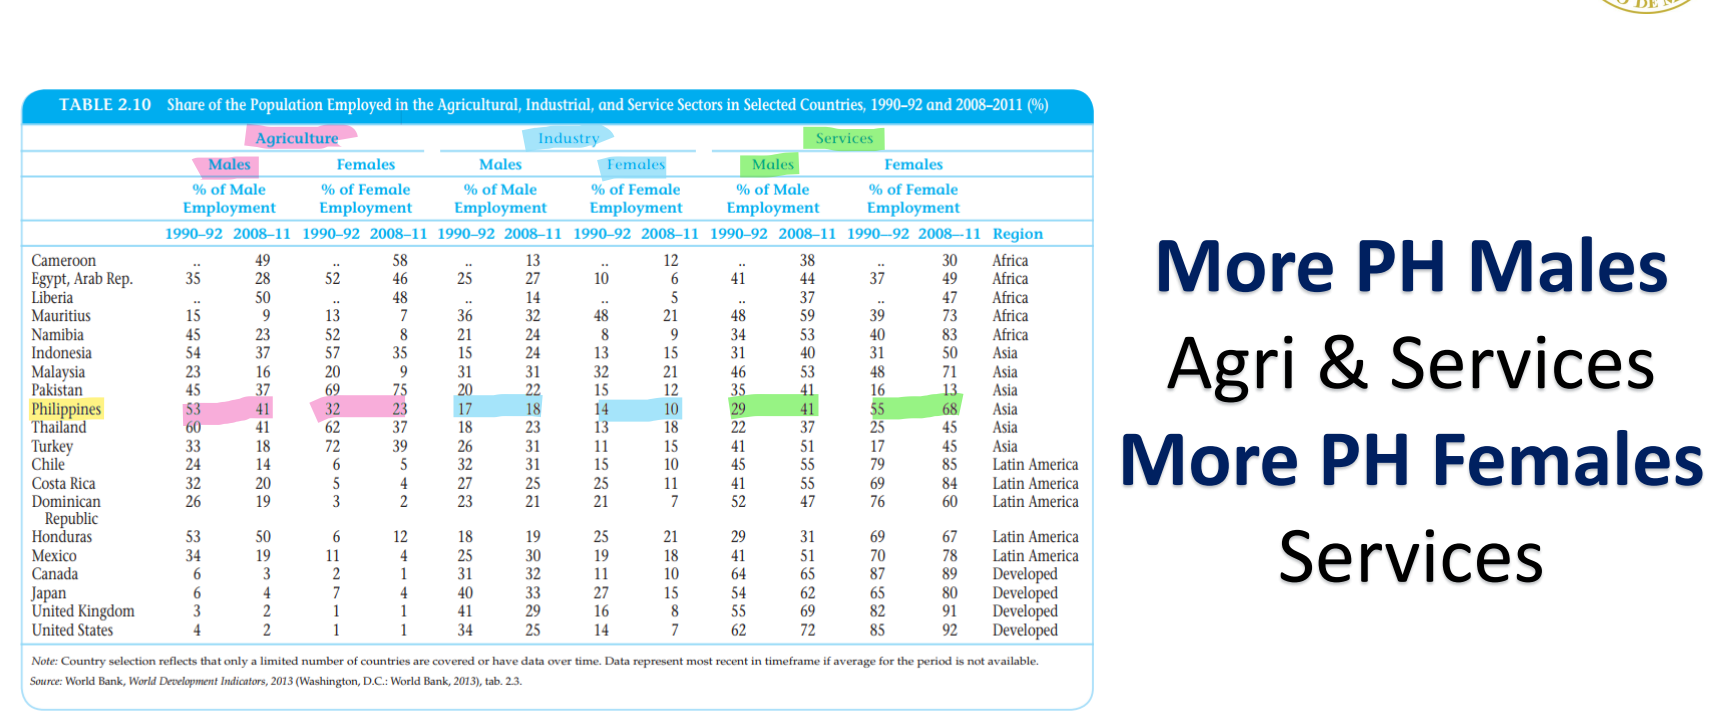
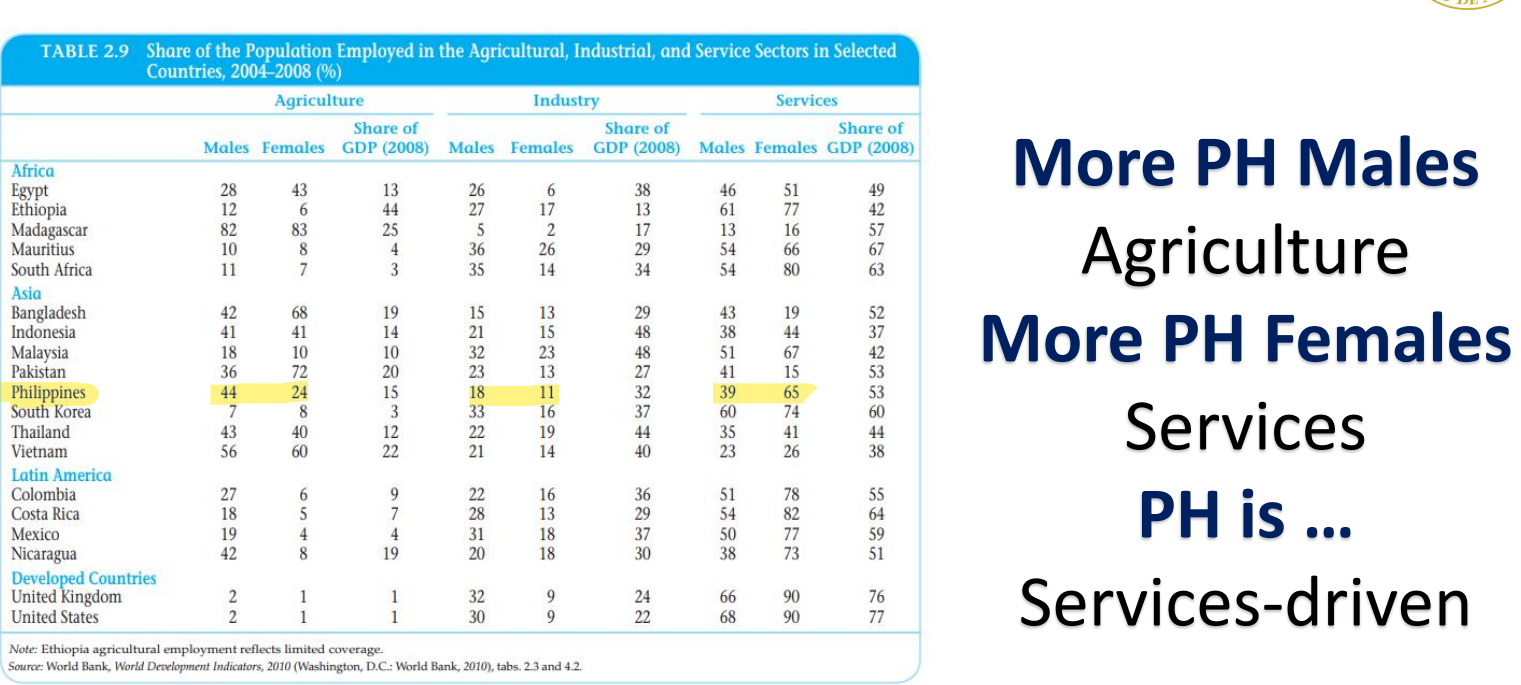
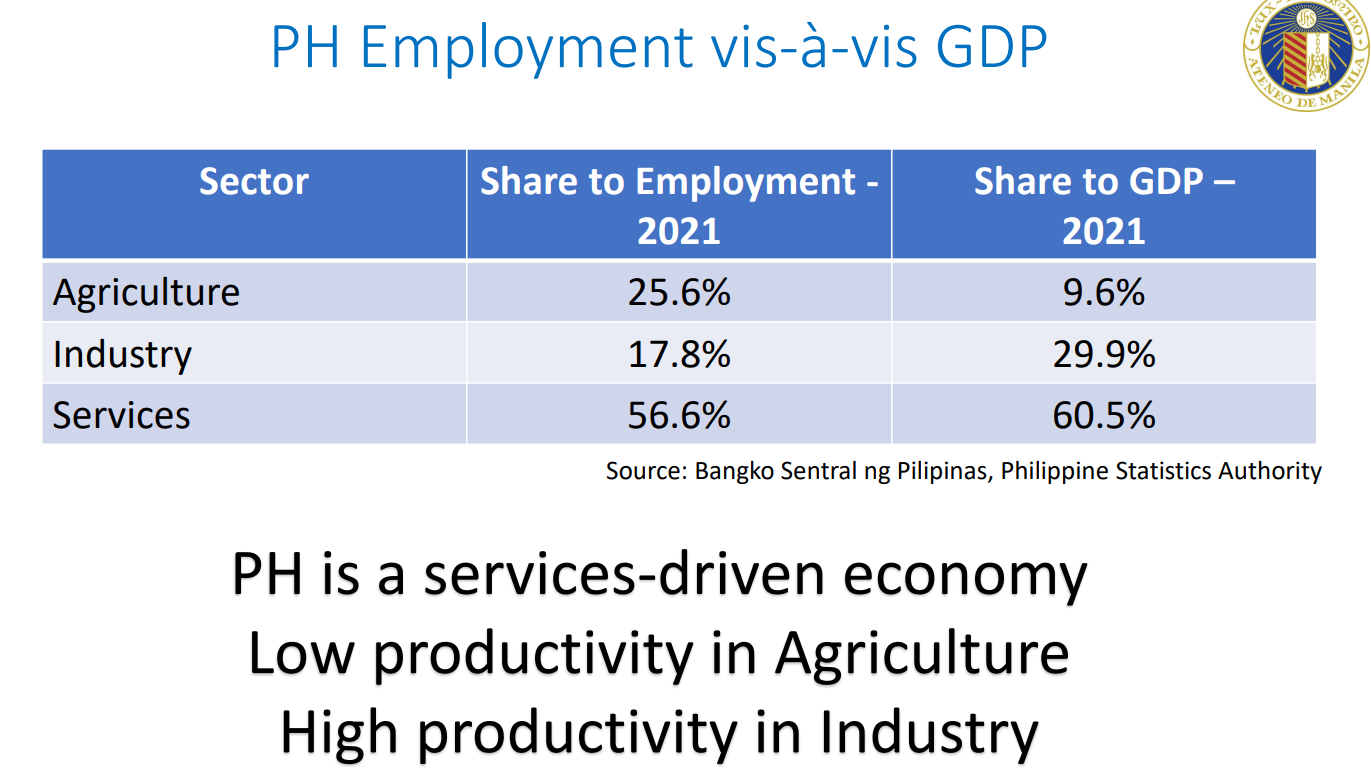
PH Employment
Service-driven
Low productivity: Agriculture
High productivity: Industry
Resource Endowment
A nation’s supply of usable factors of production, including mineral deposits, raw materials, and labor.
Underdeveloped Markets
Some aspects of market underdevelopment are that they often lack:
Legal system that enforces contracts and validates property rights
Stable and trustworthy currency
Infrastructure of roads and utilities that results in low transport and communication costs so as to facilitate interregional trade
Well-developed and efficiently regulated system of banking and insurance, with broad access and with formal credit markets that select projects and allocate loanable funds on the basis of relative economic profitability and enforce rules of repayment
Substantial market information for consumers and producers about prices, quantities, and qualities of products and resources as well as the creditworthiness of potential
Social norms that facilitate successful long-term business relationships
Infrastructure
Facilities that enable economic activity and markets, such as transportation, communication and distribution networks, utilities, water, sewer, and energy supply systems.
Imperfect Market
A market in which the theoretical assumptions of perfect competition are violated by the existence of:
Small number of buyers and sellers
Barriers to entry
Imperfect information
Monopoly
Monopoly is a market structure characterized by a single seller, selling a unique product in the market, with no close substitute
A monopoly can dominate one sector or industry and has the power to control prices and exclude competitions
Incomplete Information
The absence of information that producers and consumers need to make efficient decisions resulting in underperforming markets.
Lingering Colonial Impacts and Unequal International Relations
Colonial Legacy
Most developing countries were once colonies of Europe or otherwise dominated by European or other foreign powers, and institutions created during the colonial period often had pernicious effects on development that in many cases have persisted to the present day.
Property Rights
The acknowledged right to use and benefit from a tangible (land) or intangible entity (intellectual) that may include owning, using, deriving income from, selling and disposing
External Dependence (TDE)
Developing world = environmental dependence
Developing nations have weaker bargaining positions than developed nations in international economic relations
Developing nations are also dependent on the developed world for environmental preservation, on which hopes for sustainable development depend.
Thus the developing world endures what may be called environmental dependence, in which it must rely on the developed world to cease aggravating the problem and to develop solutions, including mitigation at home and assistance
From PPT: Trade, Debt, Environment
How Low-income Countries Differ Today
We can identify eight significant differences in initial conditions that require a special analysis of the growth prospects and requirements of modern economic development:
Physical and human resource endowments
Contemporary developing countries are often less well endowed with natural resources than the currently developed nations were at the time when the latter nations began their modern growth.
Asia = poorly endowed with natural resources
Africa = natural resources are more plentiful
The ability of a country to exploit its natural resources and to initiate and sustain long-term economic growth is dependent on, among other things, the ingenuity and the managerial and technical skills of its people and its access to critical market and product information at minimal cost
[Paul Romer] Developing nations “are poor because their citizens don’t have access to the ideas that are used in industrial nations to generate economic value”
Technology gap between rich and poor nations can be divided into two components:
Physical object gap (factories, roads, and modern machinery)
Idea gap (knowledge about marketing, distribution, inventory control, transactions processing, and worker motivation)
Per capita incomes and levels of GDP in relation to the rest of the world
Low-income countries = lower level of real per capita income than their developed-country counterparts
Today’s developed countries = economically in advance of the rest of the world
Today’s developing countries = growth process at the low end of the international per capita income scale
Climate
Almost all developing countries are situated in tropical or subtropical climatic zones.
It has been observed that the economically most successful countries are located in the temperate zone
Negative effects of extreme heat in poor countries:
Contribute to deteriorating soil quality and the rapid depreciation of many natural goods. They also contribute to the low productivity of certain crops, the weakened regenerative growth of forests, and the poor health of animals.
Extremes of heat and humidity not only cause discomfort to workers but can also weaken their health, reduce their desire to engage in strenuous physical work, and generally lower their levels of productivity and efficiency
Population size, distribution, and growth
The populations of many developing countries have been increasing at annual rates in excess of 2.5% in recent decades, and some are still rising that fast today
Developing countries = higher person-to-land ratios than European countries
Historical role of international migration
A major outlet for rural populations was international migration, which was both widespread and largescale.
International trade benefits
Free trade = Trade in which goods can be imported and exported without any barriers in the forms of tariffs, quotas, or other restrictions.
“Engine of growth” that propelled the development of today’s economically advanced nations
Terms of Trade = Ratio of a country’s average export price to its average import price
Basic scientific and technological research and development capabilities
Research and Development = Scientific investigation with a view toward improving the existing quality of human life, products, profits, factors of production or knowledge
In the important area of scientific and technological research, low-income developing nations in particular are in an extremely disadvantageous position vis-à-vis the developed nations.
Efficacy of domestic institutions
Another difference between most developing countries and most developed countries at the time of their early stages of economic development lies in the efficacy of domestic economic, political, and social institutions.
Developed Countries = stronger political stability and more flexible social institutions
Africa = national boundaries were more arbitrarily dictated by colonial powers
Are Living Standards of Developing and Developed Nations Converging?
Divergence
A tendency for per capita income (or output) to grow faster in higher-income countries than in lower-income countries so that the income gap widens across countries over time (as was seen in the two centuries after industrialization began)
Poor countries can’t keep up with the rich countries
Convergence
The tendency for per capita income (or output) to grow faster in lower-income countries than in higher-income countries so that lower-income countries are “catching up” over time.
Conditional Convergence
When countries are hypothesized to converge not in all cases but other things being equal (particularly savings rates, labor force growth, and production technologies), then the term conditional convergence is used.
If the growth experience of developing and developed countries were similar, there are two important reasons to expect that developing countries would be “catching up” by growing faster on average than developed countries
Technology Transfer
Factor Accumulation
Given one or both of these conditions, technology transfer and more rapid capital accumulation, incomes would tend toward convergence in the long run as the faster-growing developing countries would be catching up with the slower-growing developed countries.
Economic Institutions
Humanly-devised constraints that shape interactions including formal rules embodied in constitutions, laws, contracts and market regulations, plus informal rules reflected in norms of behavior and conduct, values, customs and generally accepted ways of doing things
Classic Theories of Economic Development: Four Approaches
Development
Every nation strives toward development
“Series of successive stages of economic growth through which all countries must pass”
Right quantity and mixture of saving, investment, and foreign aid were all necessary to enable developing nations to proceed
Rapid, aggregate economic growth
Economic progress is important
Economic progress is not only the task
Development is multidimensional
Four Approaches/Theories
Linear stages-of-growth
Theories and patterns of structural change
International-dependence revolution
Neoclassical, free-market counterrevolution
FIRST APPROACH: Linear Stages
Walt W Rostow’s Stages-of-growth model of development
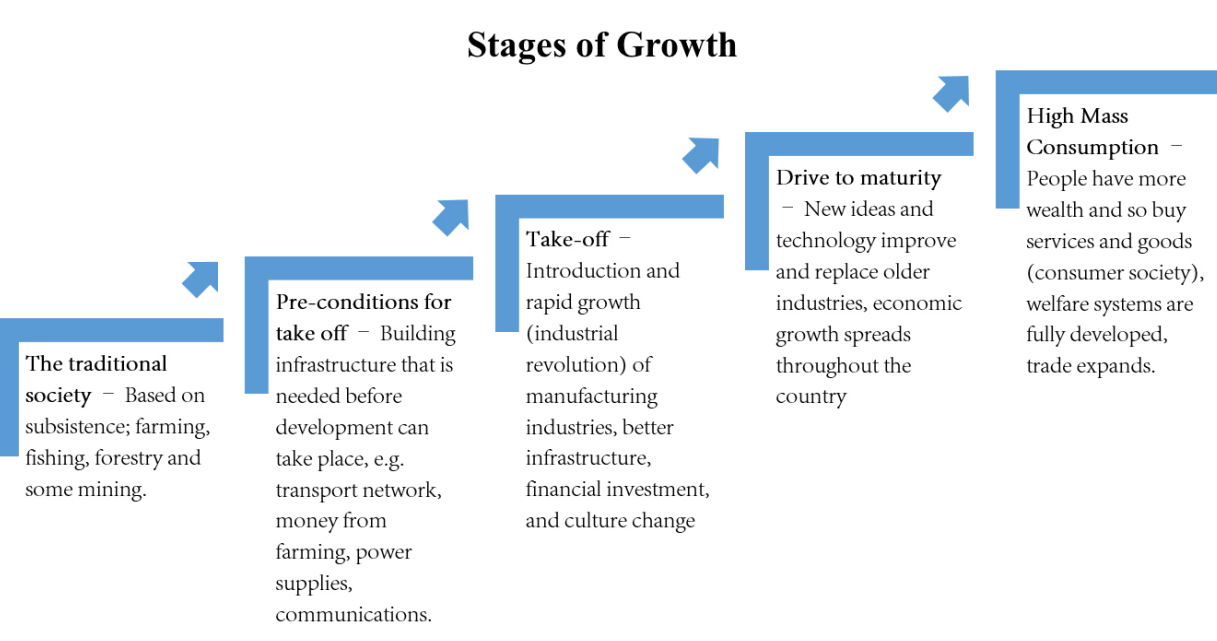
In a nutshell: from countryside to city; from low-tech to high-tech
Advanced countries had passed the stage of “takeoff into self-sustaining growth” and underdeveloped countries were still in the traditional society/”preconditions” stage
Reach takeoff by moving from subsistence to mass consumption
Horrod-Domar growth model
AK model
A functional economic relationship in which the growth rate of gross domestic product (g) depends directly on the national net savings rate (s) and inversely on the national capital-output ratio (c).

Every economy must save a certain proportion of its national income, if only to replace worn-out or impaired capital goods (buildings, equipment, and materials)
But growth also entails new investments representing ned additions
Capital-output ratio ( c )
Ratio that shows the units of capital required to produce a unit of output over a given period of time
Net-savings ratio ( s )
Savings expressed as a proportion of disposable income over some period of time
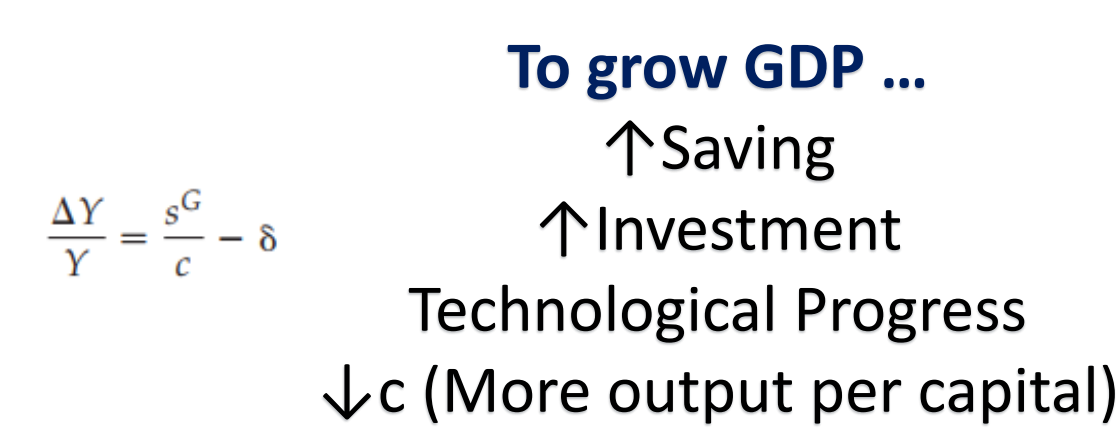
Mechanisms of economic growth and development would be simply a matter of increasing national savings and investment
Linear Stages Computation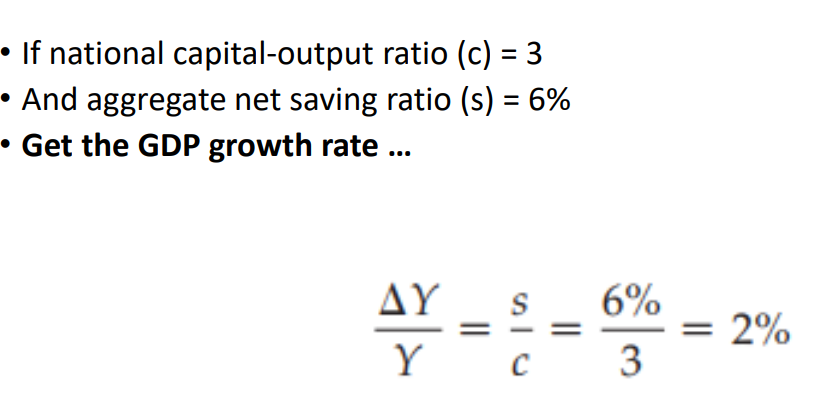
Now if the national net savings rate can somehow be increased from 6% to, say, 15%—through some combination of increased taxes, foreign aid, and general consumption sacrifices—GDP growth can be increased from 2% to 5% because now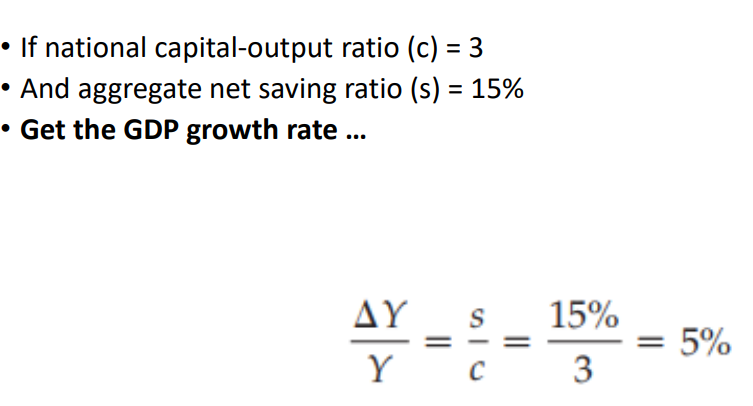
But what if s is low locally?
Examples of augmenting s:
Foreign Aid
Private Foreign investment
Go to other countries and invite them to put their businesses here
99% of our businesses are MSMEs but their value to the economy is only 1%
Most of it is by malls, telecoms – big companies
Linear Stages (Criticisms)
Saving and Investment (Growth Drivers) were necessary but not SUFFICIENT
Necessary Condition: Condition that must be present, although it need not be in itself sufficient
Sufficient Condition: When present causes or guarantees that an event will or can occur
Constraines related to:
Well-integrated commodity and money markets
Highly-developed transport facilities
Well-trained and educated workforce
Motivation to succeed
Efficient government bureaucracy
Managerial competence
Skilled labor
Ability to plan and administer many development projects
SECOND APPROACH: Structural-Change Models
Structural-Change Theory
The hypothesis that underdevelopment is due to underutilization of resources arising from structural or institutional factors that have their origins in both domestic and international dualism.
Dualism is real
Accelerated capital formation is not enough
Lewis Theory of Economic Development
Structural Transformation
formulated by Nobel laureate W. Arthur Lewis in the mid-1950s and later modified, formalized, and extended by John Fei and Gustav Ranis
Transforming an economy in such a way that the contribution to national income by the manufacturing sector eventually surpasses the contribution by the agricultural sector.
Manufacturing share > Agricultural share
Sectoral Share to PH GDP 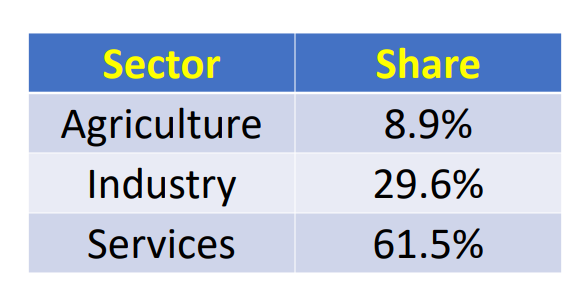
Lewis two-sector model
Gist: Agriculture → Surplus Labor → Industrial
Surplus labor from the traditional agricultural sector is transferred to the modern industrial sector, the growth of which absorbs the surplus labor, promotes industrialization, and stimulates sustained development
Underdeveloped economy consists of two sectors: Traditional Sector vs Modern Sector
Traditional Sector | Modern Sector |
|---|---|
Overpopulated Rural Subsistence Zero marginal labor productivity Surplus Labor | Not overpopulated Urban and industrial High-productivity |
Surplus Labor
The excess supply of labor over and above the quantity demanded at the going free-market wage rate.
Refers to the portion of the rural labor force whose marginal productivity is zero or negative
“Too many cooks spoil the broth”
Marginal productivity is 0 or negative
Law of diminishing returns
Average Products vs Marginal Product
Average Products
Total Output (Product)/Total Input (Labor to produce the product)
Total output or product divided by total factor input (e.g., the average product of labor is equal to total output divided by the total amount of labor used to produce that output
Marginal Products
Increase in total output resulting from the use of one additional unit of a variable factor of production (labor or capital)
MP = △output / △input
Where △ is change
Assumptions of Lewis in Traditional Sector
K (capital) is fixed
Surplus Labor = MP is 0
All rural workers share equally in output
Rural real wage is determined by the average and not the marginal product of labor (“passing around the family rice bowl at dinnertime, from which each person takes an equal share”)
Production Functon
A technological or engineering relationship between the quantity of a good produced and the quantity of inputs required to produce it.
Self-sustaining Growth
Economic growth that continues over the long run based on saving, investment, and complementary private and public activities.
Employment is assumed to continue until ALL SURPLUS RURAL LABOR is absorbed in the new industrial sector
Lewis turning point
Thereafter, additional workers can be withdrawn from the agricultural sector only at a higher cost of lost food production because the declining labor-to-land ratio means that the marginal product of rural labor is no longer zero
Labor supply curve becomes positively sloped
Criticisms of the Lewis Model
Model implicitly assumes that the rate of labor transfer and employment creation in the modern sector is proportional to the rate of modern-sector capital accumulation
Antidevelopmental Economic Growth = all extra income and output growth are distributed to the few oners of capital, while income and employment levels for the masses of workers remain largely unchanged
Surplus labor exists in rural areas while there is full employment in the urban areas
Competitive modern-sector labor market that guarantees the continued existence of constant real urban wages up to the point where the supply of rural surplus labor is exhausted
Institutional factors such as union bargaining power, civil service wage scales, and multinational corporations’ hiring practices tend to negate competitive forces in modern-sector labor markets in developing countries.
Diminishing returns in the modern industrial sector
Lewis model is widely used and relevant to recent experiences in China (labor has been steadily absorbed from farming into manufacturing)
Structural Change and Patterns of Development
Patterns-of-development analysis
Attempt to identify characteristic features of the internal processes of structural transformation that a “typical” developing economy undergoes as it generates and sustains modern economic growth and development
Increased savings and investment are perceived by patterns-of-development analysts as necessary but not sufficient conditions for economic growth.
Change in economic structure is required for the transition from a traditional economic system to a modern one
Hollis B Chenery model of structural change
Examined patterns of development for numerous developing countries during the postwar period
Shift from agricultural to industrial production
Steady accumulation of physical and human capital
Change in consumer demands (emphasis on food/basic necessities to diverse manufactured services)
Growth of cities and urban industries
Decline in family size and population growth
Structural Changes: Conclusion/Implications
Development is an identifiable process of growth and change, whose main features are similar in all countries
Pace and pattern of development can vary according to both domestic and international factors, many of which lie beyond the control of an individual developing nation
Factors influencing the development process:
Country’s resource endowment and size
Government’s policies and objectives
Availability of external capital and technology
International trade environment
Criticism/Limitation of Structural Change
“Put the cart before the horse”
Neglecting the rural sector
Observing developed-country patterns such as the decline of the share of the labor force in agriculture over time, many developing-country policymakers have been inclined to neglect that vital sector.
Conclusion: Structural-change analysts are basically optimistic that the “correct” mix of economic policies will generate beneficial patterns of self-sustaining growth.
THIRD APPROACH: International-Dependence Revolution
International-Dependence models view developing countries as beset by institutional, political, and economic rigidities, both domestic and international, and caught up in a dependence and dominance relationship with rich countries
Dependence
The reliance of developing countries on developed-country economic policies to stimulate their own economic growth.
Developing countries adopt developed-country education systems, technology, economic and political systems, attitudes, consumption patterns, dress, and so on.
Dominance
Developed countries have much greater power than the less developed countries in decisions affecting important international economic issues, such as the prices of agricultural commodities and raw materials in world markets
Three major streams of thought:
Neocolonial Dependence Model
Exploitation; highly unequal capitalist system ot rich-poor (tldr)
Underdevelopment exists in developing countries because of continuing exploitative economic, political, and cultural policies of former colonial rulers toward less developed countries.
Underdevelopment
Economic situation characterized by low levels of living in conjunction with absolute poverty, low income per capita, low rates of economic growth, dependence on foreign economies, high death rates, limited freedom (basta everything bad HSHSH)
Whether because rich nations are intentionally exploitative or unintentionally neglectful, the coexistence of rich and poor nations in an international system dominated by such unequal power relationships between the center (the developed countries) and the periphery (the developing countries) renders attempts by poor nations to be self-reliant and independent
Center = Economically developed countries
Periphery = Developing nations/countries
Center controls the periphery :(
Comprador Groups
Small but powerful elites in the the less developed countries
Local elites who act as fronts for foreign investors
Note: Underdevelopment is thus seen as an externally induced phenomenon, in contrast to the linear-stages and structural-change theories’ stress on internal constraints, such as insufficient savings and investment or lack of education and skills.
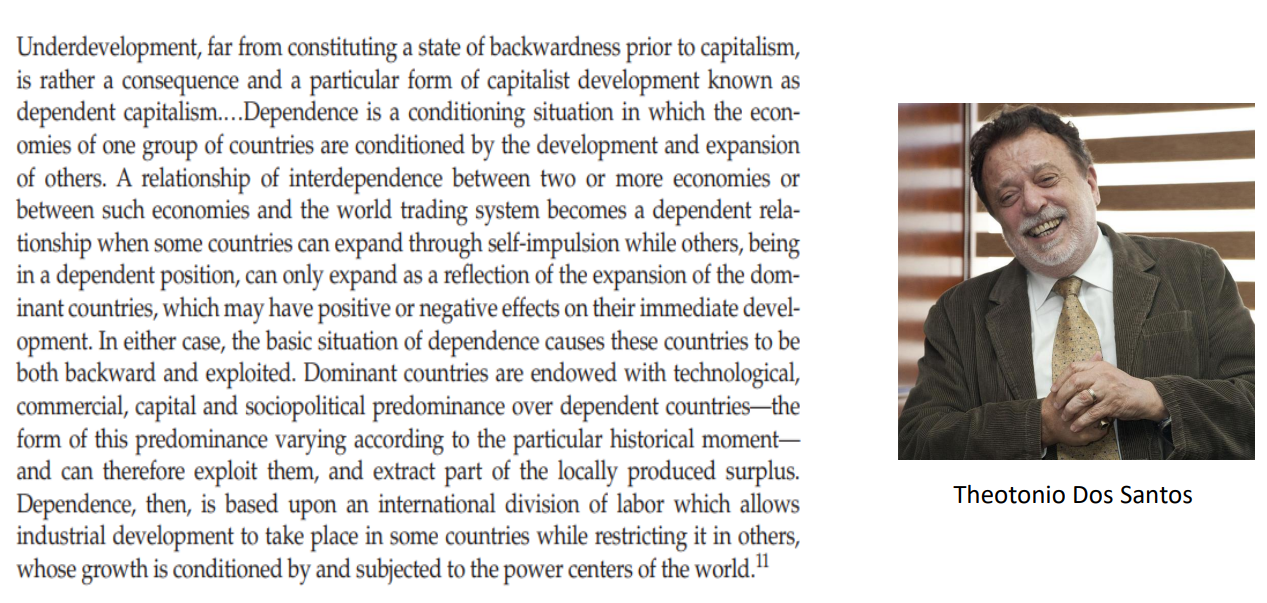
False-paradigm model
Tldr from class: Help developing countries through developed countries’ strategies (which will not work btw)
The proposition that developing countries have failed to develop because their development strategies (usually given to them by Western economists) have been based on an incorrect model of development, one that, for example, overstresses capital accumulation or market liberalization without giving due consideration to needed social and institutional change.
Dualistic-Development Thesis
Dualism
Tldr from class: There are rich and poor people; good and bad state is happening at the same time
Wala sana problem if tumutulong ‘yung rich sa poor
[Book] The coexistence of two situations or phenomena (one desirable and the other not) that are mutually exclusive to different groups of society—for example, extreme poverty and affluence, modern and traditional economic sectors, growth and stagnation, and higher education among a few amid large-scale illiteracy.
4 arguments of Traditional Dualism
Different sets of conditions, of which some are “superior” and others “inferior,” can coexist in a given space
Ex: Coexistence of modern and traditional methods of production in urban and rural areas; wealthy educated elites with masses of illiterate poor people; dependence notion of the coexistence of powerful and wealthy industrialized nations with weak
Coexistence is chronic and not merely transitional
Coexistence of wealth and poverty is not simply a historical phenomenon that will be rectified in time
Degrees of superiority or inferiority have an inherent tendency to increase
Ex: Productivity gap between workers in developed countries and their counterparts in most developing countries seems to widen
Interrelations between superior and inferior elements are such that the existence of superior elements does little or nothing to pull up the inferior elements
Conclusions and Implications
Dependence, false-paradigm, and dualism theorists place more emphasis on international power imbalances
Needed fundamental reforms locally and globally:
Economic
Political
Institutional
Extreme Cases: Outright expropriation of privately-owned assets
Expectation that public asset ownership and control will be a more effective to help eradicate poverty
Basically, majority believe that the way to go would be to have accelerated economic growth through reforms plus good development of public and private economic activity
Weaknesses of Dependence Theories
Don’t give insight/solution into how countries sustain development
Tldr from class: Kulang sa game plan
Government: Front seat; Private: Back seat
Actual economic experience of developing countries that have pursued revolutionary campaigns of industrial nationalization and state-run production has been mostly negative
Autarky
Closed economy that attempts to be self-reliant
Don’t acquire help from other people
Tldr from class: If problem is dependence, solution is independence
FOURTH APPROACH: Neoclassical Counterrevelotion: Market Fundalism
Neoclassical Counterrevolution
The 1980s resurgence of neoclassical free-market orientation toward development problems and policies, counter to the interventionist dependence revolution of the 1970s.
Tldr from class: Going back to basic supply and demand; they have an issue towards the government
Central Argument of Neoclassical Counterrevolution: Underdevelopment results from poor resource allocation due to incorrect pricing policies and too much state intervention by overly-active developing nation-governments.
Free Markets
The system whereby prices of commodities or services freely rise or fall when the buyer’s demand for them rises or falls or the seller’s supply of them decreases or increases.
Promoting free markets and laissez-faire economics within the context of permissive governments that allow the “magic of the marketplace” and the “invisible hand” of market prices to guide resource allocation and stimulate economic development.
Three component approaches of the neoclassical counterrevolution:
Free market analysis
Tldr from class: private sector knows best; government takes back seat
Theoretical analysis of the properties of an economic system operating with free markets, often under the assumption that an unregulated market performs better than one with government regulation
Public-choice theory (new political economy approach)
Tldr from class: Governments can do nothing right
The theory that self-interest guides all individual behavior and that governments are inefficient and corrupt because people use government to pursue their own agendas
Politicians = use government resources to consolidate and maintain positions of power and authority
Bureaucrats/Public Officials = use their positions to extract bribes from rent-seeking citizens and to operate protected businesses on the side
Market-friendly approach
Tldr from class: Government must foster free environment and do selective intervention
Successful development policy requires governments to create an environment in which markets can operate efficiently and to intervene only selectively in the economy in areas where the market is inefficient
The market-friendly approach also differs from the free-market and public-choice schools of thought by accepting the notion that market failures
Market Failure
Tldr from class: When a problem arises from the private sector, this is why the government intervenes
A market’s inability to deliver its theoretical benefits due to the existence of market imperfections such as monopoly power, lack of factor mobility, significant externalities, or lack of knowledge. Market failure often provides the justification for government intervention to alter the working of the free market.
Price mechanism leads to an inefficient allocation of resources and deadweight loss of economic welfare
Different types of Market Failure
Negative Externalities
“arise when one party, such as a business, makes another party worse off, yet does not bear the costs from doing so”
Caught off in making profit at the expense of others; thus, government should be there to mediate the actions of the government
Positive Externalities
Vaccine was produced in another country, and it’s high and low income/developing countries won’t be able to afford
Intervention: Government would mediate so distribution is fair + developing countries can also purchase
Public Good
Commoditor service made for everyone and is needed, but doesn’t render any income (lighthouse, overpass)
Entity that provides benefits to all individuals simultaneously and whose enjoyment by one person is no way diminishes that of anyone else
Non-excludability: Once provided you can’t stop anyone benefiting from the good
Non-rivalry: If somebody benefits from good, it doesn’t reduce the amount available for others
Free rider problem: Individual have an incentive to use good without contributing towards cost
Intervention: Since no one wants to provide, the government intervenes.
Merit Goods
Parents who chose to sacrifice their career to take good care of their children
De-merit goods
Not all problems can be solved by private sectors
Tobacco, Alcohol, Gabling
Information Failures
Lack of label in food establishments, governments should ensure that they adhere to the regulations
Monopolies
Only provider of the product that is in demand
Immobility of factor inputs
Traditional Neoclassical Growth Theory
Solow Neoclassical Growth Model
Tldr from class: Work on your technology because it is the key to development
Growth model in which there are diminishing returns to each factor of production but constant returns to scale.
Exogenous technological change generates longterm economic growth.
Solow Residual
Tldr from class: Steady-state key to long-term growth is technology
Proportion of long-term economic growth not explained by growth in labor or capital and therefore assigned primarily to exogenous technological change
[Output growth = technology, labor quality, and capital increase] According to TNGT, output growth results from one or more of three factors: increases in labor quantity and quality (through population growth and education), increases in capital (through saving and investment), and improvements in technology
Closed Economy
No external activities
No foreign trade transactions/other economic contacts with the rest of the world
Grow more slowly than those with high savings rate
Open Economy
Practices foreign trade and has extensive financial and nonfinancial contacts with the rest of the world
Experience income convergence at higher levels
This is preferred
Conclusion:
For the neoclassical revolutionists, underdevelopment is an internally induced phenomenon of developing countries are caused by too much government intervention and bad economic policies.
Summary of the Four Theories of Development
Theory | Short Summary |
|---|---|
Linear-stages model | Crucial role that saving and investment play in promoting sustainable long-run growth |
Lewis two-sector model of structural change | Transfers of resources from low-productivity to high-productivity activities in the process of economic development, attempting to analyze the many linkages between traditional agriculture and modern industry, and clarifying recent growth experiences such as that of China Chenery and associates’ research
|
International-Dependence
| Importance of the structure and workings of the world economy Decisions in the developed countries affect the lives of people in the developing world Developing Cs = dependent to the key economic decisions made in capitals of North America, Western Europe, or Japan Dualistic structures |
Conventional neoclassical economic theory | Promoting efficient production and distribution through a proper, functioning price system is an integral part of any successful development process Free markets and open economies along with universal disparagement of public-sector leadership |
Components of Economic Growth
Capital accumulation, including all new investments in land, physical equipment, and human resources through improvements in health, education, and job skills
Growth in population and hence eventual growth in the labor force
Technological progress—new ways of accomplishing tasks
[Talents + Tools + Technology = TAGUMPAY! <3]
Expounded terms:
Capital accumulation
Increasing a country’s stock of real capital (net investment in fixed assets).
Some proportion of present income is saved and invested in order to augment future output and income
Capital Stock → The total amount of physical goods existing at a particular time that have been produced for use in the production of other goods and services.
New factories, machinery, equipment, and materials increase the physical capital stock of a nation (the total net real value of all physically productive capital goods) and make it possible for expanded output levels to be achieved
Economic Infrastructure → facilitates and integrates economic activities
The amount of physical and financial capital embodied in roads, railways, waterways, airways, and other transportation and communications, plus other facilities such as water supplies, financial institutions, electricity, and public services such as health and education
Another example: Investment by a farmer in a new tractor may increase the total output of the crops he can produce, but without adequate transport facilities to get this extra product to local commercial markets, his investment may not add anything to national food production
Population growth/Increase in Labor Force
Larger Labor Force = More productive workers + increases the potential size of domestic markets
Production Possibility Curve
A curve on a graph indicating alternative combinations of two commodities or categories of commodities (e.g., agricultural and manufactured goods) that can be produced when all the available factors of production are efficiently employed. Given available resources and technology, the curve sets the boundary between the attainable and the unobtainable.
Ex: For a given technology and a given amount of physical and human resources, the production possibility curve portrays the maximum attainable output combinations of any two commodities— say, rice and radios—when all resources are fully and efficiently employed.
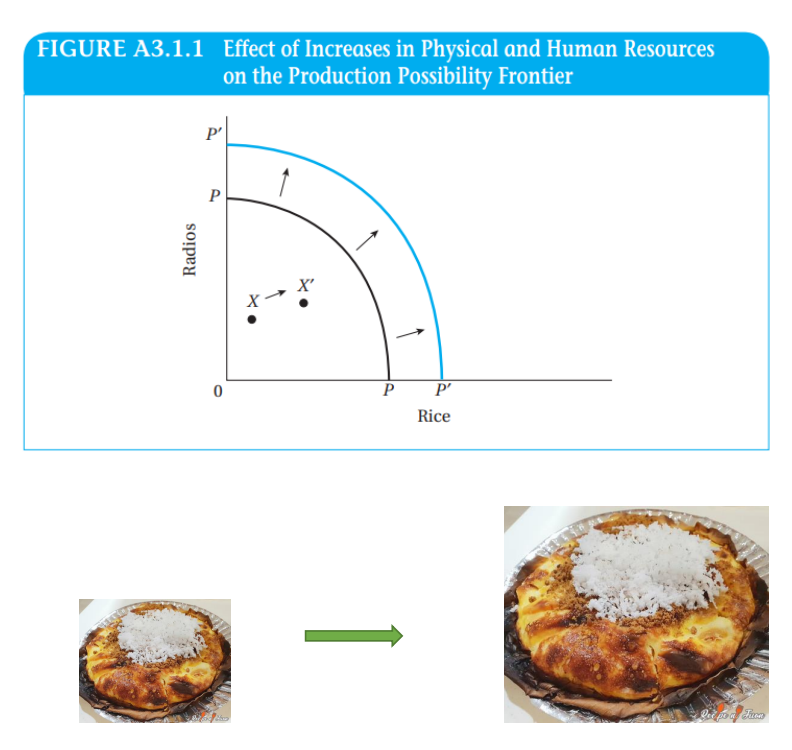
Technological Progress
Increased application of new scientific knowledge in the form of inventions and innovations with regard to both physical and human capital
Technology + Training = Higher PPF

Neural Technological Progress
Higher output levels achieved with the same quantity or combination of all factor inputs
Simple innovations like those that arise from the division of labor can result in higher total output levels and greater consumption for all individuals
Labor Saving technological progress
The achievement of higher output using an unchanged quantity of labor inputs as a result of some invention (e.g., the computer) or innovation (such as assembly-line production).
Computers, the Internet, automated looms, highspeed electric drills, tractors, mechanical ploughs
Reduces the need for physical capital
Capital-saving technological progress
Technological progress that results from some invention or innovation that facilitates the achievement of higher output levels using the same quantity of inputs of capital
More efficient (lower-cost) labor-intensive methods of production
Labor-augmenting technological progress
Technological progress that raises the productivity of an existing quantity of labor by general education, on-the-job training programs, and so on
Capital-augmenting Technological Progress
Technological progress that raises the productivity of capital by innovation and inventions
More productive use of existing capital goods [Substitute of steel for wooden plows]
Endogenous Growth Theory
Economic growth generated by factors within the production process that are studied as part of a growth model
Complementary Investments
Investments that complement and facilitate other productive factors
Romer Endogenous Growth
Endogenous growth model in which technological spillovers are present; the economy-wide capital stock positively affects output ath the industry level, so there may be increasing returns to scale at the economy-wide level
Criticisms of Endogenous Theory
Assumes single sector of production
All sectors are symmetrical
Inefficiences due to poor infrastructure, inadequate instituitional structures, and imperfect capital and goods market
Contemporary Models of Development and Underdevelopment |
|---|
Governments can certainly deter entrepreneurship when they try to do too much; but they can also deter entrepreneurship when they do too little
Development
Possible, but is difficult to achieve
Binding Constraints
One limiting factor that if relaxed would be the item that accelerates growth (or that allows a larger amount of some targeted outcome
Economic Agent
An economic actor—usually a firm, worker, consumer, or government official—that chooses actions so as to maximize an objective; often referred to as “agents.”
Complementarities
[Bandwagon] When complementarities are present, an action taken by one firm, worker, or organization increases the incentives for other agents to take similar actions
Tldr from class: Someone has a successful idea = others follow you
Examples:
Firms with specialized skills and availability of specialized workers
Commercialization of agriculture and availability of market
Middlemen play a key role in the development of agricultural markets by vouching for the quality of the products they sell
Technology
Underdevelopment as Coordination Failure
Coordination Failure
A situation in which the inability of agents to coordinate their behavior (choices) leads to an outcome (equilibrium) that leaves all agents worse off than in an alternative situation that is also an equilibrium.
Why?
Lack of information
Different expectations
“Waiting game” (Private Sectors)
If the private sector won’t or can’t do it, who will? → GOVERNMENT
Big Push
Government takes the lead in growing NEW industries and skills
Concerted, economy-wide, and public policy-led effort to initiate or accelerate economic development across a broad spectrum of new industries and skills
O-ring model
Complementarities
Upgrading skills or quality depends on similar upgrading by other agents
An economic model in which production functions exhibit strong complementarities among inputs and which has broader implications for impediments to achieving economic development
Middle-Income Trap
Condition in which an economy begins development to reach middle-income status but is chronically unable to progress to high-income status.
Possible Solutions: Innovation, Technology, and Equity
Underdevelopment Trap
Region remains stuck in subsistence agriculture
A poverty trap at the regional or national level in which underdevelopment tends to perpetuate itself over time.
Chicken and egg problem: Which comes first, the skills or the demand for skills?
Complementary investments must come at the same time, through coordination.
Role for Government Policy in coordinating joint investments
Workers who want skills that employers can use and the employers who want equipment that workers can use. Neither may be in a position (or find it in their self-interest) to take the first step; each may be better off waiting for the other parties to invest first.
Deep Intervention
Government policy can still help, even when the government is imperfect
A government policy that can move the economy to a preferred equilibrium or even to a higher permanent rate of growth, which can then be self-sustaining so that the policy need no longer be enforced because the better equilibrium will then prevail without further intervention.
Government can then concentrate its efforts on other crucial problems in which it has an essential role (e.g., in addressing problems of public health).
Congestion
Opposite of complementarity
Action taken by one agent that decreases the incentives for other agents to take similar actions
The more people there are fishing in one lake, the more fishers try to move to another lake that is less crowded/Traffic in a road → Find other road
Where-to-meet dilemma
Situation in which all parties would be better off cooperating than competing but lack information about how to do so
COMMUNICATION is the solution
Example PPT: Bonnie and Clyde rob and get caught bc of lack of communication
Example: : Several friends know that they will all be in Buenos Aires on a certain day but have neglected to settle on a specific location within the city. Now they are out of communication and can arrive at a common meeting point only by chance or by very clever guessing
Prisoner’s Dilemma
Prisoners pursue self-interest
Communication could have helped → You don’t always win through competing; it’s more on joining them
Cooperating than competing, but once cooperation has been achieved, each party would gain the most by cheating, provided that others stick to cooperative agreements
Cooperation is possible → You need to set aside differences
Multiple Equilibria
More than one equilibrium exists
Equilibria is ranked
One is preferred over the other
Companies starting to challenge themselves
Pareto Improvement
A situation in which one or more persons may be made better off without making anyone worse off
TLDR from class: It’s knowing what to prioritize and knowing what resources you’ll put
Example: Coordinating investment decisions when the value (rate of return) of one investment depends on the presence or extent of other investments
Pecuniary Externality
A positive or negative spillover effect on an agent’s costs or revenues
Negative Externalities
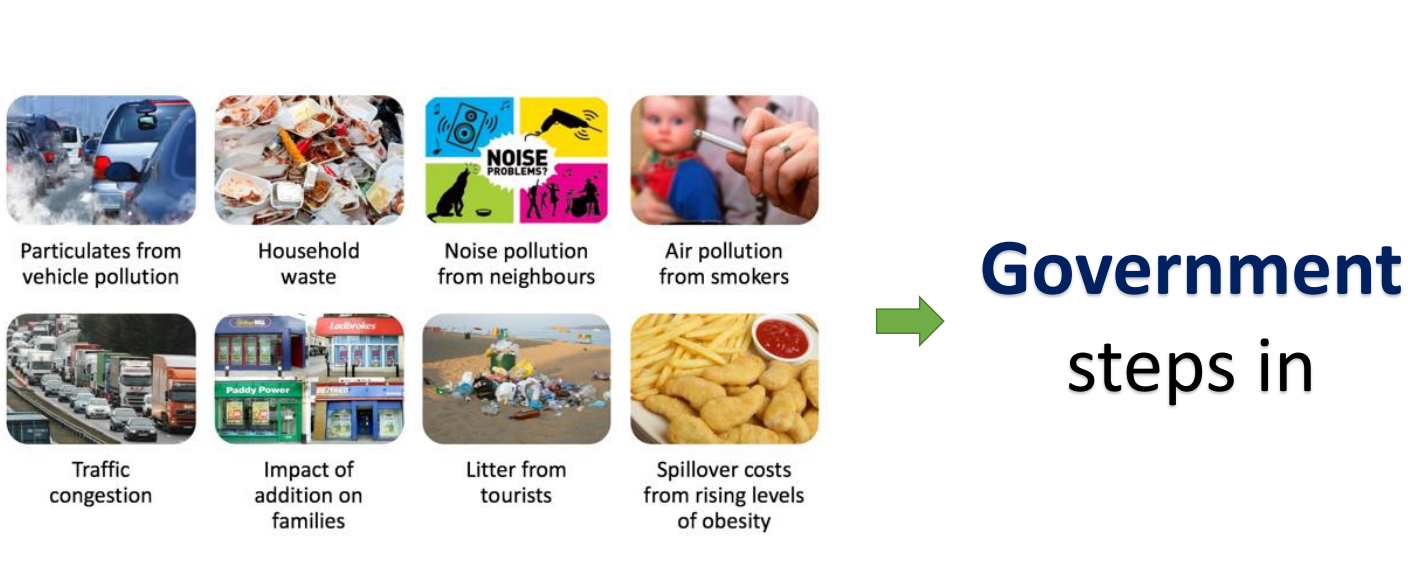
Positive Externalities
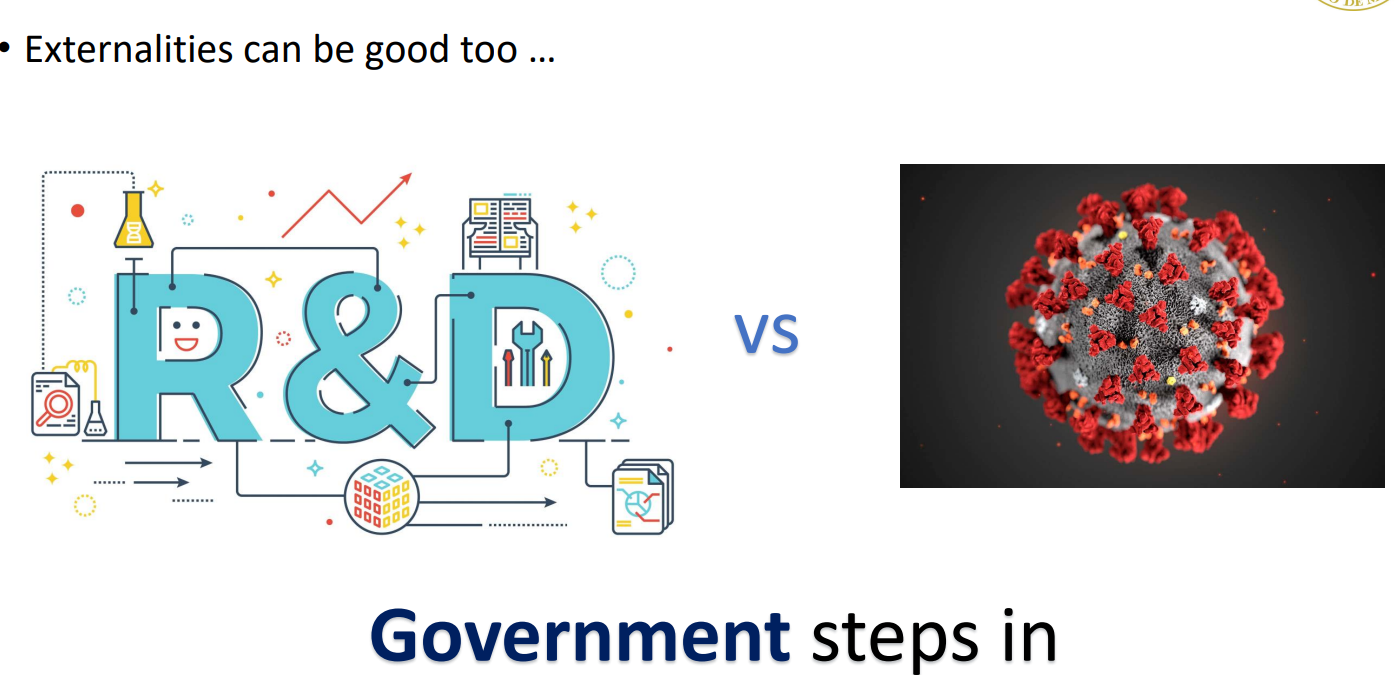
Perhaps the most famous coordination failures model in the development literature is that of the “big push,” pioneered by Paul Rosenstein-Rodan
Big Push
A concerted, economy-wide, and typically public
policy-led effort to initiate or accelerate economic development across a broad spectrum of new industries and skills
Assumptions of Big Push
Factors
Only 1 Factor of Production – Labor and supply of Labor is fixed
Factor Payments
Labor Market has two sectors
Workers in the traditional sector: Wage of 1
Workers in the modern sector: W>1
Tldr from class: No company can start industrialization on its own. They need oter companies to grow. The Government will start on things already, and the private sector will just follow their lead
Technology
Constant returns to scale in traditional sector (Eg. Put in 20, Get 20)
Increasing returns to scale in modern sector (Eg. Put in 20, Get 40)
Domestic Demand
Each good receives a constant and equal share of consumption out of national income
International Supply and Demand
Economy is closed
Market Structure
Perfect competition in the traditional sector
Free entry
No economic profits
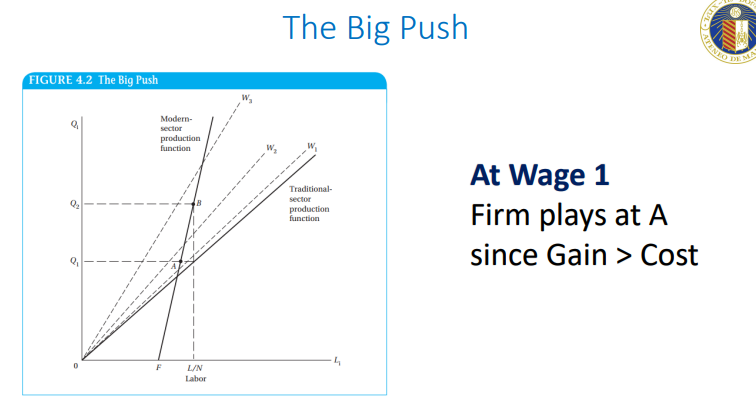
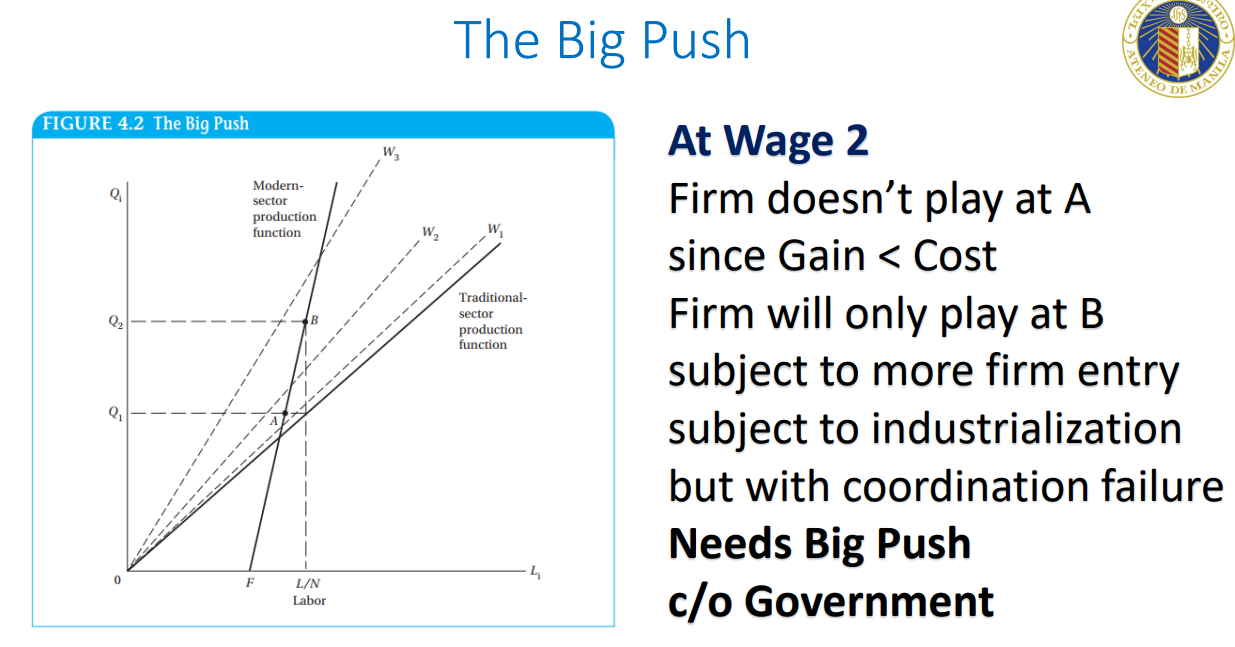
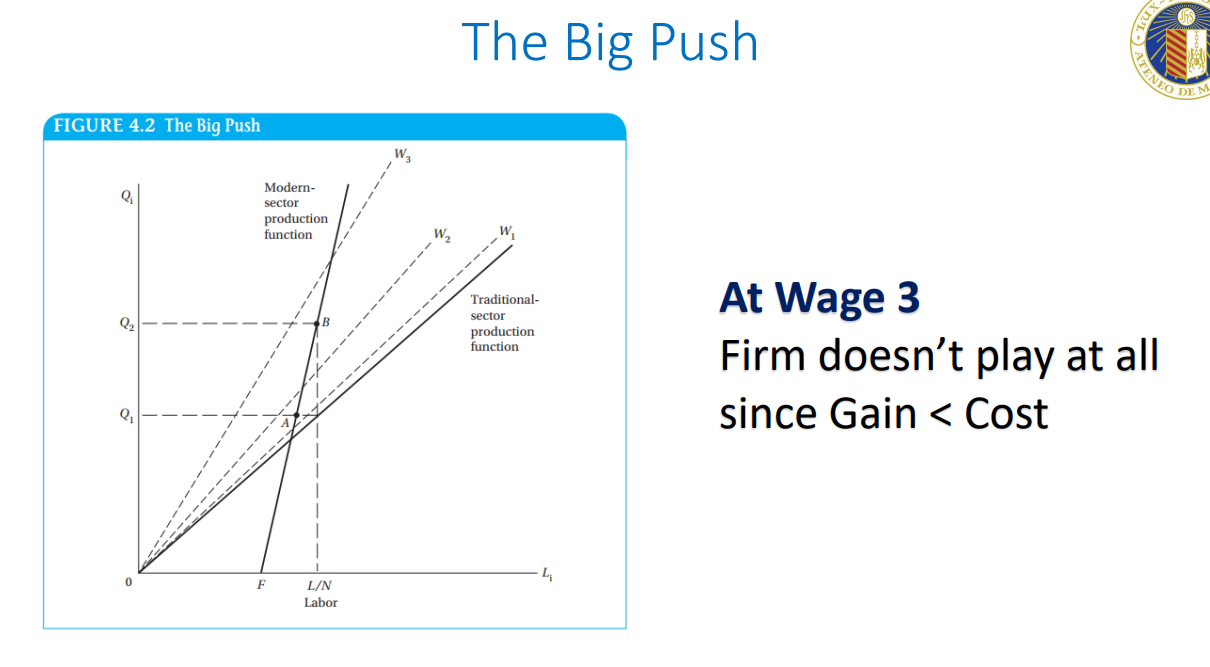
Technological Externality
TLDR from class: Learning from watching; type of market failure that can lead to low investment
Positive or negative spillover effect on a firm’s production function through some means other than market exchange
Presence of one advanced firm can, through “learning by watching” other firms’ production methods or some similar effect, generate spillovers to other firms that can raise their productivity as well as lower their co
4 Cases that Justify Big Push
Intertemporal Effects
Even if the industrial wage rate is 1 (i.e., the same as the traditional-sector wage), multiple equilibria can occur if investment must be undertaken in the current period to get a more efficient production process in the next period.
Urbanization Effects
If some of the traditional cottage industry is rural and the increasing-returns-to-scale manufacturing is urban, urban dwellers’ demand may be more concentrated in manufactured goods (e.g., foods must be processed to prevent spoilage due to the time needed for transportation and distribution).
If this is the case, one needs a big push to urbanization to achieve industrialization
Infrastructure Effects
An investing modern firm helps defray the large fixed costs of that infrastructure.
The existence of the infrastructure helps investing firms lower their own costs
Infrastructure, such as roads, railroads, and ports, is not tradable; by definition, it is located in a particular region
Training Effects
Underinvestment in training facilities because entrepreneurs know that the workers they train may be enticed away with higher wages offered by rival firms that do not have to pay these training costs.
Little demand by workers for training because they do not know what skills to acquire
Why a Super-Entrepreneur is not enough?
Capital Market Failures
How could one agent assemble all the capital needed to play the super-entrepreneur role?
Agency Costs
Costs of monitoring managers and other employees and of designing and implementing schemes to ensure compliance or provide incentives to follow the wishes of the employer.
TLDR from class: Clear dapat yung job description para ‘di varying ‘yung responses. Dapat may KPIs
Assymetric Information
“Lemons Problem”
One party to a potential transaction (buyer, seller, lender) has more information than the other party
Limits to knowledge
Even if we stipulate that the economy as a whole has access to modern technological ideas, this does not mean that one individual can gain sufficient knowledge to industrialize (or even gain enough knowledge about whom to hire to industrialize)
No agent has proven to be an Super-Entrepreneur
Rather, public coordination of actions of private investors is generally needed to solve the problem, a common interpretation of the role of industrial policy in East Asia
In a nutshell
Pecuniary externalities associated with the development process → multiple equilibria → big push policy
Problems of Multiple Equilibria
Inefficient Advantages of Incumbency
Economy can be stuck with backward, less cost-effective industries
Behavior and Norms
TLDR from class: If you’ve been accustomed to culture of dishonesty/shortcut = challenge to change is hard
Movement to a better equilibrium is especially difficult when it involves many individuals changing their behavior from one of rent seeking or corruption to honesty and the value of building a reputation to reap the gains from cooperation (e.g., with business partners).
We cannot rely on good organizations to prevail in competition if the rules of the game tend to reward the bad organizations
Once cooperative relationships (e.g., in business) become a norm, more people may adopt cooperative behavior.
Linkages
One strategy for solving coordination problems is to focus government policy on encouraging the development of industries with key backward or forward linkages.
Connections between firms based on sales.
Backward linkage is one in which a firm buys a good from another firm to use as an input; raise demand for an activity
Forward linkage is one in which a firm sells to another firm; lower the costs of using an industry’s output
Poverty
Stuck in Poverty
A bad equilibrium for a family, community, or nation, involving a vicious circle in which poverty and underdevelopment lead to more poverty and underdevelopment, often from one generation to the nex
O-Ring Theory of Economic Development
Michel Kremer
Modern Production requires that many activities be done well together in order for any of them to amount to a high value
The higher the skill is, the higher the probability that the task will be “successfully completed”
Positive Assortative Matching
Workers with high skills will work together and workers with low skills will work together.
When we use the model to compare economies, this type of matching means that high-value products will be concentrated in countries with high-value skills.
A firm with a higher-productivity worker can more afford to pay a higher wage and has the incentive to bid higher to do so, because the value of output will be higher with two productive workers, say, than with one low- and one high-productivity worker
Implications of the O-Ring Theory
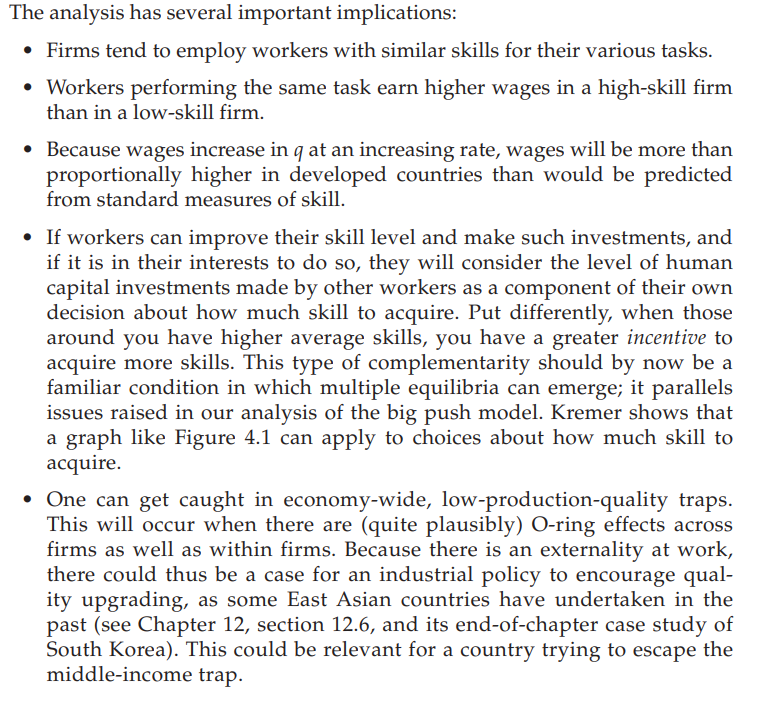
Economic Development as Self-Discovery
It is not enough to tell a developing nation to specialize in “labor-intensive products,” because even if this were always true, there are a vast number of such products in the world economy of today, and underlying costs of production of specific products can differ greatly from country to country
Information Externality
The spillover of information— such as knowledge of a production process—from one agent to another, without intermediation of a market transaction
It reflects the public good characteristic of information (and susceptibility to free riding) — it is neither fully excludable from other uses, nor nonrival (one agent’s use of information does not prevent others from using it).
Self-discovery
Assumption that the products in question have already been discovered by someone else (either long ago, or recently in a developed economy); what remains to be discovered is which of these products a local economy is relatively good at making
3 Building Blocks of Hausmann and Rodrik
There is uncertainty about what products a country can produce efficiently
There is a need for local adaptation of imported technology so that it cannot be used productively “off the shelf”
Imitation is often rapid
Hausmann-Rodrik-Velasco Growth Diagnostics
“One size fits all” policy for economic development is recognized as a myth
Different countries face different binding constraints on achieving faster rates of growth and economic development.
A key mission for economic development specialists is to help determine the nature of the constraints for each country
Growth Diagnostics
A decision tree framework for identifying a country’s most binding constraints on economic growth
Social Returns
The profitability of an investment in which both costs and benefits are accounted for from the perspective of the society as a whole
Low returns
May be caused by what is termed low private appropriability, meaning limited ability of investors to reap an adequate share of the rewards of their otherwise profitable investments
Causes of Low Social Returns
Poor Geography
tropical pests, mountains, and other physical barriers, distance to world markets, and landlocked status
Low Human Capital
skills and education as well as health of workers—are complementary with other factors in production, affecting the returns to economic activity.
Bad Infrastructure
inadequate and imbalanced infrastructure is the main factor preventing an acceleration of growth, and in such cases, policies focusing on providing it would boost investment and growth the most