M3L1: Chart Types
🔹 1. Overview: Importance of Charts in Technical Analysis
Charts are foundational tools for technical analysts.
The best chart is the one you understand well and can use consistently with discipline.
Charts reflect market psychology (greed, fear, sentiment shifts).
📊 2. Comprehensive Guide to Chart Types
🔸 Line Chart
Definition: Plots only the closing prices over time.
Use: High-level trend identification.
Advantages: Simple, uncluttered.
Limitations: Omits volatility (open, high, low).
Ideal For: Long-term investors.
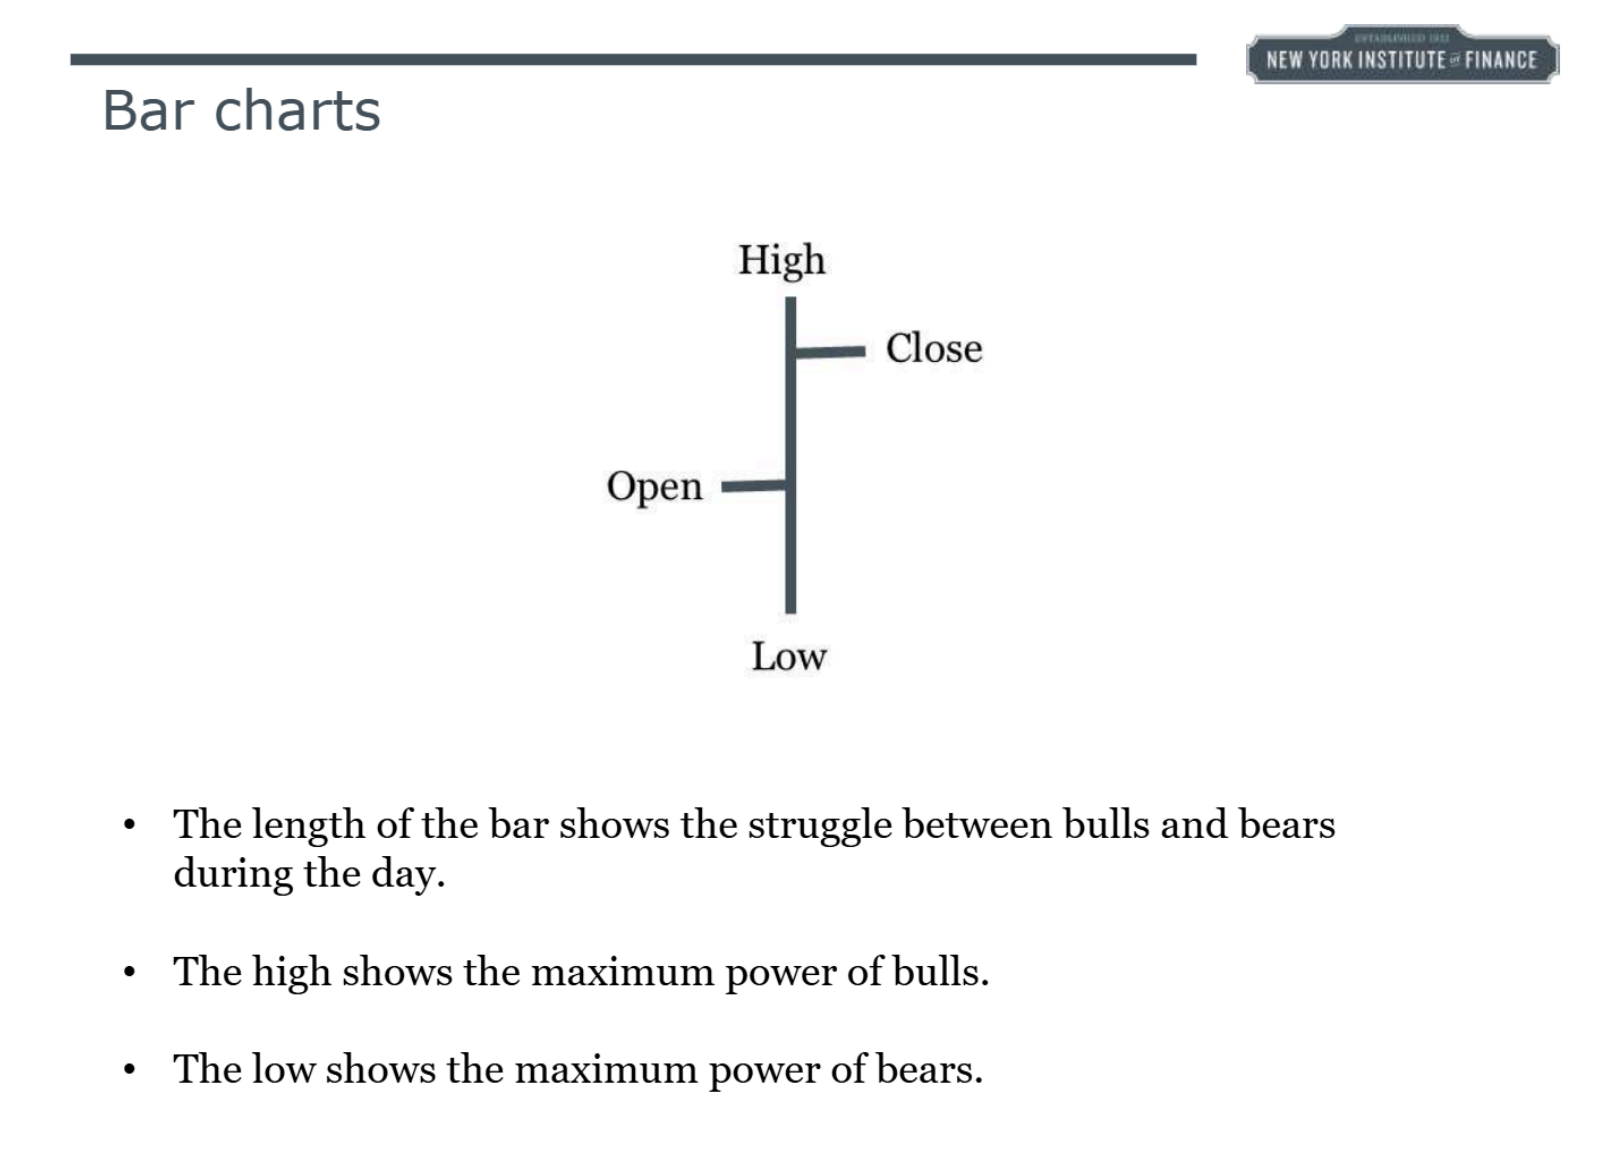
🔸 Bar Chart (OHLC)
Definition: Shows Open, High, Low, and Close prices.
Structure: Left tick = open, right tick = close; vertical line = high/low.
Advantages: Shows daily range and volatility.
Use Case: Intraday and daily traders.
Insights: Close near high = bullish; close near low = bearish.
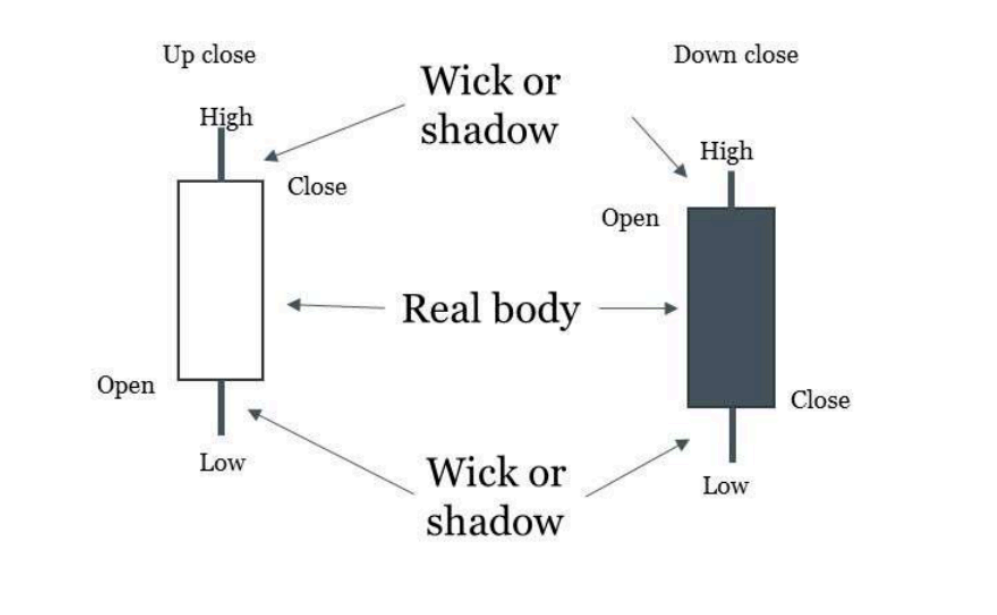
🔸 Candlestick Chart
Definition: Visual form of OHLC with colored bodies.
Structure: Rectangle (body) between open and close; wicks show high/low.
Color: Green = bullish; Red = bearish.
Use: Identifying short-term patterns.
Note: Candlestick patterns forecast only 1–3 candles ahead.
🔸 Point and Figure Chart
Definition: Price-only chart that omits time; tracks direction.
Symbols: X = rising, O = falling.
Use: Clear breakout/breakdown signals.
Ideal For: Long-term trend traders.
Advantages: Reduces noise; predefined signals.
🔸 Heikin-Ashi
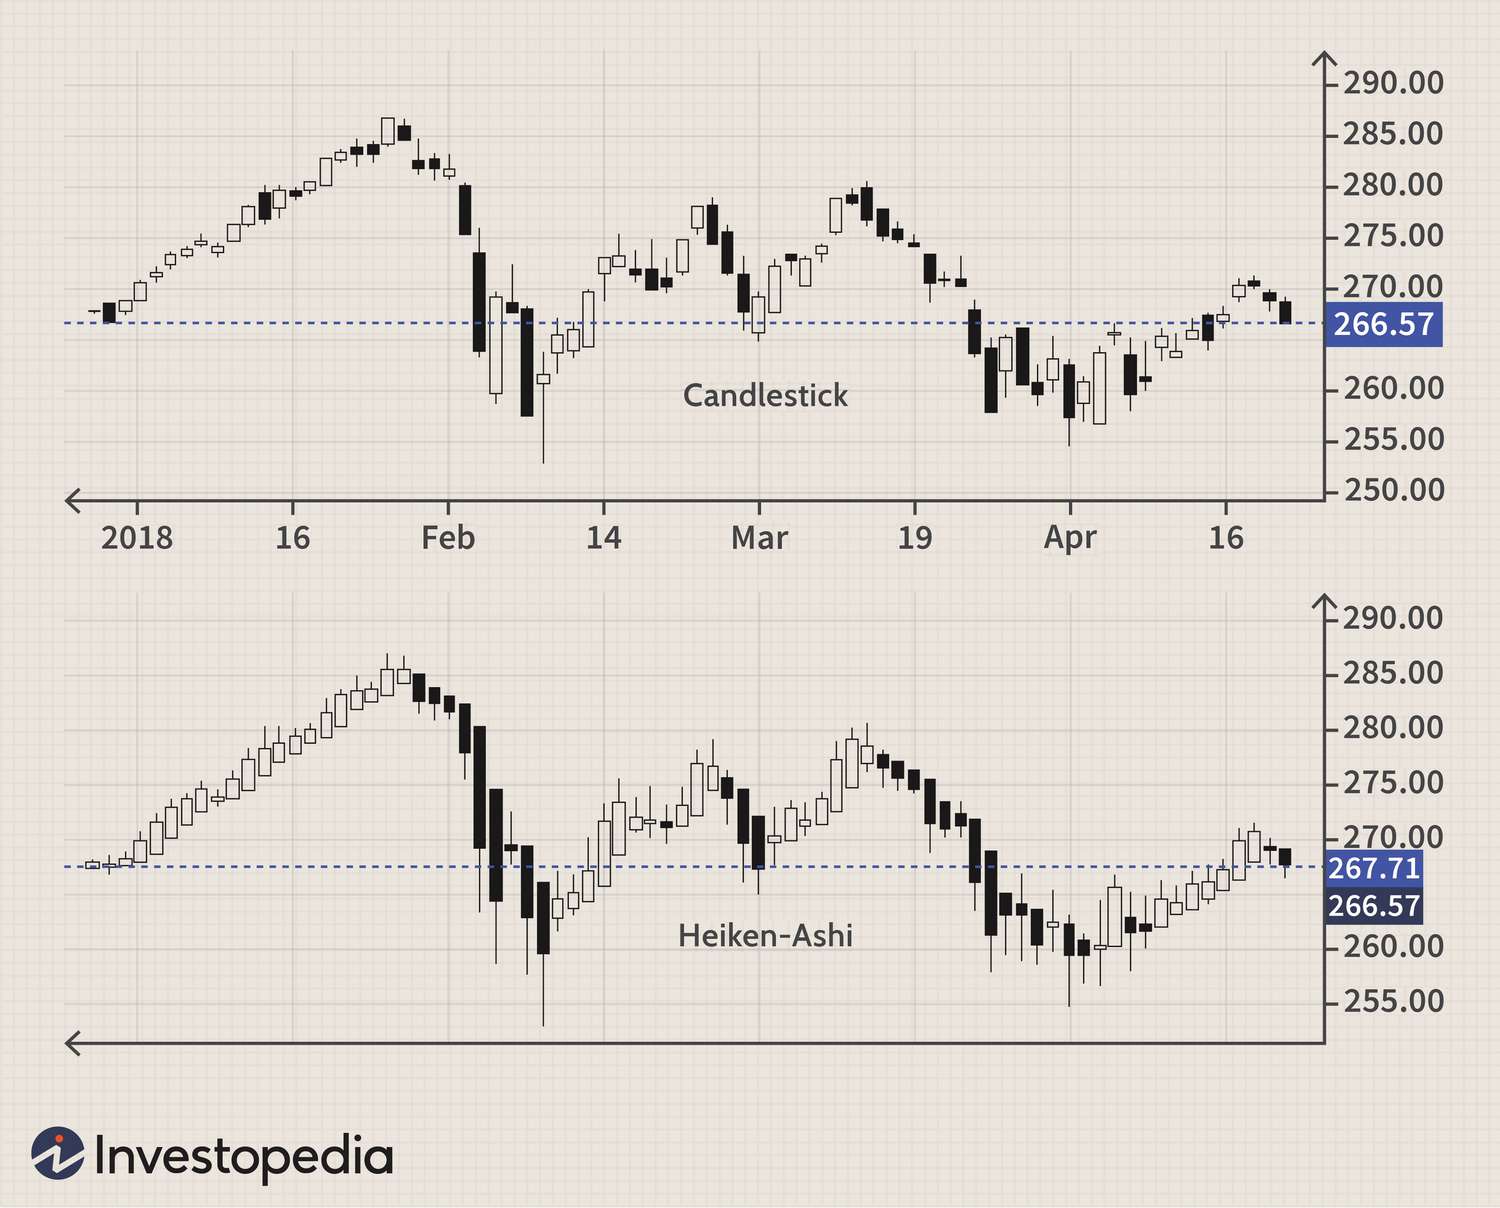
Definition: Smoothed candlestick chart using averages.
Calculation:
Open = (Previous Open + Previous Close) / 2
Close = (Open + High + Low + Close) / 4
Use: Highlight trends, reduce noise.
Limitation: Lags actual price.
🔸 Renko Chart
Definition: Price-only chart using "bricks" of equal size.
Advantage: Filters out minor fluctuations.
Best For: Trend following.
Note: Time is not a factor.
🔸 Kagi Chart
Definition: Line thickness changes with reversals.
Signal: Thick = bullish; Thin = bearish.
Use: Supply and demand shifts.
💪 3. Strategic Insights from Chart Types
📅 Timeframe Matters
Chart patterns are fractal — they repeat across timeframes.
Match your strategy's timeframe to the chart's timeframe.
Avoid reacting to intraday charts if you're a long-term investor.
⚖ Log vs. Arithmetic Scale
Log scale is better for long-term analysis; adjusts for percent changes.
Arithmetic scale may distort older data.
Example: 1929 crash is visible on log scale, hidden on arithmetic.
💡 Chart Psychology
Charts reflect social mood and behavioral cycles.
Chart analysis can offer insight into broader trends (e.g., Brexit, 1920s U.S.).
🔄 Closing Price Importance
Closing prices matter more now due to ETFs and institutional flows.
Many strategies use closing prices for signal confirmation.
🤝 Volume Relevance
Historically important, but less useful today due to HFT and options.
Use with caution: Can be misleading in fragmented markets.
🌐 Popularity and Regional Preferences
Bloomberg study:
Line charts most common globally.
Candlesticks popular in Asia.
Middle East: preference for line charts.
✅ Final Takeaways
Choose the chart that aligns with your comfort, strategy, and timeframe.
Understand the strengths and weaknesses of each chart type.
Combine chart interpretation with other tools (e.g., MACD, RSI).
Maintain discipline and consistency above all else.