Population Genetics
Introduction to Population Genetics
Definition: Study of how allele and genotype frequencies change over generations.
Fundamental question: If we know the population composition in one generation, what will it be in the next generation?
Key factors influencing population composition:
Mating patterns
Offspring survival
Generation dynamics
Terminology in Population Genetics
Alleles: Different forms of the same gene (e.g., A and a).
Gene Frequency: Proportion of each gene/allele in the population.
Genotype: Genetic combination of alleles at a given locus. Types of genotypes:
Homozygous Dominant: AA
Heterozygous: Aa
Homozygous Recessive: aa
Genotype Frequency: Proportion of individuals with each genotype in the population.
Phenotype: Observable physical traits that result from genotype.
Genes and Genotypes Examples
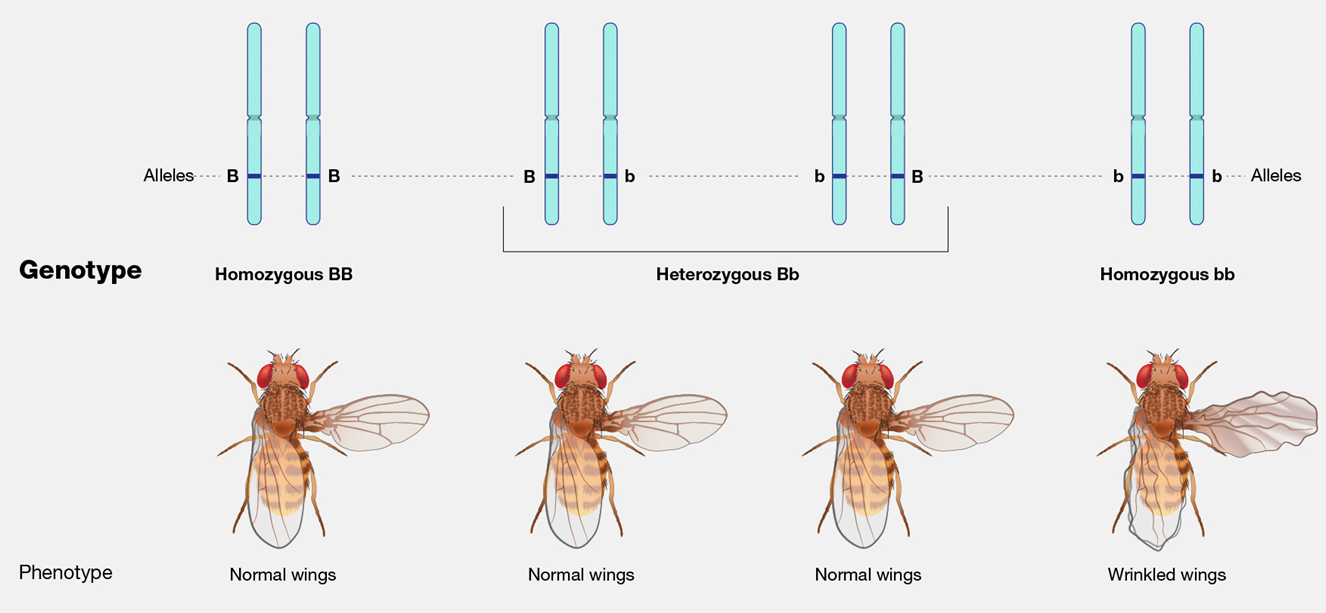
The Hardy-Weinberg Principle
Definition: Allele and genotype frequencies in a population will not change from generation to generation when no evolutionary forces are acting upon it.
Founders: G. H. Hardy & W. Weinberg.
Hardy-Weinberg Equilibrium
Formula: where:
is the frequency of allele A
is the frequency of allele a
Genotype frequencies: where:
= Frequency of homozygous dominant (AA)
= Frequency of heterozygous (Aa)
= Frequency of homozygous recessive (aa)
Occurs in the absence of evolution.
Hardy-Weinberg Equations Overview
Genotype Frequency Calculation:
Genotypes are AA, Aa, aa and their respective frequencies are P, Q, R.
Hardy-Weinberg gives the relationships:
Requirement: The sum of frequencies should equal 1: and .
Assumptions for Hardy-Weinberg Equilibrium:
No mutation
Random mating
No gene flow (in or out)
Very large population size
No natural selection
If any assumption is violated, equilibrium is disrupted.
Example: Calculating Observed Genotype Frequencies
In a population of 8 individuals:
3 are AA, 3 are Aa, 2 are aa.
Calculations:
Frequency of AA (P) =
Frequency of Aa (Q) =
Frequency of aa (R) =
Check Sum:
Calculating Observed Allele Frequencies
Total number of genes in a population defines its gene pool.
In the same population of 8 individuals:
Consider alleles:
AA, AA, AA, Aa, Aa, Aa, aa, aa
Calculate:
Frequency of A (p) =
Frequency of a (q) =
Check Sum:
= .
Allele Frequencies from Genotype Frequencies
Formula:
Example:
If a population consists of 40% AA, 30% Aa, and 30% aa:
Calculations:
Check Sum:
Calculating Expected Allele Frequencies
To calculate from the homozygous recessive genotype frequency :
Example: If 7% of individuals display the recessive phenotype:
Calculation of :
Note: Calculations should always start with the recessive genotype/allele.
Practical Example
Given:
(frequency of dominant allele for dark fur)
(frequency of recessive allele for tan fur)
Algebraically:
Total genotype frequencies:
Breakdown:
Genotype Frequencies:
DD: 0.49
Dd: 0.42
dd: 0.09
Gamete Frequencies:
Offspring gametes generated at random from parental genotypes:
Application of Hardy-Weinberg Principle
Example: 3 in every 1234 individuals have a recessive disease:
Afflicted individuals have homozygous recessive genotype:
Calculate allele and gene frequency:
Frequency of afflicted,
= Sqrt
Frequency of carriers (heterozygous):
Number of carriers =
Population Genetic Studies Examples
Blood Groups Analysis
Data Collection: For different populations:
Observed frequencies and expected proportions among groups:
African American:
Observed: 79 LmLm, 138 LmLn, 61 LnLn; Total = 278
Expected proportions: 0.284 for LmLm, 0.499 for LmLn, 0.219 for LnLn.
European American:
Observed: 1787 LmLm, 3039 LmLn, 1303 LnLn; Total = 6129
Native American:
Observed: 123 LmLm, 72 LmLn, 10 LnLn; Total = 205
Expected frequencies were determined using Hardy-Weinberg equations for respective allele frequencies.
Jaeken Syndrome
Definition: Carbohydrate-Deficient Glycoprotein Syndrome, inherited recessive disease.
Symptoms include:
Skeletal deformities
Inadequate liver function
Abnormal fat distribution
High mortality rate among patients under 5 years of age.
Mutation identified in PMM2 gene which is significant for glycoprotein synthesis.
Patients are homozygous, harboring two mutant alleles.
Mutations Identified: List of numerous point mutations and their corresponding amino acid changes.
Frequency Analysis in Jaeken Syndrome Patients
Among 54 patients, most frequent mutation was R141H. Observed genotypes:
0/54 R141H/R141H = R
11/54 other/other = P
Resulting frequencies:
other/other: 0.2037
R141H/other: 0.7963
R141H/R141H: 0
Calculation of expected genotype frequencies based on Hardy-Weinberg Equilibrium derived from observed frequencies.
Statistical Analysis: Chi-Square Test
Used to determine if significant differences exist between observed and expected genotype frequencies.
Formula to calculate chi-square value:
Application of the chi-square test to Jaeken Syndrome patient genotype frequencies:
Observed and expected frequencies calculation and comparison:
Genotypes (R141H/R141H, R141H/other, other/other)
Resulting chi-square values were computed to assess significance.
Conclusion and Implications
The analysis concluded that the investigated alleles within the PMM2 locus are not in Hardy-Weinberg equilibrium in the Jaeken Syndrome population, indicating potential evolutionary influences.