RNR 2101 Final Exam LSU Stouffer
Concepts
Measuring primary productivity
Primary production is the production of new organic matter, or biomass, by autotrophs in an ecosystem per unit area or volume during some period of time. In fact, not just primary production but all forms of ecological production are expressed per unit of area or volume
(e.g., per m2 or per m3 ) and per unit of time (e.g., per hour or per year).
Is mainly measured as rate of carbon uptake by primary producers or by the amount of biomass or oxygen produced
Secondary production is the production of biomass by heterotrophic consumer organisms
feeding on plants, animals, microbes, fungi, or detritus during some period of time.
analogous to net primary production, includes consumer growth, reproduction, and, at the population level, mortality.
Photosynthesis:
CO2 + H20 → C6H12O6 + 02
Low energy CO2 becomes fixed into a high energy sugar
Photosynthesis can be considered as a rate:
the amount of C6H12O6 produced /unit area /unit time
Gross primary productivity = GPP = the rate of carbon fixation by autotrophs in some system
Net primary productivity = NPP = GPP – respiration of autotrophs = rate of accumulation of biomass
Transpiration = (water loss through open stomata) increases with increasing photosynthesis
Evapotranspiration = ET = (evaporation + transpiration) = a measure of water availability and photosynthesis
Annual actual evapotranspiration (AET) = total amount of water that evaporates and transpires off a landscape during the course of a year
Variation in primary productivity
Limits of Primary Production
Aquatic primary production is generally limited by nutrient availability. Phosphorus concentration usually limits rates of primary production in freshwater ecosystems, whereas nitrogen concentration usually limits rates of marine primary production.
Terrestrial primary production is generally limited by temperature, moisture, and nutrients. The variables most highly correlated with variation in terrestrial primary production are temperature and moisture. Highest rates of terrestrial primary production occur under warm, moist conditions. Soil nutrients limit productivity in many terrestrial systems.
Broad patterns in reference to the limits of primary productivity in ecology can be categorized into three main factors: light availability, nutrient availability, and temperature.
Light Availability: Primary productivity is limited by the amount of light reaching the photosynthetic organisms. Light availability decreases with increasing depth in aquatic ecosystems and with increasing canopy density in terrestrial ecosystems.
Nutrient Availability: Primary productivity is also limited by the availability of essential nutrients such as nitrogen, phosphorus, and potassium. Nutrient limitation can vary depending on the ecosystem type, with different nutrient ratios affecting primary productivity.
Temperature: Temperature plays a crucial role in primary productivity. It affects the rate of photosynthesis and metabolic processes in organisms. Extreme temperatures, either too high or too low, can limit primary productivity.
These broad patterns help us understand the factors that control primary productivity in different ecosystems and how they influence the overall functioning of ecological systems.
Trophic cascades - involves effects of predators on prey that alter abundance, biomass, or productivity of a population, community, or trophic level across more than one link in the food web. Because predators’ influence on ecosystem properties, such as primary production, occur through their effects on intermediary species, trophic cascades involve indirect interactions.
Top-down control in ecology refers to the regulation of a population or community by the influence of predators or higher trophic levels. It suggests that the abundance and behavior of lower trophic levels are primarily controlled by the presence and activities of their predators or higher-level consumers. This control can occur through direct predation or indirect effects. Overall, top-down control plays a crucial role in shaping the structure and dynamics of ecosystems.
Bottom-up control in ecology refers to the influence of lower trophic levels on the abundance and distribution of higher trophic levels within an ecosystem. It suggests that the availability of resources at the base of the food chain, such as plants or primary producers, determines the population dynamics and behavior of organisms at higher trophic levels. In this control mechanism, changes in the abundance or quality of resources at the bottom of the food chain can have cascading effects on the entire ecosystem.
Energy loss through tropic levels
Energy loss through trophic levels refers to the decrease in available energy as it moves up the food chain or trophic levels. This loss occurs due to various factors such as metabolic processes, heat loss, and incomplete digestion.
Primary producers (plants) capture a certain amount of energy from the sun through photosynthesis. As herbivores consume plants, only a fraction of the energy is transferred to their bodies as biomass. This energy is then passed on to the next trophic level, such as carnivores or secondary consumers.
At each trophic level, energy is lost through respiration, movement, and waste production. This loss of energy limits the number of trophic levels in an ecosystem and explains why there are fewer top-level predators compared to primary producers. Overall, energy loss through trophic levels is a fundamental concept in understanding the flow of energy in ecosystems.
Biomass decline through tropic levels
Biomass loss through trophic levels refers to the decrease in biomass (total mass of living organisms) as energy is transferred from one trophic level to the next in a food chain or food web. This loss occurs due to inefficiencies in energy transfer and metabolic processes. On average, only about 10% of the energy is transferred from one trophic level to the next, resulting in a biomass loss of approximately 90% between trophic levels. This phenomenon is known as the 10% rule.
Processes moving carbon into and out of the atmosphere
Carbon moves between organisms and the atmosphere as a consequence of two reciprocal biological processes: photosynthesis and respiration. Photosynthesis removes CO2 from the atmosphere, whereas respiration by primary producers and consumers, including decomposers, returns carbon to the atmosphere in the form of CO2.
In aquatic ecosystems, CO2 must first dissolve in water before being used by aquatic primary producers. Once dissolved in water, CO2 enters a chemical equilibrium with bicarbonate, HCO3−, and carbonate, CO3−. Carbonate may precipitate out of solution as calcium carbonate and may be buried in ocean sediments.
While some carbon cycles rapidly between organisms and the atmosphere, some remains sequestered in relatively unavailable forms for long periods of time. Carbon in soils, peat, fossil fuels, and carbonate rock would generally take a long time to return to the atmosphere. Human tapped CO2 is increasing.
Sources and processes that fix nitrogen
Nitrogen fixation is the process by which atmospheric nitrogen is converted into a usable form, such as ammonia (NH3) or nitrate (NO3), by certain bacteria or through industrial processes. This conversion allows plants to utilize nitrogen for growth and is essential for the nitrogen cycle.
N2 in atmosphere is fixed by these three natural processes:
lightning
cyanobacteria (= blue-green algae)
Some lichens also fix nitrogen using cyanobacterial symbionts, which can be important for soil building
some soil bacteria - root nudules with nitrogen-fixing bacteria (red cells)
Most plants that fix nitrogen are legumes (family Fabaceae), but a small number of other plants also have associations with nitrogen-fixing bacteria. This association occurs in >12 families; apparently it has evolved multiple times.
Nitrogen undergoes various transformations as it passes through its cycle, known as the nitrogen cycle. It is primarily converted between different chemical forms, such as nitrogen gas (N2), ammonia (NH3), nitrate (NO3-), and nitrite (NO2-). These transformations occur through processes like nitrogen fixation, nitrification, assimilation, ammonification, and denitrification. Nitrogen is taken up by plants and incorporated into organic compounds, which are then consumed by animals. Decomposers break down organic matter, releasing nitrogen back into the soil or water. Ultimately, nitrogen returns to the atmosphere as N2 through denitrification.
Humans have changed nitrogen fixing by developing industrial processes to produce synthetic fertilizers, which provide an alternative to natural nitrogen fixation by plants and bacteria. This has significantly increased agricultural productivity but also led to environmental issues such as water pollution and greenhouse gas emissions. Additionally, humans have genetically modified certain crops to enhance their ability to fix nitrogen, reducing the need for synthetic fertilizers.
Nitrogen fixation by human processes now exceeds nonhuman sources
General path of succession- r → K selected species, soil building
The general path of succession in ecology involves a series of stages, starting with pioneer species and progressing towards climax communities.
The r-selected species are typically the early colonizers, characterized by rapid growth, high reproductive rates, and short lifespans. They are adapted to unstable environments. As succession progresses, the K-selected species dominate. These species are characterized by slower growth, lower reproductive rates, and longer lifespans. They are adapted to stable environments. The specific sequence of species and stages may vary depending on the ecosystem.
Primary succession refers to the process of ecological succession that occurs in an area devoid of any soil or vegetation. It typically begins in barren landscapes, such as newly formed volcanic islands or glacial retreat areas.
Pioneer species are the first organisms to colonize and establish themselves in an area undergoing primary succession. These species are typically hardy and can tolerate harsh environmental conditions, such as lichens and mosses.
Secondary succession is the process of ecological succession that occurs in an area that has been previously inhabited by living organisms but has undergone a disturbance, such as a fire or clear-cutting. In secondary succession, the soil is already present, allowing for a more rapid recolonization by plant and animal species.
Climax communities are stable and self-sustaining ecosystems in ecology. They have reached equilibrium and are characterized by diverse plant and animal species adapted to the environment. They are the final stage of ecological succession, with a stable composition and structure. Climax communities are found in undisturbed areas and are the most mature and biodiverse ecosystems in a region.
Succession is a process in ecology where a series of plant and animal communities replace each other over time. It plays a crucial role in building soil. In early stages of succession, pioneer species like lichens and mosses colonize bare rock or soil. These organisms break down the rock and organic matter, releasing nutrients and creating a thin layer of soil. As succession progresses, larger plants with deeper root systems, such as grasses and shrubs, establish themselves. Their roots penetrate the soil, further breaking it down and adding organic matter through leaf litter and root decay. This continuous cycle of plant growth, decay, and nutrient release gradually enriches the soil, making it more fertile and capable of supporting diverse plant and animal life.
Mechanisms of succession- facilitation, tolerance, and inhibition
The mechanisms of succession are facilitation, tolerance, and inhibition.
Facilitation: In this mechanism, early colonizers modify the environment, making it more suitable for subsequent species. They create conditions such as improved soil fertility or increased shade, which benefit later species.
Tolerance: Tolerance occurs when different species can coexist in the same area without directly affecting each other. Each species has its own niche and can tolerate the environmental conditions present.
Inhibition: Inhibition happens when early colonizers hinder the establishment or growth of other species. They may compete for resources or release chemicals that inhibit the growth of other species, limiting their colonization.
These mechanisms interact and influence the progression of succession in an ecosystem.
Causes of increased species richness in the tropics
Four general and large-scale patterns help determine the number of species at a particular place
Area - number of species increases with area
Isolation - number of species decreases with isolation
Latitude - number of species decreases with latitude
History - historical processes contribute to current pattern
Area - there is considerably more land area in the tropics than in other ecological zones
for most taxa, species richness declines with latitude
Isolation also reduces the number of species on mainland areas of distinct habitat
Climate - Predictable and mild temperatures mean that populations are less likely to
be limited by physical factors in the tropics. In turn, this allows more biotic
interactions to evolve (mutualisms, parasites, etc.), resulting in more species
in the tropics.
Speciation - Areas the size of continents also show species/area relationships due to greater
speciation and less extinction on larger areas. Speciation increases with area.
Historical exceptions to normal pattern of species richness and latitude
Important historical processes that influence patterns of species richness -
Continental drift
Climate change -
sea level change
glaciation
Mountain uplift
River meanders
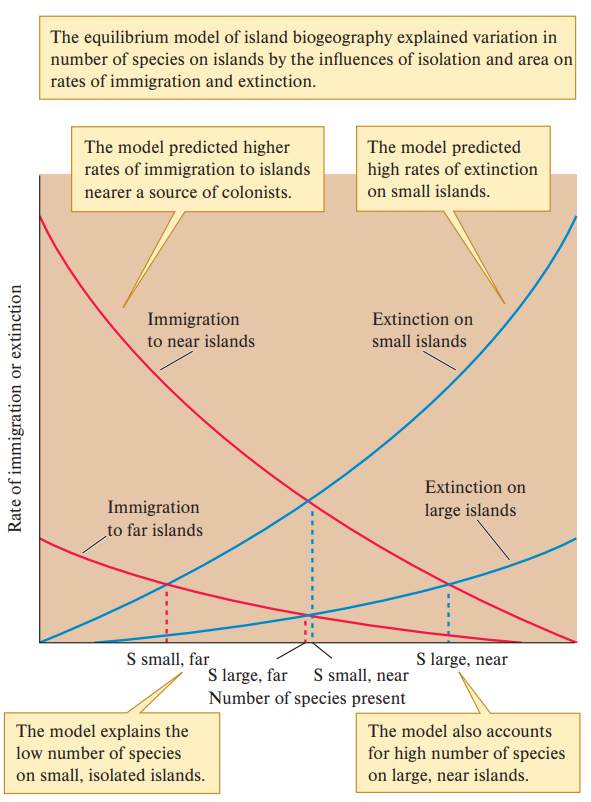
MacArthur-Wilson model for species richness on islands (equilibrium island biogeography)
How can we combine the effects of area and isolation on species richness?
Isolation from a source of colonists determines the number of species that colonize
Area determines how many individuals and species can persist
The theory of island biogeography, proposed by Robert MacArthur and Edward O. Wilson, explains how species richness and diversity are influenced by factors such as island size and distance from the mainland. It suggests that larger islands have higher species richness, while islands closer to the mainland have higher immigration rates. Conversely, smaller islands have higher extinction rates.
Island size and distance change the shape of the immigration and extinction curves, influencing the equilibrium number of species.
Large islands close to the mainland will have more species than small islands far from the mainland
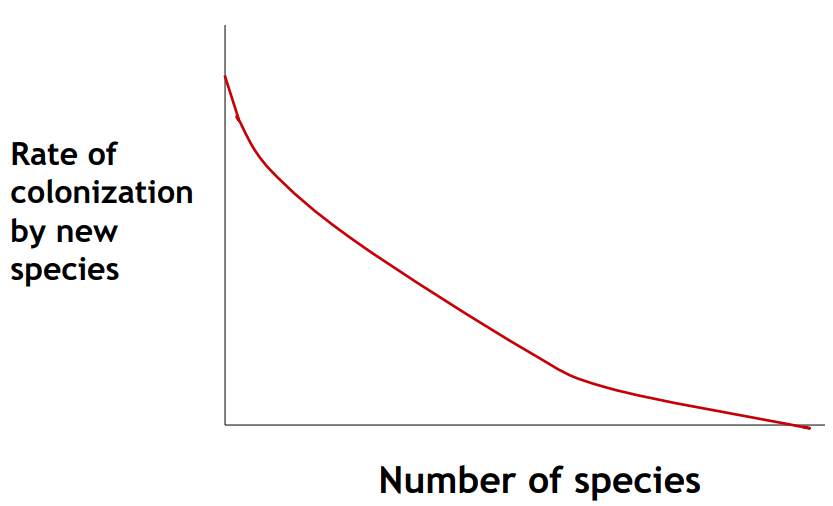
Species turnover on islands
The rate of colonization slows down as more species are added.
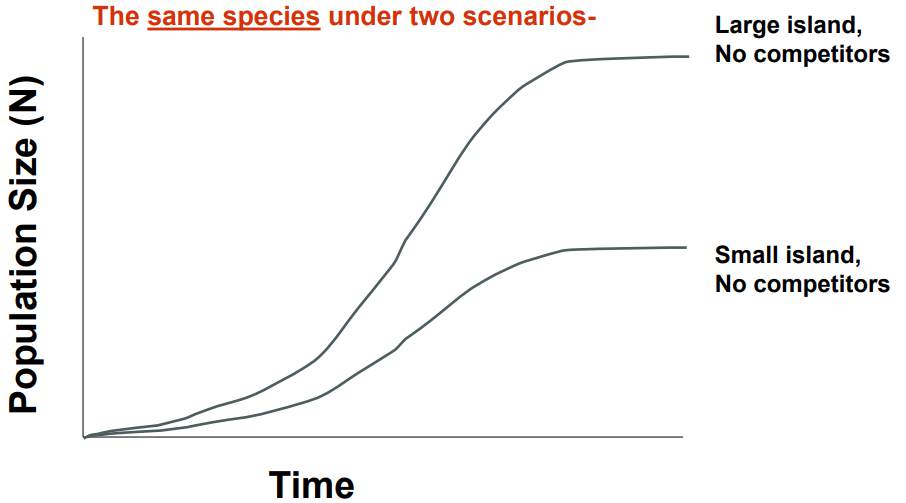
What happens after colonization?
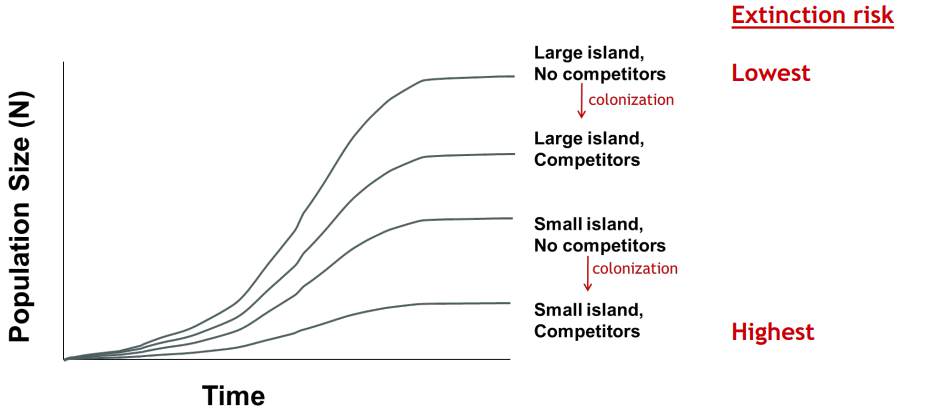
Area affects
Less available area reduces K for any population, making it more likely to go extinct.
Interspecific competition
Interspecific competition also reduces K for any population, making it more likely to go extinct
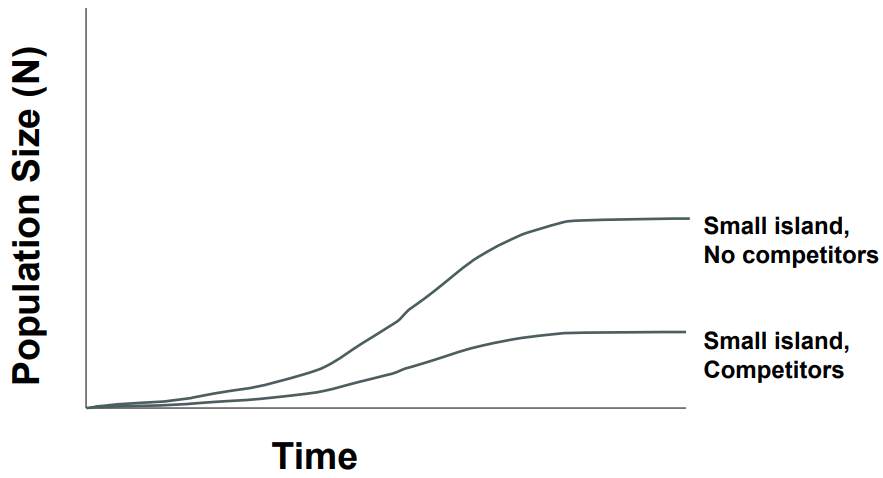
Colonization by other species adds competitors and increases the risk of extinction, and this effect gets stronger as island size decreases.
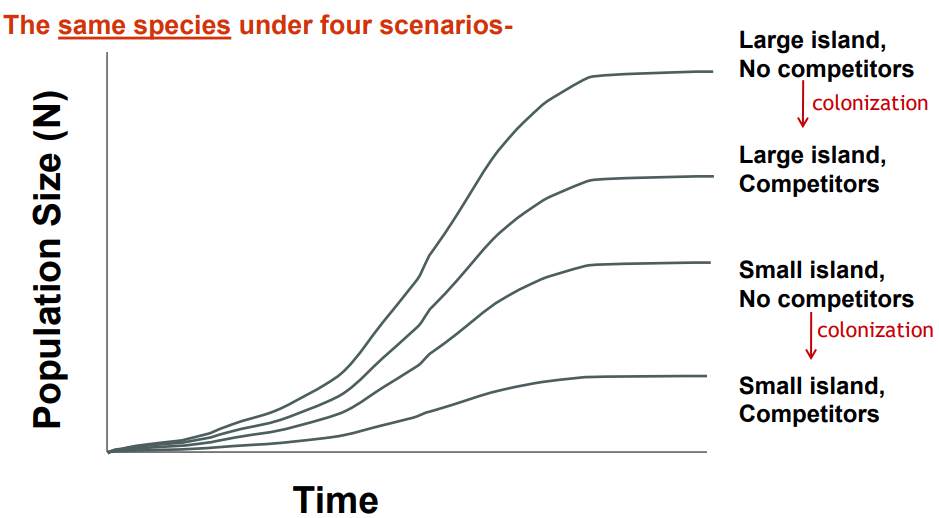
N depends on island size and presence of competitors Extinction risk increases as N decrease
The equilibrium number of species is predicted by the intersection of the immigration rate and the extinction rate. This does not predict the actual species resent, just the number of species.
Extinction through history - current vs. historical rates
Three points about extinctions
Extinction is inevitable for any population and for any species
Direct human activities have increased extinction rates for >50000 years
Indirect human activities are now further increasing the rate of extinctions
Although the number of species has grown over time, >99.9% of all species are now extinct. This ‘background extinction rate’ is about 0.06% of species/1000 years, but varies among taxa.
Extinctions followed human colonization across the Pacific over >4000 years.
Evidence for direct human extinctions
Timing of extinctions variable, but coincident with arrival of humans (and likely exacerbated by climatic events):
Australia - most megafauna extinct by 30 kybp (kiloyears before present)
North America - 30 genera of large mammals extinct 12-10 kybp (By the Clovis people)
Madagascar - giant lemurs, elephantbirds, and tortoise extinct by 1000 ybp
New Zealand - 11 species of moas extinct from 1100-1769
Pacific islands- many birds, some tortoises extinct as Polynesians moved across from west to east
Evidence for extinction form direct human activities:
Smaller species less vulnerable
Bones found in middens
Direct documentation
Ex. Passenger Pigeon extinct in North America by 1914. This might have been the most common bird in North America in 1800. North Americans hunted them rapidly. Between 1870 and 1890 the 3-5 billon of them were completely wiped out. The last remaining passenger pigeon died in the Cincinnati zoo in 1914; her name was Martha.
Dodo (Mauritius) – Direct exploitation by 1681
Xerces Blue (near San Francisco)- Habitat loss by 1940s
Lake Titicaca Orestias (Bolivia)– Intentional introductions in 1930s
Nile perch - introduced into Lake Victoria, leading to extinctions of about 50 endemic fish species
Modern switch from direct to indirect human-caused extinctions
Hunting (direct exploitation) 18%
Introduced species 28%
Habitat loss 26%
Unknown/Other 38%
Problems of introduced species- disease, predation, competition
The problem of introduced species, also known as invasive species, refers to non-native organisms that are introduced into a new environment. This can lead to various negative impacts, including:
Diseases: Introduced species can bring new diseases or parasites that the native species are not adapted to. This can result in the decline or extinction of native species.
Predation: Invasive species often lack natural predators in their new environment, allowing them to prey on native species. This can disrupt the balance of the ecosystem and lead to population declines.
Competition: Invasive species can outcompete native species for resources such as food, water, and habitat. This can lead to the displacement or extinction of native species that are unable to compete effectively.
Overall, the introduction of invasive species can have detrimental effects on native ecosystems, biodiversity, and the overall functioning of the ecosystem.
Phenological and distribution changes due to global climate change
The phenological changes due to global climate change refer to shifts in the timing of biological events, such as flowering, migration, and hibernation, as a result of changing climate patterns. These changes can disrupt ecological relationships and impact species' survival and reproduction.
Distribution changes due to global climate change involve shifts in the geographic range of species. As temperatures and other environmental conditions change, species may move to new areas that are more suitable for their survival. This can lead to range expansions or contractions, affecting species interactions and ecosystem dynamics.
Characteristics of species and ecosystems most vulnerable to global climate change
Species and ecosystems that are most vulnerable to global climate change exhibit certain characteristics:
Narrow ecological niche: Species with specialized habitat requirements or limited tolerance to environmental changes are more vulnerable. For example, high-altitude species or those dependent on specific temperature ranges.
Low genetic diversity: Populations with low genetic diversity have limited adaptive capacity to cope with changing conditions. This makes them more susceptible to the impacts of climate change.
Small population size: Species with small populations are at greater risk due to reduced genetic variation and increased susceptibility to environmental disturbances.
Migration barriers: Species confined to isolated habitats or with limited dispersal abilities mafy struggle to move to more suitable areas as their current habitats become unsuitable.
Dependence on specific resources: Ecosystems reliant on specific resources, such as coral reefs dependent on specific water temperatures or species dependent on specific food sources, are highly vulnerable to climate change impacts.
Sensitivity to temperature changes: Species or ecosystems sensitive to temperature changes, such as cold-water fish or polar ecosystems, are particularly vulnerable as global temperatures rise.
It is important to note that these characteristics can vary depending on the specific species or ecosystem in question.
Definitions
Net primary production (NPP) - net primary production is gross primary production minus respiration by primary producers; it is the amount of energy in the form of biomass produced per unit area or volume—for example, per m2 or per m3 —over some interval of time that is available to the consumers in an ecosystem.
Gross primary production (GPP) - the total biomass produced by the primary producers in an ecosystem per unit area or volume—for example, per m2 or per m3 over some interval of time.
Standing crop - the total biomass of the living organisms present in a given environment
Nitrogen or carbon fixation
Denitrification - microbially facilitated process where nitrate (NO3 ) is reduced and ultimately produces molecular nitrogen (N2) through a series of intermediate gaseous nitrogen oxide products
Primary succession - refers to the process of ecological succession that occurs in an area devoid of any soil or vegetation. It typically begins in barren landscapes, such as newly formed volcanic islands or glacial retreat areas.
Secondary succession - the process of ecological succession that occurs in an area that has been previously inhabited by living organisms but has undergone a disturbance, such as a fire or clear-cutting. In secondary succession, the soil is already present, allowing for a more rapid recolonization by plant and animal species.
Dynamic equilibrium in species richness is a stable state in an ecosystem where the number of species remains constant over time. It happens when species colonization and immigration balance species extinction and emigration. Factors like environmental conditions, competition, predation, and human activities can affect this equilibrium.
Nutrient cycles - involve the storage of chemical elements in nutrient pools, or compartments, and the flux, or transfer, of nutrients between pools.
Nutrient pools - the amount of a particular nutrient stored in a portion, or compartment, of an ecosystem.
Nutrient flux - the movement of nutrients between nutrient pools in an ecosystem
Nutrient sink - a part of the biosphere where a particular nutrient is absorbed faster than it is released.
Nutrient source - a portion of the biosphere where a particular nutrient is released faster than it is absorbed.
Sedimentation -is the deposition of sediments. It takes place when particles in suspension settle out of the fluid in which they are entrained and come to rest against a barrier.
Facilitation model - according to the facilitation model, pioneer species modify the environment in such a way that it becomes less suitable for themselves and more suitable for species characteristic of later successional stages.
Tolerance - Climax species are present all along but take time to become dominant. Their dominance is not due to changes caused by pioneer species.
Inhibition - Early successional species modify the environment to make it unsuitable for other species
Primary succession occurs when new land is formed or bare rock is exposed, providing a habitat that can be colonized for the first time
Graphical or mathematical representations (always know the axes, including the scales)
Understand and be able to dissect and reapply the graphs in all PowerPoints
Species - area relationship (log-log scale)- islands, mainland patches, lakes
Isolation effects on island colonization
Area effects on extinction on islands
Predicting the number of species on an island- the MacArthur-Wilson equilibrium model
Predicting loss of species based on area loss
Field tests of the MacArthur and Wilson equilibrium model
Species turnover on island
Places mentioned in ppts
Baltic Sea
Galapagos Islands
Lake Victoria
Atlantic Rainforest in Bahia, Brazil
New Hampshire
Glacier Bay
Alaska
Fláajökull glacier, Iceland