Module 4: Power and Effect Sizes
Statistical Power
Confidence Interval (CI) is the range of values you expect the true mean to fall in.
If I take 100 samples and measure their 95% CI’s, I expect that in 95 of those samples, the true population mean is going to fall in those intervals.
The wider the confidence interval is, the more certain (accurate) it is, the narrower the confidence interval is, the more precise it is.
When comparing CI’s of different samples, if they overlap, there is a chance that these two populations have the same mean, but the further away from each other the intervals fall, the more likely it is that the difference is actually meaningful.
Statistical Power: What is the probability that a study will detect an effect when there is an effect to be detected? In other words: What is the probability of a correct decision of rejecting the null hypothesis when it is false.
Power = 1 - β (Probability of Type II Error - false negative)
Therefore, the larger alpha is gonna result in a larger power value because it is going to result in a smaller beta
Alpha is the probability that we will reject the null hypothesis when we should not have, which means we say that there is an effect when there is not one (Type I Error) - false positive
Alpha relates to specificity - the ability to correctly say there is no effect when there really is none
Beta is the probability that we will accept the null hypothesis when we should not have, which means we say there is no effect, when there is one (Type II Error) - false negative
Beta relates to sensitivity - the ability to correctly say that there is effect when there is one.
So why do we not use the teeny tiny alpha then?
Because there is a negative relationship between alpha and beta. If we choose a tiny alpha, we will make the probability of Type I Error very small, but at the expense of increasing the probability of Type II Error (beta).
Factors affecting statistical power:
Alpha level
Larger alpha results in smaller beta causing a larger power value
Error variance
Lower error variance means smaller beta, thus larger power value
Sample size
The bigger the sample, the less error variance, the more precise and narrow the distributions become, causing smaller beta and larger power value
Effect size: magnitude of difference between samples
With larger effect sizes, the means are further apart, and the null is further from the sample, therefore the beta value is smaller, and the power value is bigger
Effect Size
Effect size is the relative distance between our null and true distributions and is measured in standard deviation units.
The effect size of zero means no difference between groups, and increases as the difference between the groups increases
Effect sizes help tell us if the difference is practically meaningful
Effect Size Measurements
For main effect ANOVA: Eta squared; Omega squared
For Multiple Comparisons: r; Cohen’s d
Worked Example
A researcher recruits 60 students to take part in an experiment exploring the effects of drug use on Ikea build quality
IV: Marijuana, LSD, No Drug taken
DV: Build quality rated by an Ikea expert out of 20
For Main Effect
Eta (η) Squared (used for main effect: small - .01; medium - .09; large - .25)
η squared is SSbetween/ SStotal
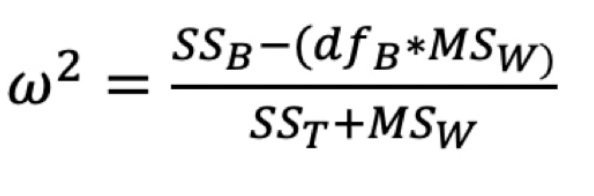
Omega (ω) Squared (most accurate measure of main effect size: small: .01; medium: .06; large: .14)
For Planned Contrasts
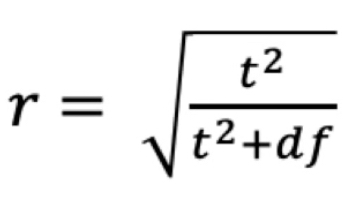
r: used for follow-up tests, particularly useful for planned contrasts: small (.10), medium (.30), large (.50)
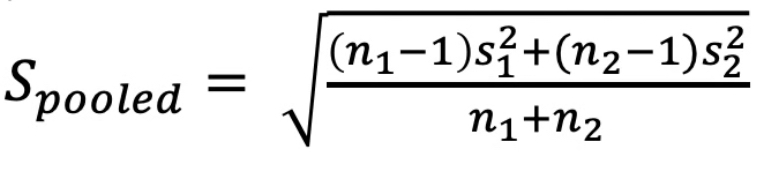
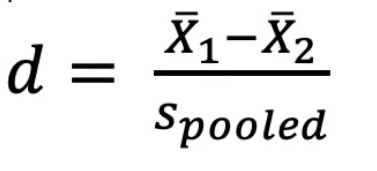
Cohen’s d: used for follow-up tests, can be used for Tukey’s post-hoc: small (.20), medium (.50), large (.80)
Using Power and Effect Size to Calculate Sample Size
By making predictions of what our null, and alternative hypothesis distributions will look like, and using that to estimate effect size, we can estimate how many people we will need to describe those distributions sufficiently, to meet a certain power specification