L23: Fluorescence Correlation Spectroscopy
Solvent relaxation and effect on lifetime
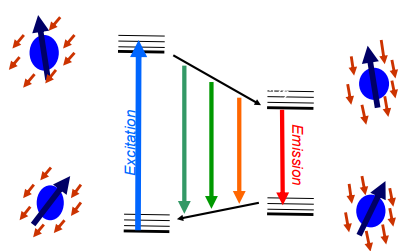
Polar solvents tend to reduce fluorescence lifetime. Polar solvents stabilize the excited state relative to the ground state
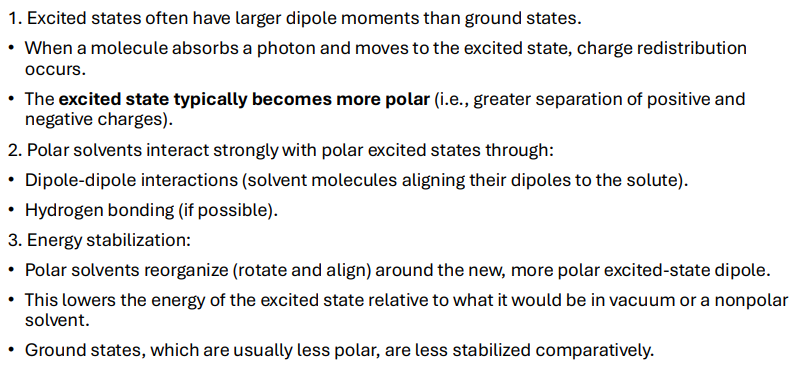
The smaller the energy gap between the excited and ground state (due to stabilization of excited state), the easier it becomes for non-radiative processes (like internal conversion) to occur.
Faster non-radiative decay → shorter fluorescence lifetime.
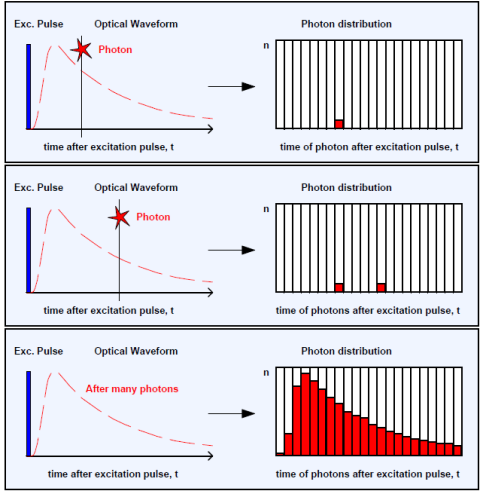
TCSPC
How are the excitation pulse and photon counts related?
Fluorescence Correlation Spectroscopy
single molecule detection method
Does not require surface immobilization and can be done in solution
Relies on diffusion of fluorescence species
Allows for continuous observations for longer periods of time
Analysis is based on time dependent fluctuations
Fluctuation
If we can resolve fluctuations from single reactions, we do not need to look at ensemble kinetics
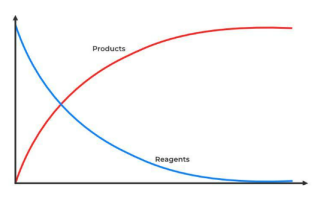
mminute fluctuations in product formation - steps
Correlation
Two signals a and b are correlated if
<a b> ≠ <a><b>
<> = average value
Case I = a and b can take values of either 0 or 1 randomly
0.25 = 0.25
Case II = a and b can take values of either 0 or 1, but same values
0.5 =/= 0.25
Case III = a and b can take values of either 0 or 1, but opposite values
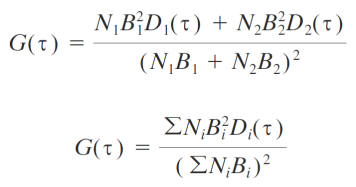
g = <a b> /<a><b> Autocorrelation function
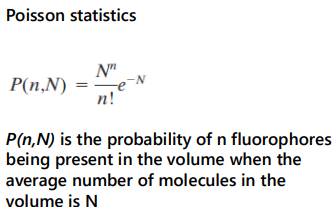
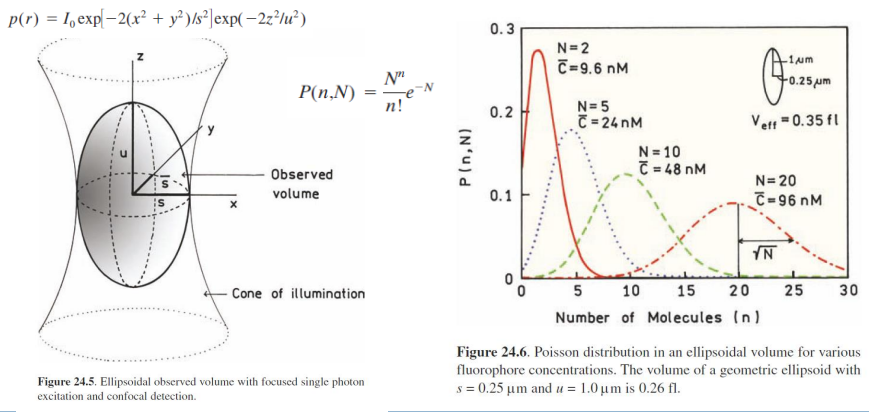
Theory
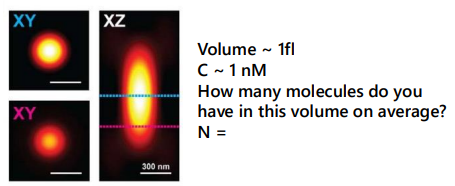
for N = 0.6,
P(0, 0.6) ~ 55%
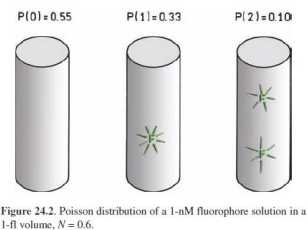
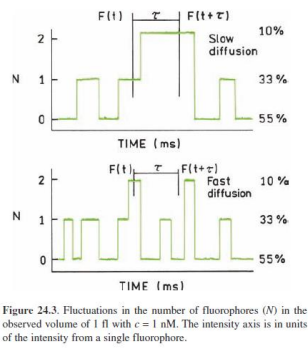
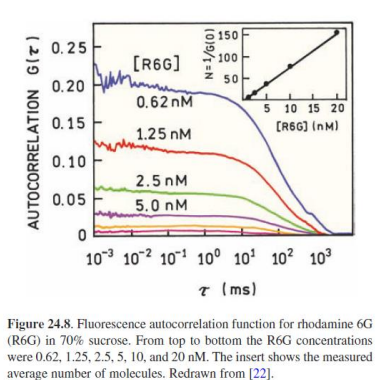
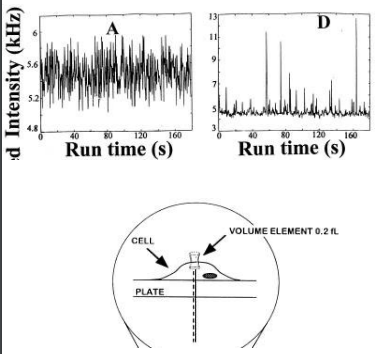
The fluorescence intensity from this volume will FLUCTUATE as molecules diffuse in or out of it.
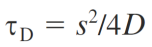
Fluctuations give information on residence time
Experimental setup
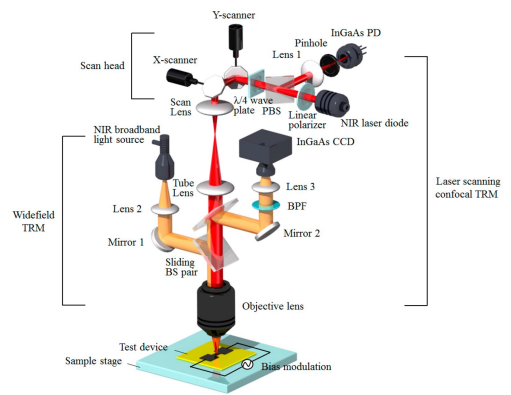
Parameters
anything that affects fluorescence
Data
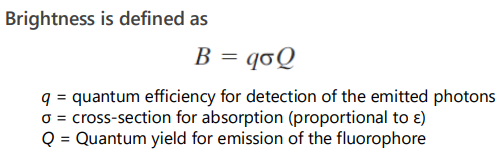
F(t) depends on the concentration and spatial distribution of the excitation and detection efficiency, + Fluorophore brightness
F(t) = B S CEF(r)I(r)C(r)
Fluorescence as a function of position
CEF(r) = Collection Efficiency Function of the instrument as a function of position (r) over the entire observed space.
I(r) = Excitation intensity at each position r
Intuitive meaning:
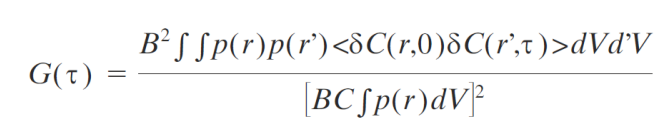
Numerator: Intensity fluctuations from the concentration fluctuations at each point in the sample, which is integrated over the observed volume. When the fluorophore moves from r to a new location r', its brightness is proportional to the detection profile at this position p(r').
Denominator: Average intensity, which is given by the product of the brightness B, mean concentration , and the detection profile of the instrument integrated over the observed volume.
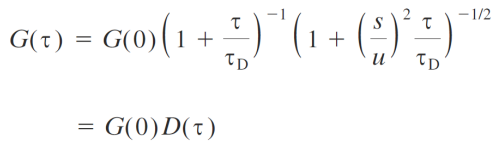
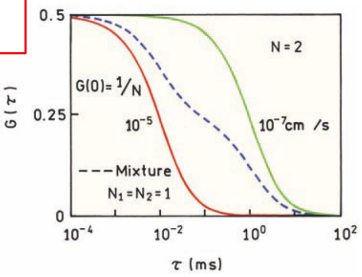
G(0) = intensity/amplitude/number of molecules
Experimental conditions
Viscosity
bigger beam/laser
Applications
surface areas of patients - drug administration
number of receptors
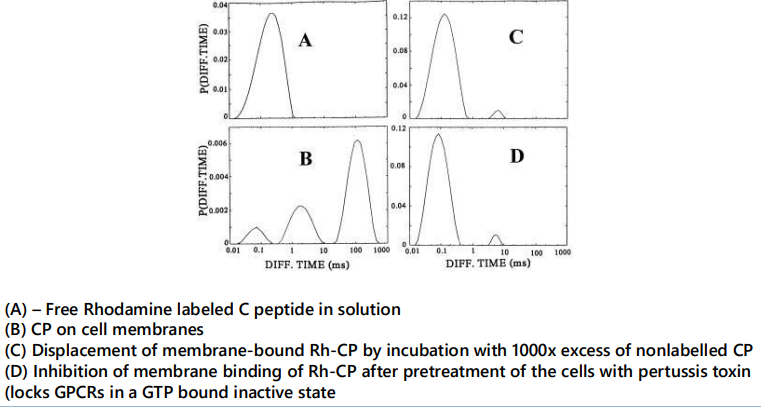
C-peptide mechanism
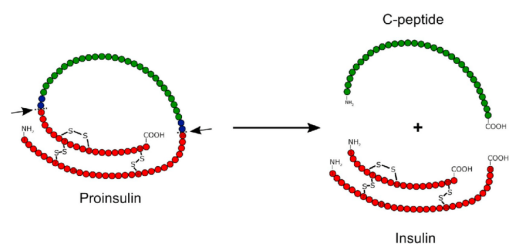
Goal: to measure C-peptide binding dynamics on cell membranes
Hypothesis 1: Peptide binds to membrane directly
Hypothesis 2: Peptide binds to a receptor
solution vs membrane = clustering behaviour!
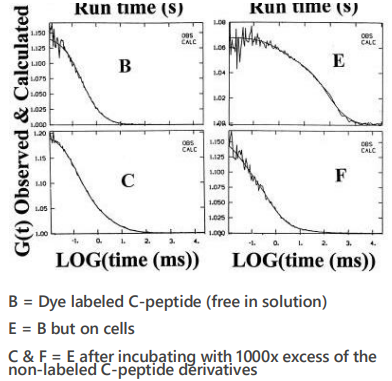
suggested to bind to a GPCR - reversible binding
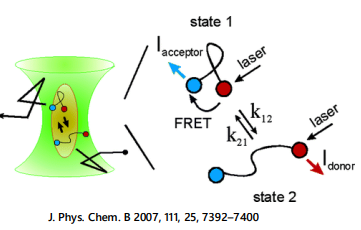
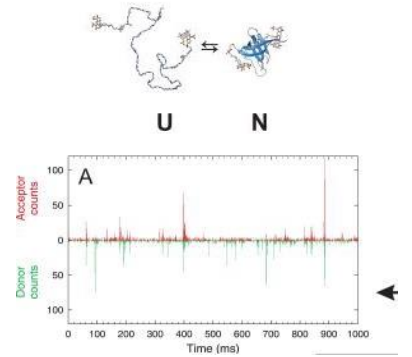
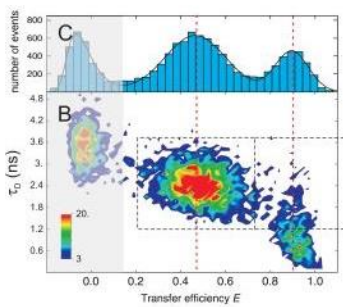
protein unfolding dynamics with FRET and Lifetime remix
Summary
powerful method to analyze stoichiometry and diffusion
It does not require immobilization on a surface
TIR - immobilisation
no constraints on topology
Prior knowledge (or guess) of diffusion models is required
Characterization of dye brightness is required in various states
no prone to going dark / blinking