Tutorial 7: Chi-squared
Exploring data
- nrow() - number of participants
- ncol()- number of columns
- names() - get variable names
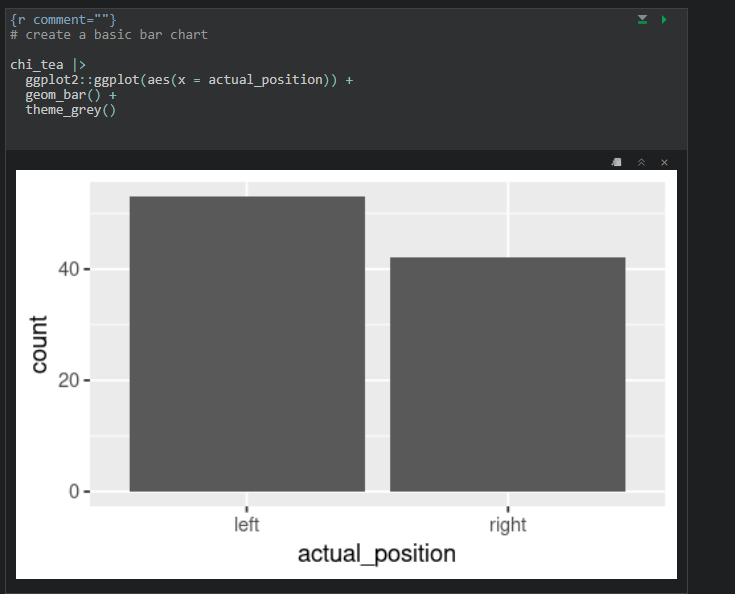
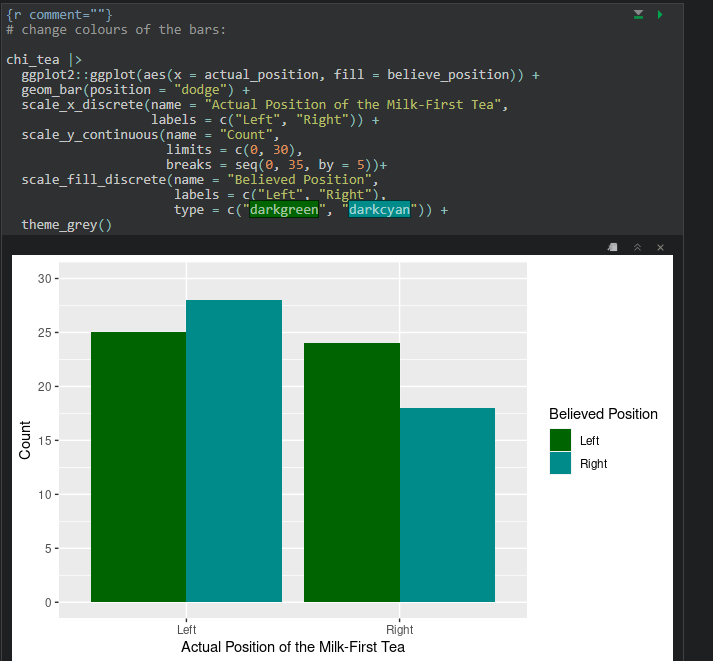
Visualising counts with bar charts
geom_bar() - creates a bar chart
Chi-Square analysis
- chisq.test() - performs an χ2 test of association

Observed and expected frequencies
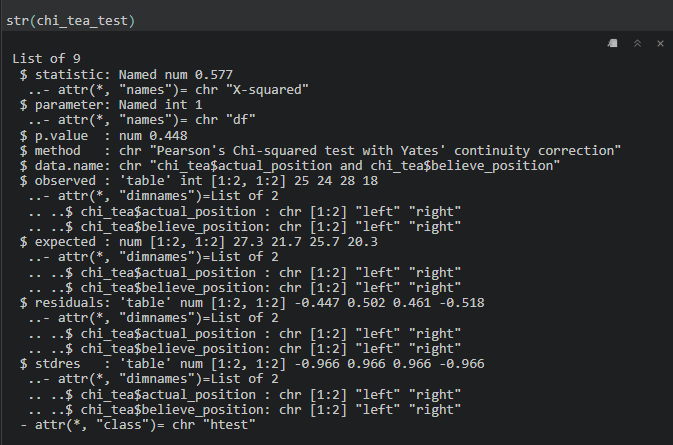
- str() - used to look at the structure of object (with the results of a test stored in it???)
- expected frequencies should be above 5 (not sure why?)