Chapter 11 - Money, Banking, and Monetary Policy
11.1 Money and Financial Assets
Financial Assets
- The firm invests in a physical asset if the expected rate of return is at least as high as the real interest rate.
- Financial investments yield a rate of return.
Stocks
- Stock - A certificate that represents a claim to, or share of the ownership of a firm.
- Equity financing - The firm’s method of raising funds for investment by issuing shares of stock to the public.
Bonds
- Bond - A certificate of indebtedness from the issuer to the bondholder.
- When a firm wants to raise money by taking a loan (borrowing money), it can issue corporate bonds that promise the bondholders the principle amount plus interest with repayment on a specific date. This is a form of debt financing.
- Bonds can be bought and sold in a secondary market.
- Debt financing - A firm’s way of raising investment funds by issuing bonds to the public.
Functions of Money
- Fiat money - The paper and coin money used today. Since it has no intrinsic value, it is backed by the public’s trust that the government maintains its value.
- Before, some of the currencies used were gold which had intrinsic value, and tobacco which had a commodity value.
- Functions of money - Money serves three functions. It serves as a medium of exchange, a unit of account, and a store of value.
- Medium of exchange - It follows the logic that your labor hours turn into money, the money turns into apples, the farmer then exchanges the money for an orchard’s apple crop, and so on.
- Unit of account - Units of currency measure the relative worth of goods and services. In a barter economy, the value of a pound of cheese would equal a dozen eggs. With money, the value of goods is measured in a monetary unit.
- Store of value - Money is a relatively good way to store value, when there’s no inflation, because it keeps its value. A cheese maker would have to sell the cheese before it gets moldy to earn profit.
Supply of Money
- Money supply - The quantity of money in circulation as measured by the Federal Reserve (the Fed) as M1 and M2. It is assumed to be fixed at a given point in time.
- Liquidity - A measure of how easily an asset can be converted to cash. The more easily it can be converted to cash, the more liquid the asset is.
- M1 - The most liquid of money definitions and the basis for all other more broadly defined measures of money. M1 = Cash + Coins + Checking deposits + Traveler’s checks.
- M2 - It is less liquid than M1. M2 = M1 + Savings deposits + Small time deposits + Money market deposits + Money market mutual funds.
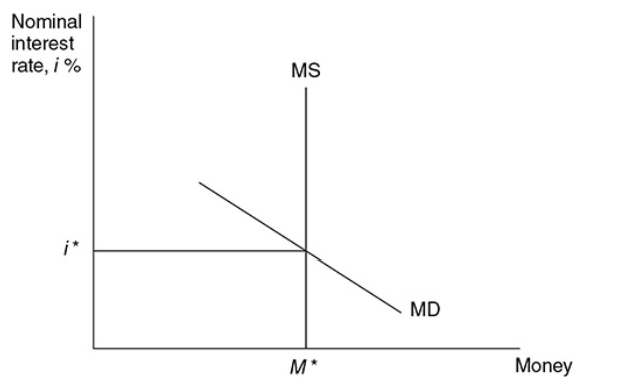
- At any point in time, the supply of money is constant, meaning that the current money supply curve is vertical.
Demand for Money
Transaction demand - The amount of money held in order to make transactions. This is not related to the interest rate, but it increases as nominal GDP increases.
^^Ex. →^^ If nominal GDP is $1,000 and each dollar is spent an average of four times each year, money demand for transactions would be $1,000/4 = $250. If nominal GDP increases to $1,200, money demand for transactions increases to $1,200/4 = $300.
Asset demand - The amount of money demanded as an asset. As nominal interest rates rise, the opportunity cost of holding money begins to rise and you are more likely to lessen your asset demand for money.
Total demand - Plotted against the nominal interest rate, the transaction demand for money is a constant MDt. Adding this constant needed to make transactions to a downward-sloping asset demand for money (MDa) creates the total money demand curve.
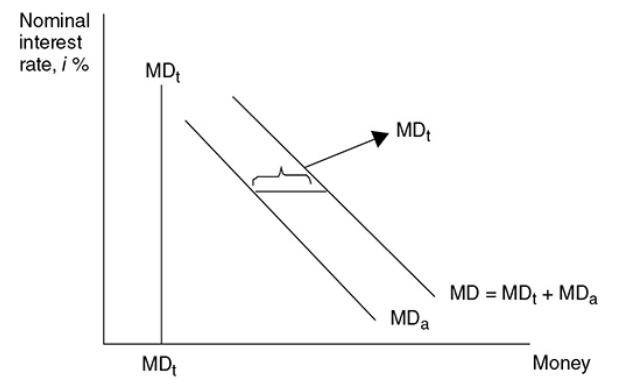
- Money demand - The demand for money is the sum of money demanded for transactions and money demanded as an asset. It is inversely related to the nominal interest rate.
The Money Market
Theory of liquidity preference - Keyne’s theory that says that the equilibrium price of money is the interest rate where money supply intersects money demand. It says that the interest rate adjusts to bring the money market into equilibrium.
If the price is below equilibrium, a shortage occurred and the price must rise.
If the price is above equilibrium, a surplus happened and the price must fall.
Money Market vs. Market for Loanable Funds
- Breadth of scope - The supply of loanable funds comes from saving whilst the supply of money includes savings, currency and checkings deposits. The demand of loanable funds comes from investment demand, but the demand for money includes the money used for investment, consumption (transaction demand), and for holding an asset (asset demand). Overall, the money market is bigger and more inclusive than the market of loanable funds.
- Different philosophies - Both markets represent fundamental differences in macroeconomic philosophies.
- Classical economists believe that for any level of GDP, the interest rate adjusts to balance the supply and demand for loanable funds, and the price level adjusts to keep the money market in equilibrium. Basically, they say the price level is flexible.
- Keynesian economists believe that for any price level, the interest rate adjusts to balance the supply and demand for money, and this interest rate influences aggregate demand and the short-run level of GDP. So, the price level is sticky.
- Graphing - It appears that the same interest rate is graphed on the vertical axis of both markets, but they're not the same. The vertical axis of the money market should be labeled with a nominal interest rate and the vertical axis of the loanable funds with the real interest rate.
Changes in Money Supply
An Increase in the Money Supply
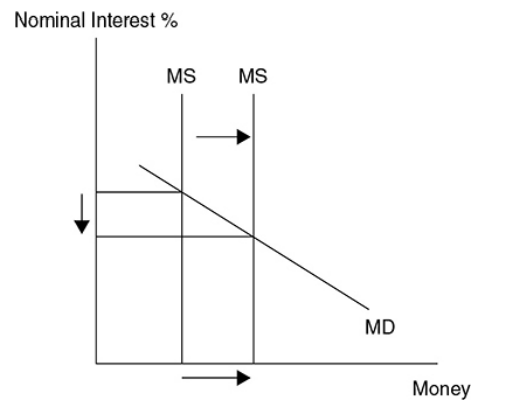
When supply increases, there’s a temporary surplus at the original equilibrium price. When there’s surplus money, people find other assets, such as bonds, to invest their money in. With more people looking for bonds, its demand raises as well as its price and the effective interest rate paid on bonds is lowered.
In this graph, the original interest rate is 10% and the supply of money is $1,000, then, the Fed increases the money supply to $1,500.
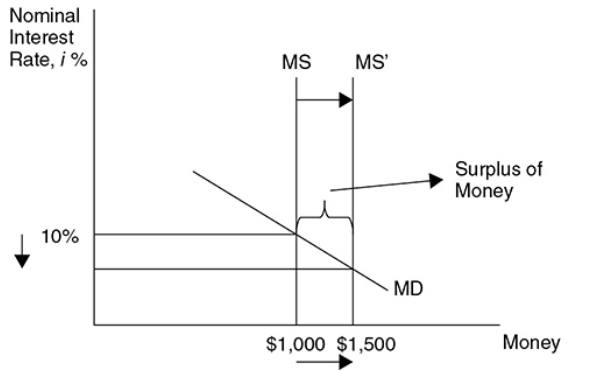
Surplus money is the money increased by the Fed in the money supply at the original interest rate.
^^Ex. →^^ A bond is selling at a price of $100 and promises to pay $10 in interest. The interest rate = $10/$100 = 10%. But if the price of the bond is driven up to $125, the same $10 of interest actually yields only $10/$125 = 8.0%. With lower interest rates available in the bond market, the opportunity cost of holding cash falls and the quantity of money demanded increases along the downward-sloping MD curve until MD = $1,500. An increase in the money supply decreases the interest rate.
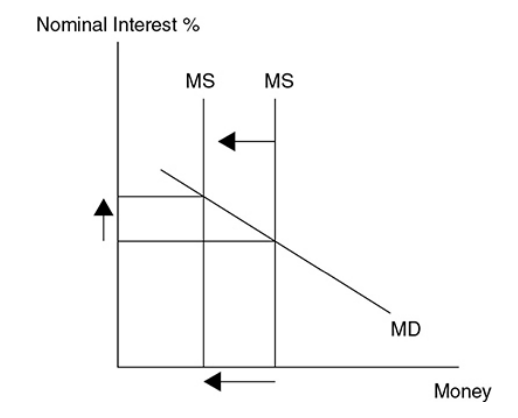
A Decrease in the Money Supply
A shortage of money sends some bondholders to sell their bonds so that they have money for transactions. An increase in the supply of bonds in the bond market decreases the price and increases the rate of interest earned on those assets.
In this graph, the central bank decides to decrease the supply of money from $1,000 to $500 and there is a shortage of money at the 10% interest rate.
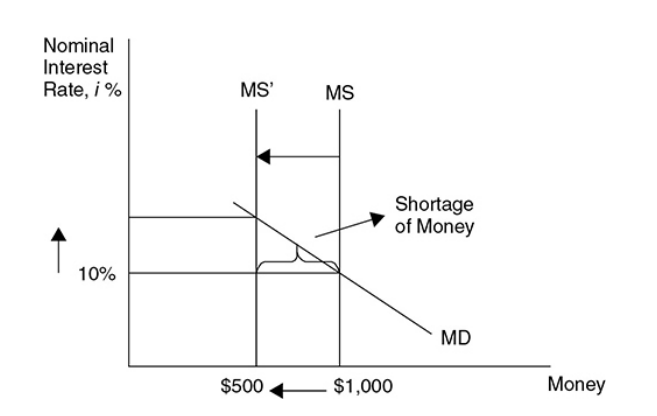
^^Ex. →^^ If the original price of the bond is $100, promising to pay $10 in interest, the interest rate is 10%. If the price falls to $90, the same $10 of interest now yields $10/$90 = 11.1%. Higher interest rates on bonds increase the opportunity cost of holding cash, and so the quantity of money demanded falls until the interest rate rises to the point where MD = $500.
To resume:
- Increasing the money supply lowers interest rates as surplus money moves into the bond market, increasing bond prices.
- Decreasing the money supply increases interest rates as a shortage of money creates a sell-off of bonds, decreasing bond prices.
11.2 Fractional Reserve Banking and Money Creation
Fractional Reserve Banking
- Fractional reserve banking - A system in which only a fraction of the total money deposited in banks is held in reserve as currency.
- Reserve ratio (rr) - The fraction of a bank’s total deposits that are kept on reserve.
Money Creation
- Reserve ratio (rr) = Cash reserves/Total deposits.
- Reserve requirement - Regulation set by the Fed that states the minimum reserve ratio for banks.
- Excess reserves - The cash reserves held by banks above and beyond the minimum reserve requirement.
- T-account or balance sheet - A tabular way to show the assets and liabilities of a bank. Total assets must equal liabilities.
- Asset of a bank - Anything owned by the bank or owed to the bank is an asset of the bank.
- Cash on reserve is an asset and so are loans made to citizens.
- Liability of a bank - Anything owned by depositors or lenders is a liability to the bank.
- Checking deposits of citizens or loans made to the bank are liabilities to the bank.
- ^^Ex. →^^ Katie takes $1,000 from under her mattress, deposits it at ECB, and opens a checking account. If the Federal Reserve tells the ECB that it must hold 10 percent of all deposits in reserve, then the ECB must comply and keep no less than $100 of Katie’s deposit as “required” reserves. The remaining $900 of the deposit are excess reserves and can be kept on reserve in the bank or lent to another person.
The Money Multiplier
- Money multiplier - This measures the maximum amount of new checking deposits that can be created by a single dollar of excess reserves. M = 1/(reserve ratio) = 1/rr. The money multiplier is smaller if:
- At any stage, the banks keep more than the required dollars in reserve
- At any stage, borrowers do not redeposit funds into the bank and keep some as cash
- Customers are not willing to borrow.
- An initial amount of excess reserves multiplies by a factor of M, at most.
11.3 Monetary Policy
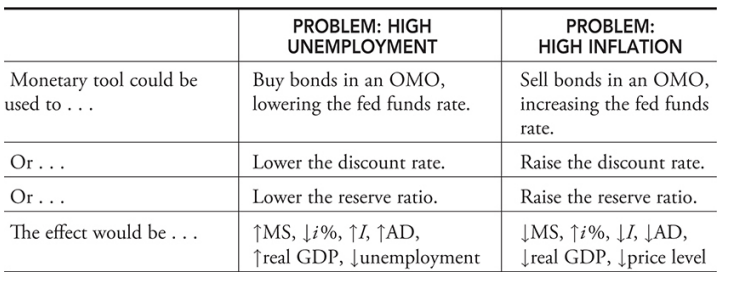
- The Federal Reserve has three general tools of monetary policy that they control:
- Engaging in open market operations
- Changing the discount rate
- Changing the required reserve ratio
Expansionary Monetary Policy
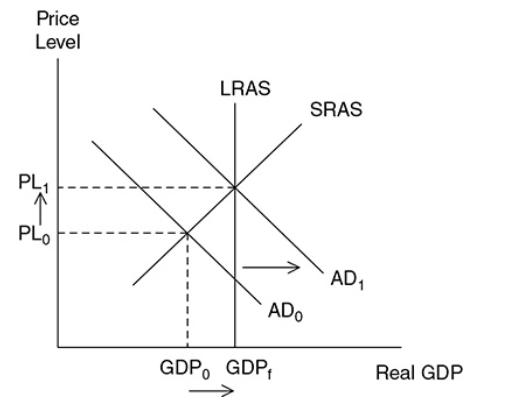
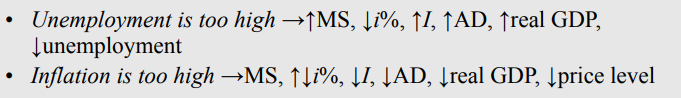
Expansionary monetary policy - Designed to fix a recession by lowering interest rates to increase aggregate demand, lower the unemployment rate, and increase real GDP, which may increase the price level.
By increasing the money supply, the interest rate gets lower. Lower interest increases private consumption and investments, which shifts the AD curve to the right.
Contractionary Monetary Policy
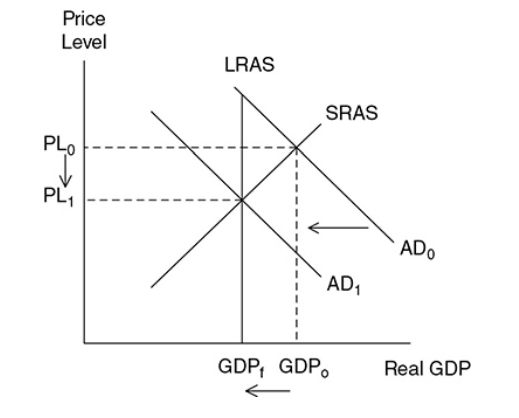
Contractionary monetary policy - Designed to avoid inflation by increasing interest rates to decrease aggregate demand, which lowers the price level and decreases real GDP back to full employment.
When the money supply is decreased, the interest rate increases causing a decrease in private consumption and investment shifting AD to the left.
Open Market Operations
- Open market operations (OMOs) - A traditional tool of monetary policy, it involves the Fed’s buying (or selling) of securities from (or to) commercial banks and the general public.
- When securities (Treasury bonds) are bought from the banks by the Fed, the banks receive excess cash and the Fed gets bonds. When banks have excess reserves, the money supply increases and the interest rate falls.
- When Fed buys, BB = BB → Buying Bonds = Bigger Bucks.
- The opposite happends when the banks buy securities from the Fed. The banks get the bonds and their excess reserves would fall causing the money supply to decrease increasing interest rates.
- When Fed sells, SB = SB → Selling Bonds = Smaller Bucks.
The Federal Funds Rate
- Federal funds rate - The interest rate paid on short-term loans made from one bank to another. When this rate is a target for an OMO, bonds are bought or sold accordingly until the interest rate target has been met.
- If the FOMC wants to lower interest rates, it buys bonds.
- If the FOMC wants to rise interest rates, it sells bonds.
Changing the Discount Rate
- Discount rate - The interest rate commercial banks pay on short-term loans from the Fed.
- Lowering the discount rate (or federal funds rate) increases excess reserves in banks and expands the money supply.
- Raising the discount rate (or federal funds rate) decreases excess reserves in commercial banks and contracts the money supply.
Changing the Required Reserve Ratio
Lowering the reserve ratio increases excess reserves in commercial banks and expands the money supply.
Increasing the reserve ratio decreases excess reserves in commercial banks and contracts the money supply.
Modern Monetary Policy
- Central banks around the world adapted monetary policy in response to the global financial crisis that caused the “Great Recession” of 2007–2009. As the crisis began, central banks flooded bank reserves to give banks more cash (liquidity).
- This increase in cash reserves drove the federal fund rates to almost zero. At this point, interest rates are zero and an increase in the money supply won’t have any effect in the interest rates.
- This strategy is called ample reserves framework or regime.
- Ample reserves regime - The current framework for the Federal Reserve’s monetary policy. The banking system is provided enough cash reserves so that changes in the money supply do not cause a change in the federal funds rate.
- They make changes to two administered interest rates: IOR and ON RRP.
- Interest on reserves (IOR) - The interest rate that is paid to banks that deposit excess reserves with the Fed. This is the primary tool of current monetary policy. The federal fund rates rise and fall along with the IOR.
- Arbitrage - “Borrow low and save high” technique.
- ^^Ex. →^^ Suppose the federal funds rate was significantly lower than the IOR. A smart banker could borrow money from another bank, paying them the low federal funds rate, and then redeposit that money with the Fed and earn the higher IOR.
- Overnight reverse repurchase agreement (ON RRP) - The interest rate paid to a financial institution on an overnight transaction in which the Federal Reserve sells a U.S. government security to the financial institution while agreeing to buy the security back the next day. This is a secondary tool of current monetary policy.
- It was created to incorporate institutions that borrow and lend to avoid arbitrage.
- ^^Ex. →^^ If the federal funds rate fell significantly below the ON RRP, a savvy financial institution could borrow from another bank, deposit with the Fed, and earn profit in the difference between the borrowing and saving rates.
Coordination of Fiscal and Monetary Policy
The central bank develops monetary policy and is independent of Congress and the president. This is a critical balance to fiscal policy that can be heavily politicized.
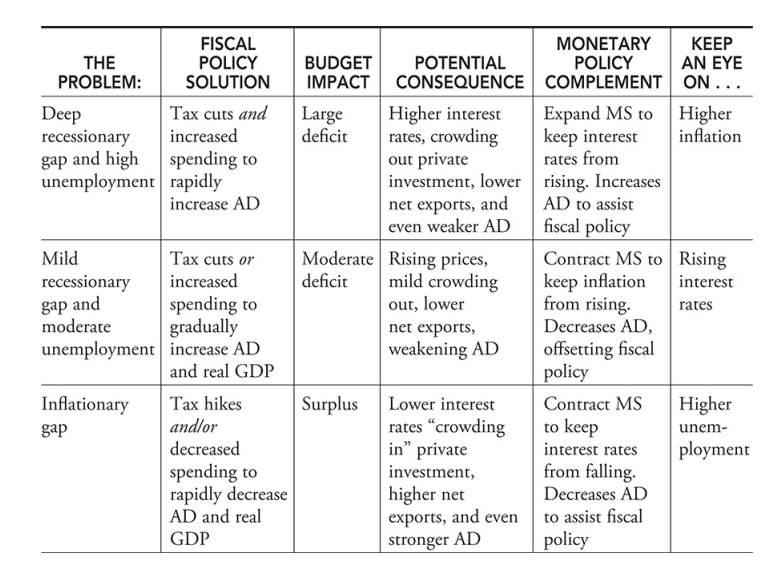
In a deep recessionary gap, expansionary monetary policy could be used to assist expansionary fiscal policy to quickly move to full employment. The risk then becomes a burst of inflation.
In a mild recessionary gap, contractionary monetary policy could be used to offset expansionary fiscal policy to gradually move to full employment. The risk then becomes rising interest rates.
In an inflationary gap, contractionary monetary policy could be used to assist contractionary fiscal policy to put downward pressure on the price level. The risk then becomes a rising unemployment rate.
Critics of Monetary Policy
The monetarists argues against active open market purchases of Treasury securities on the grounds that such expansions of the money supply will not create more economic growth in the long run and will only create inflation. They believe that the role of the central bank should be price stability, and the best way to accomplish this goal is to gradually and methodically increase the money supply by a fixed percentage each year.
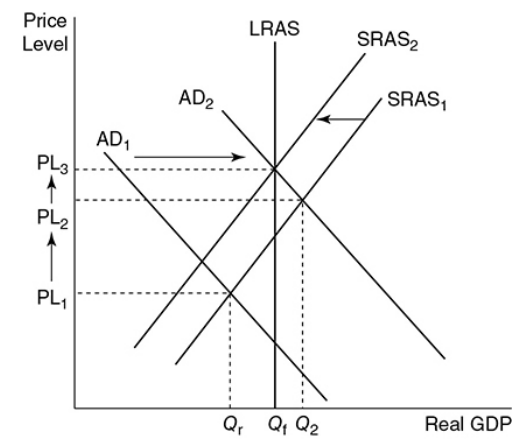
For this graph, suppose the central bank takes aggressive action and buys Treasury securities to expand the money supply. With a lower interest rate in the money market, aggregate demand increases to AD2, increasing real GDP beyond full employment. While the unemployment rate falls in the short run, the aggregate price level rises to PL2 and inflation becomes a concern. As the economy adjusts to higher levels of spending, nominal wages and other factor prices rise, shifting the SRAS curve to the left to SRAS2. When the economy fully adjusts, it is back at full employment, but the aggregate price level has now greatly risen to PL3.
Quantity Theory of Money
- The critical link between monetary policy and real GDP is the relationship between changes in money supply, the real interest rate, and the level of private investment.
- If the money supply increases and there is no increase in investment, expansionary monetary policy would have no effect on real GDP.
- Quantity theory of money - A theory that asserts that the quantity of money determines the price level and that the growth rate of money determines the rate of inflation.
- It predicts that any increase in the money supply only causes an increase in the price level.
- Equation of exchange - A way to view the quantity theory of money. The equation says that nominal GDP (P × Q) is equal to the quantity of money (M) multiplied by the number of times each dollar is spent in a year (V). MV = PQ.
- Velocity of money - The average number of times that a dollar is spent in a year. V = PQ/M.
- ^^Ex. →^^If in a given year the money supply is $100 and nominal GDP is $1,000, each dollar must be spent 10 times; V = 10.
- If the money supply (M) increases, the increase must be reflected in the other variables. To accommodate an increase, the velocity of money must fall, the price level must rise, or the economy’s output of goods and services must increase.
- Economists believe that the quantity of output produced in a given year is a function of technology and the supply of resources. Therefore, the increased money supply is going to only create inflation.
\