Theme 2: Break even
The break-even output is the point at which a business’s revenue generated through the sales of its products will cover the total costs. At break even the business is making neither a profit nor a loss. Break-even analysis can be used to help a business make important decisions about costs, prices and expected profit.
The uses of break-even analysis
+: Decide whether a business idea is profitable and viable.
+: Identify the level of output and sales necessary to generate profit ( and therefore the scale of the business)
+: Assess changes in the level of production.
+: Assess the effects of costing and pricing decisions.
Break-even point= Fixed costs/contribution per unit
Contribution
Contribution is the difference between the variable costs of one unit and the selling price.
(Variable costs are costs that vary in proportion to the volume of goods or services produced. In other words, as the volume of production increases, the variable costs also increase.)
Contribution selling price - variable cost per unit.
The total contribution is: total output X contribution per unit.
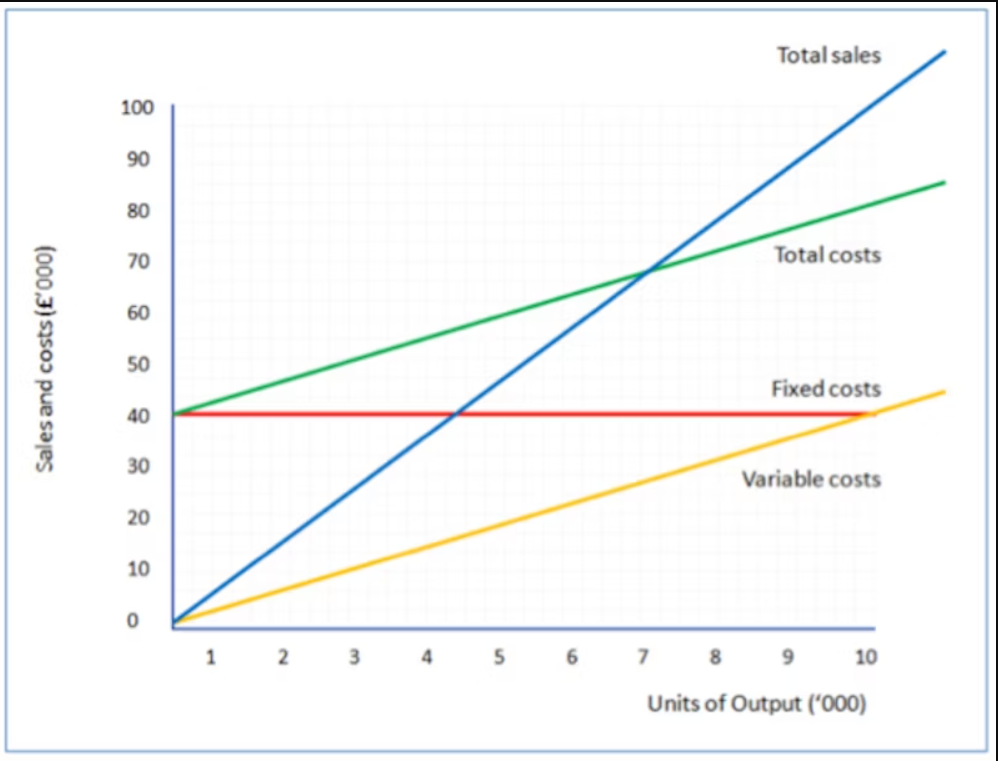
Step 1: Plot the total revenue line ( price x quantity sold)
Step 2: Plot the fixed cost line. This will be a horizontal line.
Step 3: Plot the variable costs line. Next, we add the variable costs. We assume that variable costs vary directly with output. In our example, the variable cost per unit is £4. So variable costs for 1,000 units will be £4,000, and for 5,000 units they will be £20,000. Remember that you only need to plot a couple of points to be able to draw the straight line (in yellow below).
Step 4: Plot the total cost line. The next step is to add the variable costs to the fixed costs for each level of output. This is important. Remember that to calculate break-even we need to know total costs. The total cost line is shown in green on the chart.
Step 5: Having dealt with costs, we can now draw the line for total sales. Remember that we assume that all output is sold for the same selling price (in this case - £10 per unit). So total sales for 2,000 units will be £20,000; 10,000 units will make £100,000 of sales. The total sales line is drawn in blue below.
Finding break even on the graph
First, the break-even output. Remember this is the point where total sales = total costs. So the output is the point where the total sales line crosses the total costs line (e.g. where the blue line crosses the green line). Find this point on the chart and then follow a vertical line down to the output (horizontal) axis. You can see this brings us to 6,666 (approximately, since our chart isn't drawn perfectly to scale!).
Another thing you can notice from the chart is that over a range of output, total costs are higher than total sales (the green line higher than the blue line). That means that in this range, the business is making losses. This is the loss-making range of output.
The difference between the actual output and the break-even output is known as the "margin of safety". For example, if the actual output was 8,000 units, then the margin of safety = 8,000 units less 6,666 units = 1,334 units.