Intelligence Testing
intelligence overview
theories
singular model (Spearman)
intelligence is singular (reflects a single ability)
“g” for general (single) Intelligence
plural model (Thurstone)
intelligence is multiple abilities that may not relate to each other
there are many different kinds of intelligence that do not necessarily correlate strongly, such as:
verbal comprehension
logical reasoning
perceptual speed
numeric facility
word fluency
associative memory
spatial visualization
hierarchical model
blends singular and plural models
a global, overall intelligence factor (“g-factor”) that includes relatively ability-specific factors
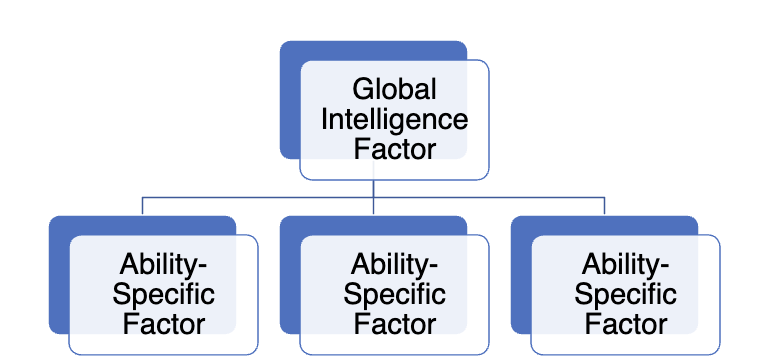
most current intelligence tests follow a hierarchical model of intelligence
single IQ score
several ability-specific scores
sub-test scores represent more narrowly defined skills

uses
predict future achievement
characterize functional impairment
academic planning
cognitive changes over time
influence approach to assessment
many strategies assume average intelligence for question comprehension
influence approach to therapy
vocabulary
expectations for abstract reasoning
use of written material
Wechsler Adult Intelligence Scale (WAIS)
1939
“the global capacity of a person to act purposefully, to think rationally, and to deal effectively with his/her environment”
test structure
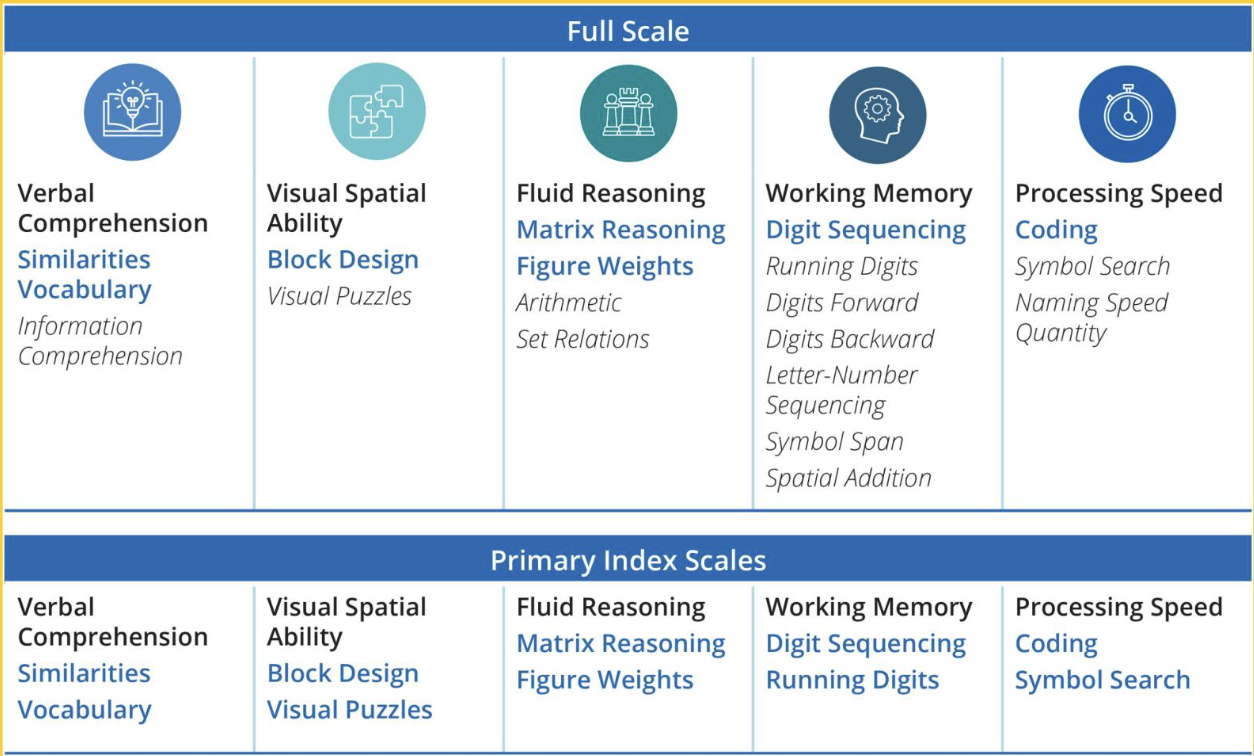
5 index factors
verbal comprehension index (VCI): verbal concept formation and verbal reasoning
visual-spatial processing index (VSI): spatial processing and visual-motor integration
fluid reasoning index (FRI): deductive reasoning and logical thinking
working memory index (WMI): the capacity to store, transform, and recall incoming info/data in short-term memory
processing speed index (PSI): ability to rapidly and accurately process simple rote info
two summary scores
full scale IQ (FSIQ)
based on total performance
the “intelligence quotient”
general ability index (GAI)
based only on VCS and PRS
allows for an estimate of intelligence without motor skills-related measures (using a pencil to complete tasks)
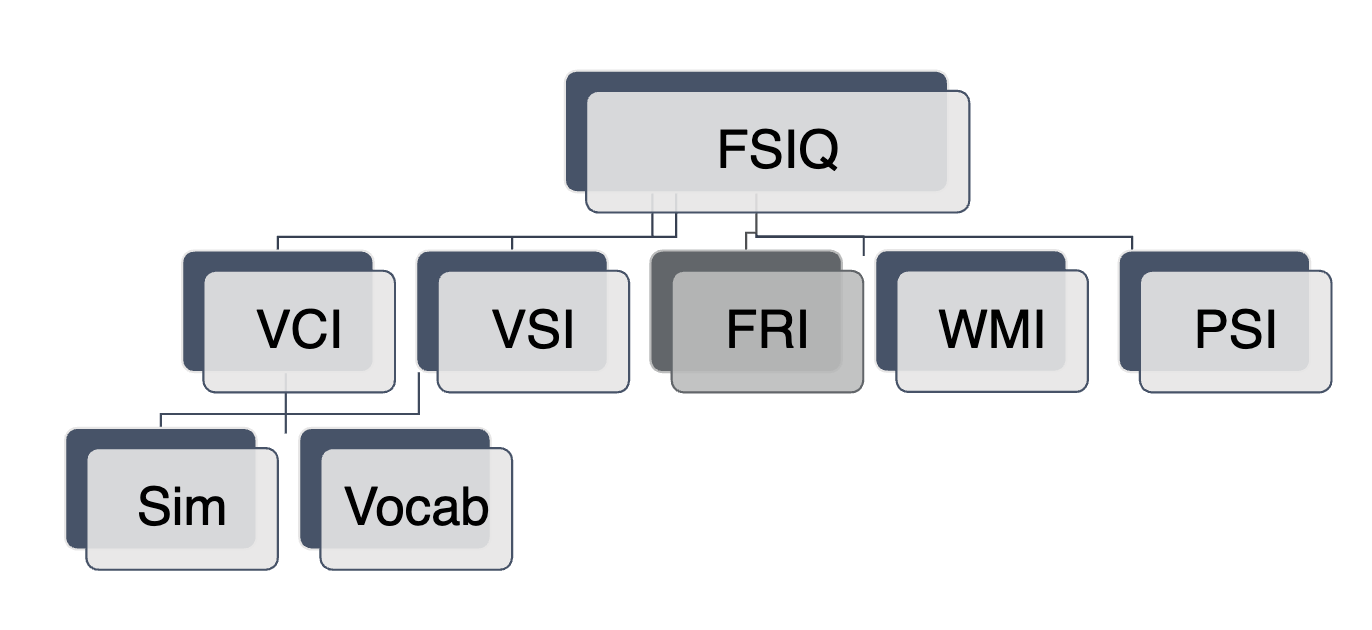
hierarchical model
FSIQ
five subscales
VCI
similarities: abstract verbal reasoning
vocabulary: degree to which one has learned, can comprehend, can express vocabulary
information: degree of general cultural info
comprehension: ability to deal with abstract social conventions, rules, expressions
VSI
block design: spatial perception, visual abstract processing, problem solving
visual puzzles
FRI
WMI
running digits: attention, concentration, mental control
“say the last number of each sequence 5-2-2”
digit sequencing: measures working memory capacity, mental manipulation, sequential processing
“say the numbers in order from smallest to largest "2-3-1”
digits forward, backward
PSI
coding: visual-motor coordination, motor and mental speed
symbol search: visual perception, speed
naming speed quantity: visual-perceptual speed
subtests
sim
vocab
scores
individual’s score is scaled relative to scores of same-age peers in normative sample
same IQ score has same meaning at different ages
“norm-referenced assessment”
normative sample: U.S. english-speaking population
national sample collected from February 2023- January 2024
2,020 people in the U.S. and 688 in Canada between ages 16 and 90, stratified by education, ethnicity, region
stratification enhances external validity
reference group for WAIS-5 is same-age peers
intelligence assumed to be “normally distributed” throughout population
most individuals fall closely together towards “average”
average IQ for age: 100
average range of IQs for age: 90 to 109
ranges of IQ scores based on cutoffs
average range: 90 - 109
higher ranges:
very superior: > 130
superior: 121 – 129
high average: 110 – 120
lower ranges:
low average: 80 – 89
borderline impaired: 70 – 79
impaired: < 70
psychometrics
high standardization
same questions, administration strategy
coding manuals, extensive training
high reliability for FSIQ and subscales
internal consistency (alpha >.90)
test-retest (r from .67 to .94)
good validity for FSIQ and subscales
measures what it says it’s supposed to measure
high utility
challenges
time intensive (45 minutes for FSIQ)
scores can be influenced by factors that are unrelated to intelligence
educational background
cultural background
motivation
intimidation/anxiety
physical testing conditions
scale may not adequately cover the concept of intelligence
significant questions about control validity
in initial development, Wechler was aware that his scale measured only a portion of intelligence
other attributes contributing to intelligent behavior include:
planning and goal awareness
persistence
enthusiasm
resisting impulsivity
managing anxiety
benefits
purpose of revising WAIS-5:
less time intensive than previous edition
expanded theoretical foundations (fluid reasoning, visual-spatial processing, verbal comprehension)
increase in developmental appropriateness (succinct instructions, simplified language)
increased user friendliness (item security, portable stimuli, online administration)
updated psychometric properties (norms, item bias, floors and ceilings)
increased clinical utility (test structure, interpretive clarity)
broader construct coverage of working memory, fluid reasoning, and processing speed
lower rates and clinician and client fatigue
predict
what DOES predict
grades in school
number of school years completed
academic performance through first year of college
landing a job
what DOESN’T predict
emotional adjustment/happiness
creativity
interpersonal relationships/marital status
motivation
character
IQ: genetic & environmental influences
genetic influences (Nisbett et al., 2012)
heritability= .40 to .80
heritability lower in low-SES families
intelligence clearly polygenic
environmental influences
lack of micronutrients, presence of environmental toxins decrease IQ scores
variables associated with low SES associated with lower IQ scores
breast-feeding increases IQ scores
educational interventions with children in low-SES families increase IQ scores
overview
IQ scores don’t predict everything
be careful not to over interpret IQ scores; to assume that they mean more than they actually do
the WAIS is not assessing all of what we mean by intelligence
current best practice recommendations indicate that the practitioner should view everyone as unique and consider attributes other than intelligence when interpreting test results