Mendelian Genetics
Trait Blending
it was believed that offspring represented a blend of parental traits
mating a tall cow with short cow would produce a cow of moderate heights
this was be the case under certain circumstances
when observing specific genes
often traits are not blended, but one or the other
eye color, ear lobes, Rh factor…
Gregor Mendel
Austrian monk who statistically analyzed inheritance patterns
worked with the garden pea (Pisum sativum)
chosen because ease of growth, discreet trait variation and can be artificially crossbred
he analyzed 7 traits (flower color, heights, pea color, pea shape…)
each trait had 2 phenotypes which could be easily differentiated (ex. white vs purple)
bread and crossed varieties with each other
cut away anthers (pollen source) of flowers to artificially cross plants of interest
and prevent accidental spontaneous crosses
determine how these crosses would affect the traits of the offspring
determined that blending was not an adequate description of inheritance
Mendel believed that the traits were passed on by particles
each conveying its particular trait to the next generation
Mendel’s Experiments
bred plants who’s offspring did not vary in the trait in question
called true breeding (TB), a tall plant bred with another tall would only produce tall plants
crossing plants which were TB for a specific trait led to predictable outcomes
yellow seed X yellow seed → 100% yellow
green seed X green seed → 100% green
then bred a TB green seed plant with a TB yellow seed plant
next generation would contain only plants with yellow seeds, her termed this dominant
green (TB) X yellow (TB) → 100% yellow (F1)
he took some of the new generation and bred them together (or self pollinated)
some plants with green seeds would appear (around 25% of the plants)
yellow (F1) X yellow (F1) → 75% yellow + 25% green
reciprocal crosses
crosses made to test if sex of parent impacts the outcome
parents of each type are chosen and crossed using alternative pairings
he determined that these traits were not sex dependent
F1 and F2 patterns of inheritance similar regardless of parental source
dwarf plant pollinates tall plant
tall plant pollinates dward plant
results for F1 and F2 are the same
repeated these experiments for multiple traits
found the same outcomes for all 7 traits analyzed
he began a rigorous analysis for the traits which he selected
his experiments are the basis of modern genetics
he used high quality inputs (true breeding lines with discreet traits)
his experiments are easily repeatable and balanced (by reciprocal crosses)
he rigorously analyzed his experiments statistically, repeating them for increased increased power
in his experiments he used a few non standard terms
true breeding generation the P (parental) generation
second generation the F1 (F= filial: refers to a son or daughter)
third generation F2 (second filial)
Terminology
true breeding
organism which produces offspring invariant in a trait
always gives rise to offspring which are invariant in the trait (are the same)
when bred to itself or other similar true breeding organisms
indicates that the organism is invariant (homozygous) for the trait in question
homozygous is two copies of the same allele
traits can differ not only in morphology, but some can overpower others
dominant
when present in an organism, this trait is always expressed
recessive
this trait is masked by a dominant trait
only expressed if only the recessive allele is present (homozygous)
Mendel’s Laws
Law of Dominance
recessive alleles will always be masked by their dominant counterparts
Law of Segregation
each organism contains two alleles for each trait
the alleles segregate during meiosis, so each gamete contains one allele for each trait
Law of Independent Assortment
during gamete formation, segregating pairs of unit factors assort independently of each other
segregation of any pair of unit factors occurs independently of all others
alleles for other traits are passed inherited independently from one another
inheritance of an allele for trait A does not the trait B allele
if an individual contains a pair of like unit factors (e.g. both specific for tall), than all its gametes receive one of that same kind of unit factor
if an individual contains unlike unit factors (e.g. one for tall and one for dwarf), then each gamete has a 50% probability of receiving either the tall or the dwarf unit factor
Modern Understanding
Mendel was correct in the particulate nature
but did not know about DNA being the particle
segregation occurs during the reductional division of meiosis
the 2nd law is true for genes (traits) on different chromosomes
not for genes on the same chromosome (linked)
we are not aware of multiple types of “non-Mendelian” inheritance
many other genetic systems not covered by his rules
including; incomplete dominance, codominance, polygenic traits, pleiotopy…
Modern Terminology
allele: alternative versions of a gene
ex. unit factors representing tall and dwarf are alleles determining the height of the pea plant
homozygous: an organism which contains only one allele for a gene (DD or dd)
heterozygous: an organism which contains multiple alleles for a gene (Dd)
dominant allele: typically this allele which makes a fully functional protein
therefore, it actively produces the phenotype
written with a capital letter (A, G, Y)
recessive allele: typically an allele which makes no fully functional protein
the phenotype is typically due to a lack of protein/product
written with a lowercase letter (a, g, y)
the letter used to represent a gene are always the same, regardless of allele
genotype: the allelic makeup of an organism (hetero/homozygous)
phenotype: the outward representation of the genotype (morphology)
physical expression
organisms expressing a dominant trait (yellow peas [Y]) can be either
homozygous for the yellow gene (two yellow alleles) (YY)
heterozygous (one yellow allele, one green allele) (Yy)
only a homozygous recessive (yy) will produce green peas
prior to modern genetic techniques, genotype was determined by cross
cross breed it with a recessive organism (test cross)
the simplest way to determine the genotype of a dominant phenotype organism
dominant phenotypes can mask recessive phenotypes
the genes are still present, so they can be passed on and present themselves in offspring
Punnett Square
named after reginal crundall punnett
a british geneticist
a diagram used to predict the genotypes of a particular cross
can help determine the probability of specific genotypes in offspring
all possible paternal genotypes are drawn out as inputs
they are crossed in all possible ways to determine the outcomes
the number and frequency of each outcome can be calculated
Monohybrid Cross
mating true-breeding individuals from two parent strains, each exhibiting one of the two contrasting forms of the character under study
analyzes only one locus (gene/trait)
only useful if there are multiple alleles for the gene in the population
can be charted by using a punnett square
write out all possible paternal gametes (2^1 = 2)
cross them with all possible maternal gametes (2^1 = 2)
ratios tend toward 4ths (1:4, 2:4, 3:4, 4:4)
initially, we examine the first generation of offspring of selfing, that is, of self-fertilization of individuals from the first generation
trait expressed in F1 generation is controlled by the dominant unit factor
the trait not expressed is controlled by the recessive unit factor
Dihybrid Cross
analyzes two loci (gene/trait)
only useful if there are multiple alleles for both genes in the population
can be charted by using a punnett square
write out all possible paternal gamete configurations (2² =4)
cross them out with all possible maternal gamete configurations (2² = 4)
ratios tend toward the 16ths (9:3:3:1 for F2 generation in a standard cross)
independent assortment states that all possible gamete types will form if possible
ideal ratio based on probability events involving segregation, independent assortment, and random fertilization
F1 cross example
tall plants with green pods (TTYY) x short plants with yellow pods (ttyy)
TTYY x ttyy = all TtYy plants
Probability
not all parents can produce multiple gamete types
unity rule
the sum of all probabilities of all possible states/events will be 1
product rule (multiplication rule)
used to predict frequency of independent events occurring simultaneously
the probability of two or more independent events occurring simultaneously is equal to the product of their individual probabilities
ex. F2 plants having yellow and round seeds [ ¾ × ¾ = 9/16 ]
sum rule (addition rule)
the probability of obtaining any single outcome, where that outcome can be achieved by two or more events, is equal to the sum of the individual probabilities of such events
probability of outcomes independent of each other are added together
ex. what is the likelihood of flipping 2 coins and getting one heads and one tails?
½ x ½ = ¼ ; ½ x ½ ; so, we calculate the odds of either by ¼ + ¼ = ½
quotient rule (conditional probabilities)
probability of an event (A) given that another event (B) occurs
calculated as the quotient of the probabilities of each event P(A|B) = (PA)/(PB)
important for calculation probabilities when events are dependent
key term is “given that” or “if”
choosing a playing card
cance to pick the 2 of hearts is 1/52
chance of picking a heart is ¼
what is the chance of picking the 2 of hearts given that you draw a heart?
(1/52)/(1/4) = 1/13
to calculate the gametes in a dihybrid cross
we calculate the probabilities of each independent event occurring
50% G or 50% g and 50% W or 50% w
“AND” tends to imply that you are going to multiply, where as “OR” indicates addition
ex. 50% G or 50% g includes an OR, so you add them to ensure that 100% is accounted for
the gamete needs one copy of each gene, and it can either get G allele OR a g allele
now of the 50% that got G, 50% of those will get a W (the other 50% get a y)
the AND in the statement implies multiplication
50% x 50% = 25%, so ¼ of the gametes are GW (and we also have ¼ Gw, ¼ gW, and ¼ gw)
now doing the cross involves multiplying the probabilities of a fertilization
each event is equal in probability if there are no other factors involved
independent assortment
no outcome has no influence on any other outcome
the chance of a man and a woman having a male child is 50%
having a child does not affect the outcome of (sex) of the next child
chance that the next child will be female is still 50%
some factors mat modify the probabilities of inheritance
sex linkage, lethal phenotypes, epistasis…
these will have to be accounted for if charted using a punnett square
Frequencies of Genotypes
for a given locus with 2 alleles [A and a]
the total number of alleles must equal 1
knowledge of the frequency of one allele can allow calculation of the other
allowing us to calculate the allele frequencies in populations
p = frequency of allele A
q = frequency of allele a
p + q = 1
f(AA) = p²; f(Aa) 2pq; f(AA) = p²
p² + 2pq + q² = 1
Homologous Pairs
criteria for classifying two chromosomes as homologous pairs
both are same size and exhibit identical centromere locations
excludes X and Y chromosomes in mammals
form pairs or synapse during stages of meiosis
contain identical linear order of gene loci
one member of each pair is derived from each parent
the maternal parent and one from the paternal parent
Test Cross
the genotype of an organism expressing a dominant trait is not obvious
if we are relying on phenotype alone
testcrosses are designed to determine genotypes of dominant phenotypes
the organism expressing the dominant phenotype but having an unknown genotype is crossed with a known homozygous recessive individual
ex. if a tall plant of genotype DD is testcrossed with a dwarf plant, which must have dd genotype, all offspring will be tall phenotypically and Dd genotypically
if a tall plant is Dd and is crossed with a dwarf plant dd, then ½ of the offspring will be tall (Dd) and the other half will be dwarf (dd)
as the dominant trait masks any recessive alleles
you need to isolate the recessive alleles to allow for detection
a testcross crosses a subject and an individual with recessive phenotype
if test yields only dominant offspring, then the parent is true breeding
we can be reasonably sure that the parent is homozygous (AA) for the gene
if offspring are a mix of phenotypes, the parent is not true breeding
the parent with the dominant phenotype is heterozygous (Aa) for the gene
charting a testcross is much simpler than charting a typical cross
due to the invariability of one parents’ gametes
the recessive organism can only produce recessive gametes
so can be represented in one row/column
testcrosses can be performed with any number of traits
dihybrid and trihybrid crosses are common research tools
may also be applied to individuals that express two dominant traits but whose genotypes are unknown
Trihybrid Cross
3 pairs of contrasting traits
tracks the inheritance patterns of 3 loci
a heterozygote in all 3 loci would have 8 (2³) possible gamete combinations
ABC, abc, aBC, Abc, AbC, aBc, ABc, abC
punnett square with 64 boxes
forked line method (branched diagram) is the easier router
relies on the simple application of the laws of probability established for the dihybrid gamete formation
Predicting Genetic Outcomes
genetic outcomes rely on a degree of a chance
independent assortment introduces randomness in the system
then random fertilization events further randomize things
chance must be accounted for when conducting experiments
you need to show that your findings are unlikely to be random deviations
sample size
as your sample size increases deviation from predicted value decreases
larger sample sizes provide larger statistical power
X² (Chi-Square) Analysis and Null Hypothesis
Null Hypothesis (H0)
the claim that the effect being studied does not exist
often used to confirm the conclusions of other studies
assumes data will fit given ratio
assumes there is no real difference between measured and predicted values
apparent difference attributed purely to chance
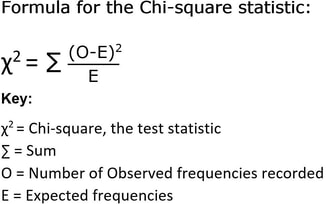
Chi-square analysis
goodness to fit of the null hypothesis
evaluates how well the data fit the null hypothesis
compares observed data to expected data deviations
Chance deviation
the odds that events were subject to random fluctuations
expected outcome is diminished by larger sample size
X² value
used to estimate how frequently the observed deviation can be expected to occur strictly as a result of chance
degrees of freedom
the number of values your calculation that are free to vary
how many components are being studied or must be known for a test
the more df the more you would expect things to vary by chance
(df) = (n-1)
where n is the number of categories into which the data are divided, or the number of possible outcomes
degree of freedom must be taken into account because the greater the number of categories, the more deviation is expected as a result of chance
Significance level
arbitrary threshold level for accepting or rejecting the null hypothesis
typically, biological use p of o.05 (though 0.01, 0.001 and not uncommon)
X² value can be interpreted in terms of a probability value (p)
P < 0.05
the probability of the observed deviation is less than the significance level
we reject the null hypothesis
P > 0.05
the probability of the observed deviation is greater than the significance level
we do not reject the null hypothesis
or in other words “the results are consistent with the null hypothesis”
The H0 may be correct or incorrect either way
we are just evaluating statistical outcomes of our test(s) and stating the likely case
Pedigrees
family tree with respect to given trait
pedigrees are a useful tool to track inheritance
can be useful for tracing genetic traits through generations
can be used to identify inheritance patterns
determining if a trait is sex-linked or autosomal
determining if a trait is caused by a dominant or recessive allele
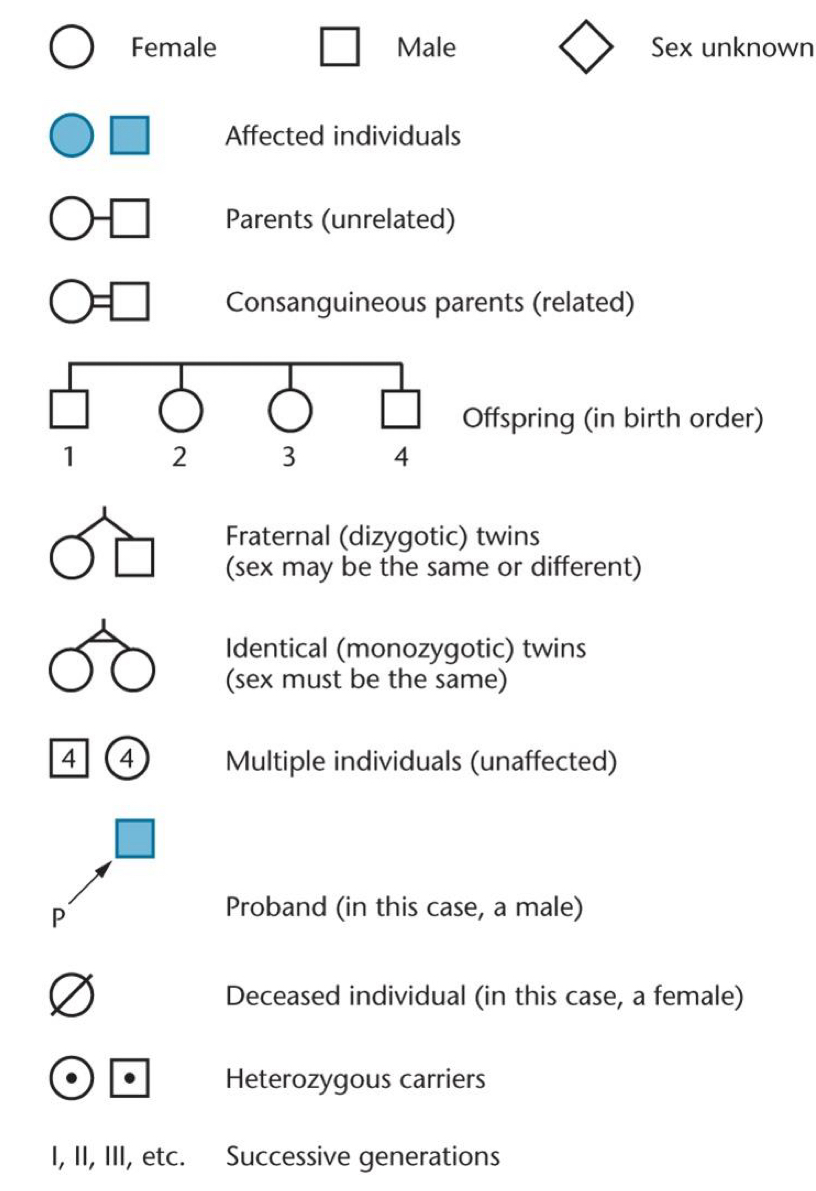
circle → female
square → male
diamond → unknown sex
parents connected by a single horizontal line
offspring stem off vertical line from parent
double line
related parents, such as two cousins (“consanguineous”)
twins
diagonal lines stemming from vertical lines connected to the sibship line
identical (monozygotic) twins → diagonal lines are linked by horizontal line
fraternal (dizygotic) twins → lack this connected line
siblings (sibs)
connected by a horizontal sibship line
placed in birth order from left to right and labeled with arabic numerals
circles, squares, and diamonds are shaded if the phenotype being considered is expressed and unshaded if its not
in some pedigrees, those individuals that fail to express a recessive trait but are known with certainty to be heterozygous carriers have a shaded dot within their unshaded circle or square
proband
individual whose phenotype first brought attention to the family
is indicated by an arrow connected to the designation p
Autosome Linked Inheritance
autosomes
chromosomes 1-22, all except X and Y (allosomes)
often follow the normal pattern of inheritance we have been studying
each offspring is as likely to inherit one copy as the other from the parents
recessive phenotype implies that you have 2 recessive alleles
this is due to the copy number of the chromosomes
diploid organisms contain 2 copies of each autosome
therefore, they have a 50% chance of passing the allele to each offspring
Autosomal Disorders
recessive
cystic fibrosis
develop very thick mucus which builds up in the lungs
interferes with respiratory system and other organisms
tay-sachs
progressive neurodegenerative disorder, affected individuals rarely survive past 6 years old
non-functional hexosaminidase A protein
leads up to buildup of gangliosides in nerve cells
dominant
osteogenesis imperfecta
brittle bones due to mutant collagen gene
achondroplasia
most common form of dwarfism