Calculating rate from graph
From a graph, there are three different rates that can be calculated:
rate between two times
initial rate – i.e. at the instant that substrate and enzymes are mixed
rate at a particular time.
Using the graph below, these different rates are calculated as follows:
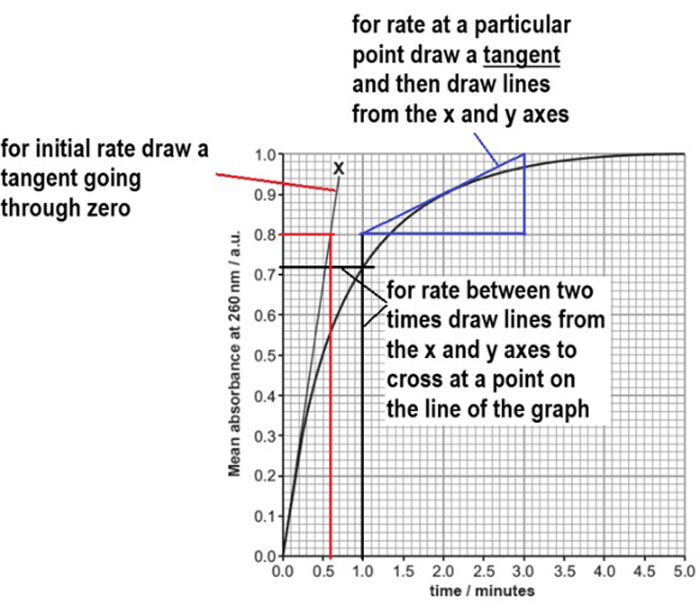
Rate between two times:
Rate between 0 and 1.0 minutes is calculated as:
rate = change in y axis value/change in x axis value = 0.72 – 0/1.0 – 0
= 0.72/1 = 0.72au minute^-1
Initial rate:
Initial rate at 0 minutes is calculated as:
rate = change in y axis value/change in x axis value = 0.80 – 0/0.6 – 0 = 0.8/0.6 = 1.33au minute^−1
Rate at a particular time:
Rate at 2.0 minutes is calculated as:
rate = change in y axis value/change in x axis value = 1.0 – 0.8/3.0 – 1.0= 0.2/2.0 = 0.1au minute^−1
Explanation:
The initial rate is always highest as the concentration of substrate is the highest, so there is the highest frequency of successful collisions and the highest rate.
As the reaction progresses, substrate is converted to product so concentration decreases. There is a lower frequency of successful collisions and the rate decreases.
When all the substrate has been converted to product, the rate will decrease to zero.