ch4. equilibrium
Overview
Main Topics:
Understanding markets and their organization.
Market equilibrium: Supply equals demand; analyzing surplus and shortage.
Predicting changes in markets through shifting supply and demand curves.
1. Understanding Markets
Definition of a Market: A setting where buyers (demanders) and sellers (suppliers) interact to exchange goods or services.
Market Organization:
Planned Economy: Centralized decisions dictate production, allocation, and distribution.
Market Economy: Decentralized decisions by individuals through buying and selling.
Examples of Markets:
Goods/services: Coffee shops, Etsy, Airbnb.
Non-monetary: Marriage markets in some cultures.
Questions Markets Address:
What to produce?
How to produce it?
Who receives the goods?
2. Equilibrium: Supply Meets Demand
Key Concepts:
Equilibrium Price: Price where xquantity supplied equals quantity demanded.
Equilibrium Quantity: Quantity exchanged at equilibrium price.
Scenarios:
Shortage: Demand exceeds supply (e.g., gas price at $1.20 in Canada causes a shortage of 30 million liters).
Surplus: Supply exceeds demand (e.g., gas price at $1.60 causes a surplus of 30 million liters).
Graphical Analysis:
Equilibrium is the point where supply and demand curves intersect.
Prices above equilibrium lead to surplus, pushing prices down.
Prices below equilibrium lead to shortage, pushing prices up.
3. Predicting Market Changes
Shifts in Demand
Demand Shifters:
Income changes (normal vs. inferior goods).
Preferences.
Prices of substitutes/complements.
Expectations about the future.
Congestion/network effects.
Number of buyers.
Impact of Demand Shifts:
Increase in Demand: Higher equilibrium price and quantity (curve shifts right).
Decrease in Demand: Lower equilibrium price and quantity (curve shifts left).
Shifts in Supply
Supply Shifters:
Input costs.
Technology changes.
Prices of related outputs.
Seller expectations.
Number of sellers.
Impact of Supply Shifts:
Increase in Supply: Lower equilibrium price and higher quantity (curve shifts right).
Decrease in Supply: Higher equilibrium price and lower quantity (curve shifts left).
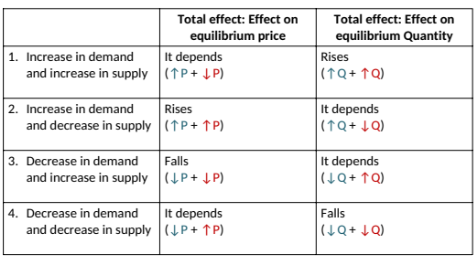
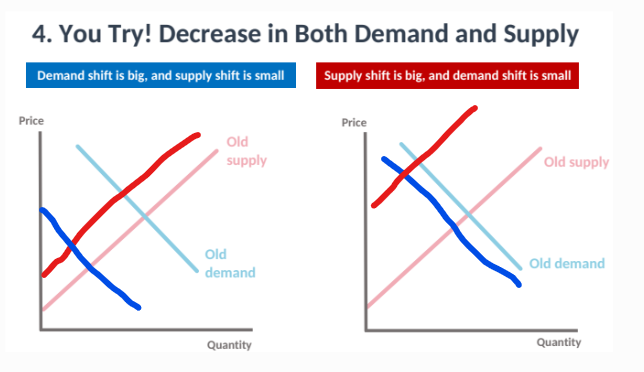
Simultaneous Shifts in Supply and Demand
Effects depend on the magnitude of each shift:
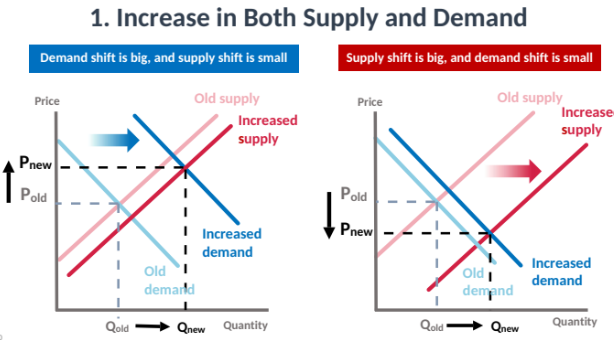
Both increase: Quantity rises, but price effect depends on which shift is stronger.
Both decrease: Quantity falls, with similar ambiguity for price.
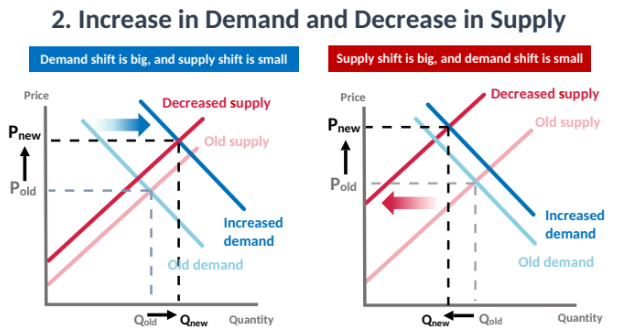
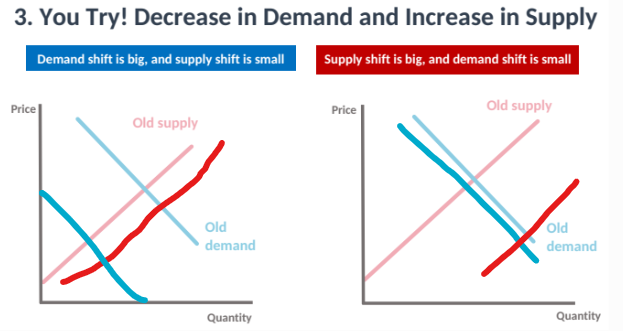
Opposite shifts: Effects on price and quantity vary based on which curve shifts more.
4. Using the Supply-Demand Framework
Applications:
Predicting market outcomes from real-world events.
Diagnosing observed price and quantity changes.
Rules for Diagnosing Changes:
If price and quantity move in the same direction, the demand curve has shifted.
If price and quantity move in opposite directions, the supply curve has shifted.
Examples:
Rise in e-books reduces book prices but increases quantity (supply shift right).
Valentine’s Day raises rose prices and quantities (demand shift right).
Takeaways
Markets are foundational to organizing society.
Equilibrium occurs where supply equals demand, eliminating tendencies for price change.
The supply-demand framework is crucial for understanding, predicting, and diagnosing market behavior.