Biochemistry: The Krebs Cycle
Biochemistry: The Krebs Cycle
Chapter Overview
Learning Objectives:
Understand the big picture of the Krebs Cycle
Know about Dr. Hans Krebs and the discovery of the cycle
Understand the role of mitochondria in the Krebs Cycle
Learn about Coenzyme A and acetyl CoA
Examine the steps of the Krebs Cycle
Analyze energy extraction during the cycle
Review regulation mechanisms of the cycle
The Big Picture
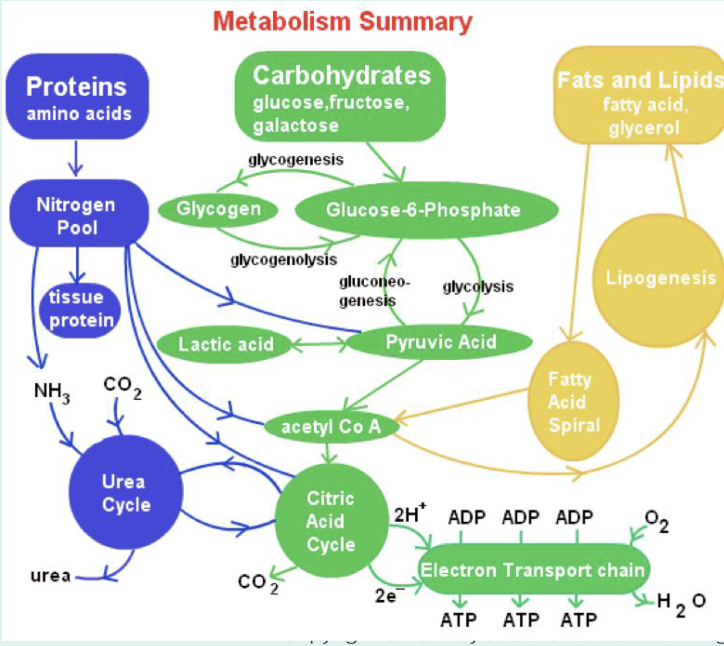
Aerobic Metabolism Overview
Three Major Processes:
Citric Acid Cycle
Electron Transport Chain
Oxidative Phosphorylation
Important Intermediates:
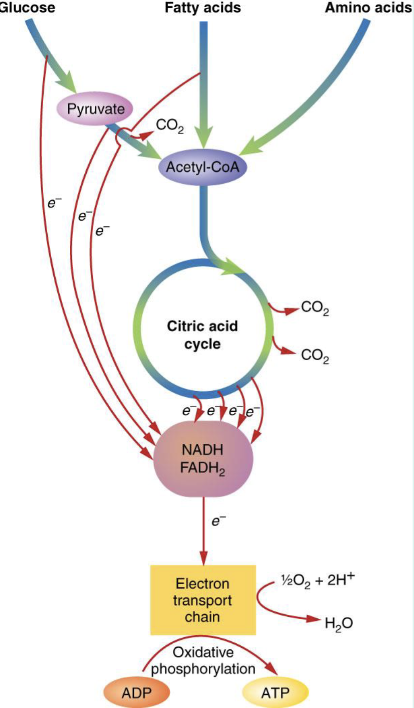
NADH and FADH₂ act as electron carriers during oxidation-reduction reactions.
Oxidation steps to push electrons to the transport chain
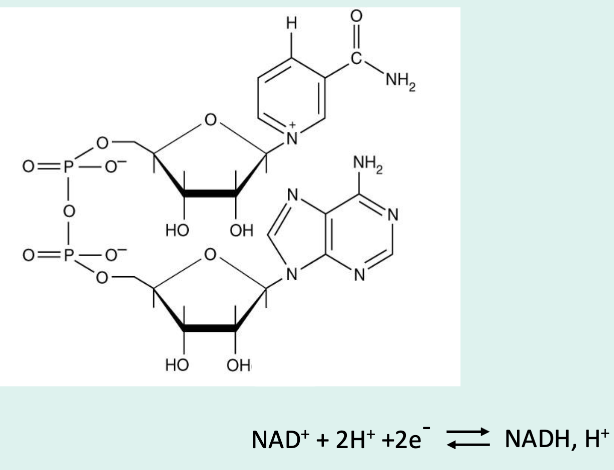
Key Coenzymes
Nicotinamide Adenine Dinucleotide (NAD):
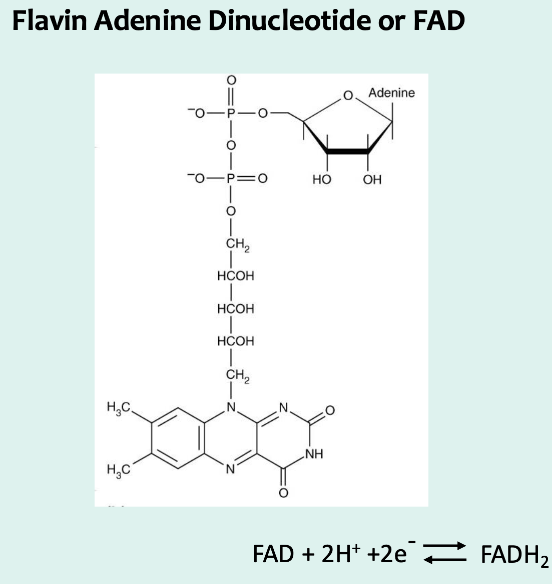
Flavin Adenine Dinucleotide (FAD):
The Krebs Cycle Steps
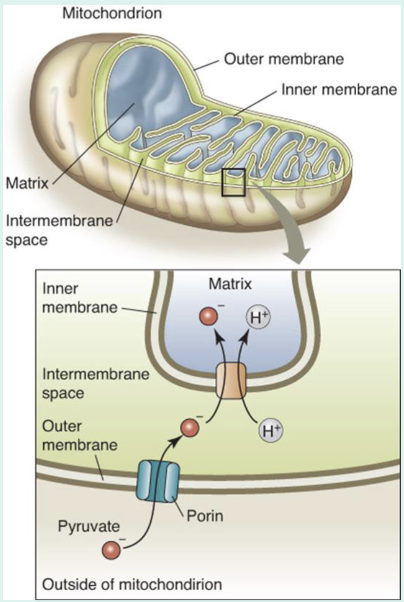
Location: Occurs in the mitochondria.
Transport Mechanism:
Cytosolic pyruvate must cross two mitochondrial membranes:
Outer membrane uses porins
Inner membrane uses transport proteins.
Coenzyme A
Role: Acyl carrier molecule essential for metabolism.
Steps in the Cycle
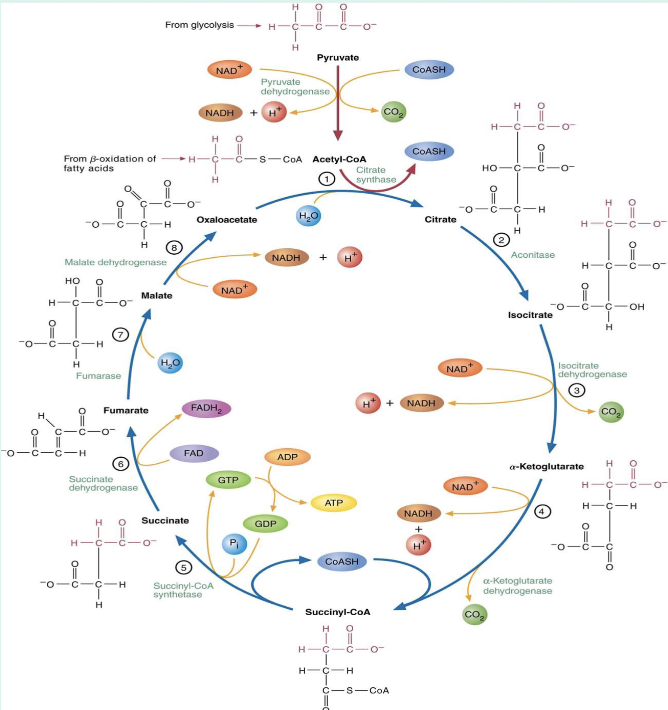
Condensation: Acetyl-CoA combines with oxaloacetate to form citrate.
Dehydration and Isomerization: Citrate is converted to isocitrate via aconitase.
Oxidative Decarboxylation: Isocitrate converted to alpha-ketoglutarate, producing NADH and CO₂.
Further Decarboxylation: Alpha-ketoglutarate is transformed into succinyl-CoA, generating another NADH and releasing CO₂.
Substrate-Level Phosphorylation: Succinyl-CoA to succinate, forming GTP (or ATP).
Dehydrogenation: Succinate to fumarate generates FADH₂.
Hydration: Fumarate converted to malate.
Final Oxidation: Malate to oxaloacetate produces another NADH.
The cycle ends by regenerating oxaloacetate, allowing it to react with another acetyl-CoA.
Energy Extraction from the Krebs Cycle
Summary of Energy Outputs
Comparison of energy production:
From glucose: 38 ATP total (from glycolysis to oxidative phosphorylation)
From 2 Acetyl-CoA: 24 ATP generated via Krebs and electron transport.
Table 9.2: Energy Production Breakdown:
Process:
Glycolysis produces 2 ATP, 2 NADH
Krebs Cycle from 2 acetyl-CoA yields 3 NADH, 1 FADH₂, 1 GTP (ATP equivalent).
Regulation of the Krebs Cycle
Key Control Points:
Citrate Synthase:
Regulated by substrate levels, ATP/ADP ratio, and NADH/NAD⁺ ratio.
Inhibited by its product (citrate).
Isocitrate Dehydrogenase:
Regulated by substrate availability and NADH/NAD⁺ ratio.
α-Ketoglutarate Dehydrogenase:
Regulation by substrate and NADH levels.
Summary Connections: Glycolysis and TCA Cycle
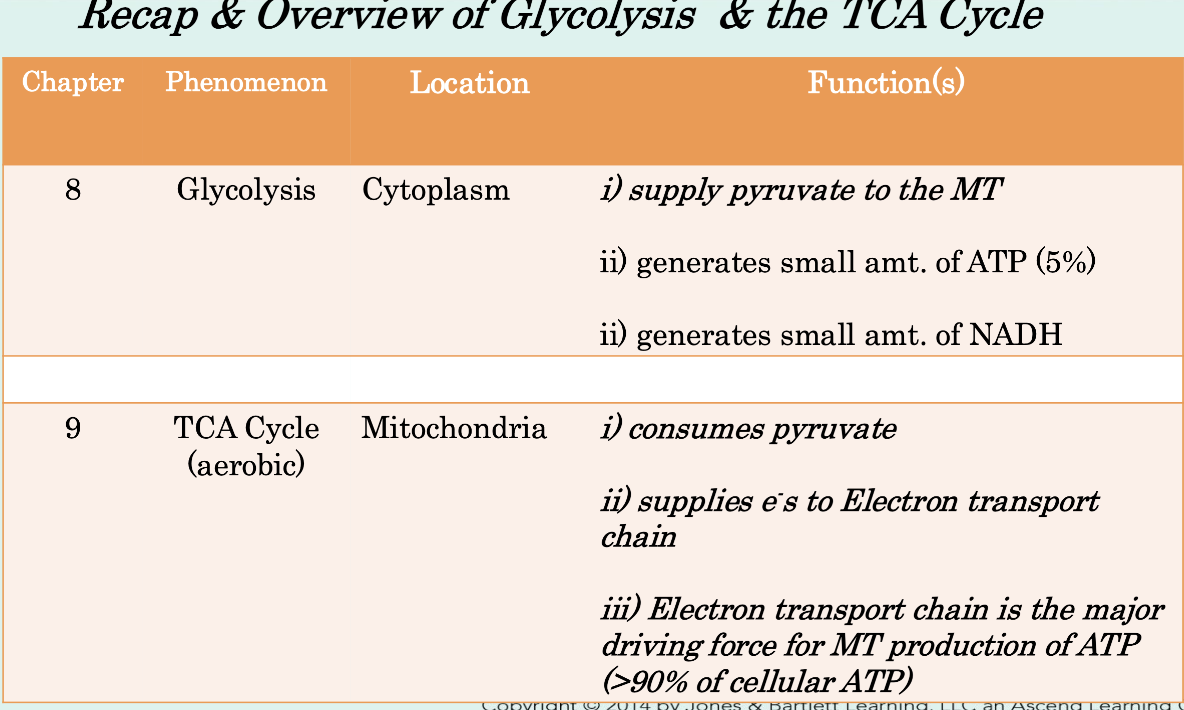
Glycolysis and the TCA Cycle are interconnected pathways essential for energy metabolism.
They collectively produce pyruvate, which enters the TCA as acetyl-CoA.