Revision
Introduction to Statistical Hypothesis
Definitions
Null hypothesis
States that there is no effect or no difference. It is the statement of no change or no relationship.
Alternate hypothesis ()
Is the idea that must be true if the null hypothesis is false. It often represents the researcher's prediction.
P-value
Tells us the probability of obtaining a difference as extreme as, or more extreme than, the one observed in our sample if the null hypothesis were true.
Essentially, it quantifies the likelihood of seeing our data purely due to random sampling variation but only if the null hypothesis IS true, assuming no real difference exists in the populations
Decision Rule for Rejecting :
States in biological research, the conventional threshold for statistical significance is .
If : There is a very low chance of observing such data if the null hypothesis were true. Therefore, we reject the null hypothesis.
If : There is a high chance of observing such data even if the null hypothesis were true. Therefore, we fail to reject the null hypothesis (we do not necessarily accept the null, but we don't have enough evidence against it).
Is the idea that must be true if the null hypothesis is fake
Statistical testing study
Investigated the ability of dogs to comprehend human body language cues by randomly selecting dogs from cooperative breeds and from independent breeds
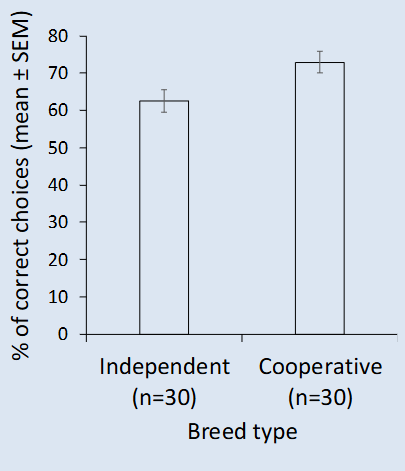
The Problem with Sample Variation:
Within any given population, individual dogs vary in their perceptiveness.
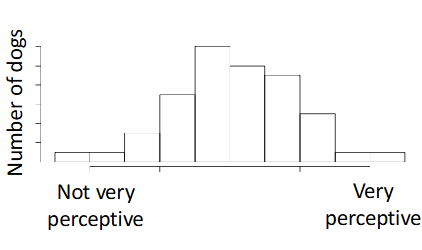
This raises the question: Is the apparent difference a genuine population-level effect or just an artifact of random sampling?
Conclusion of the Dog Study:
The null hypothesis would be : there is no difference in % correct between breed types
The alternative hypothesis would be : there is a significant difference in % correct choices between breed types
The statistical test for Gácsi et al. (2009) yielded a p-value of .
Since , the data observed are sufficiently unlikely to occur if the null hypothesis were true
Therefore, the null hypothesis is rejected, and the alternate hypothesis is accepted.
Conclusion: "There is a significant difference in the percentage of correct choices between independent and cooperative breed dogs!"
Selecting the Right Test
Types of Data & Graphing
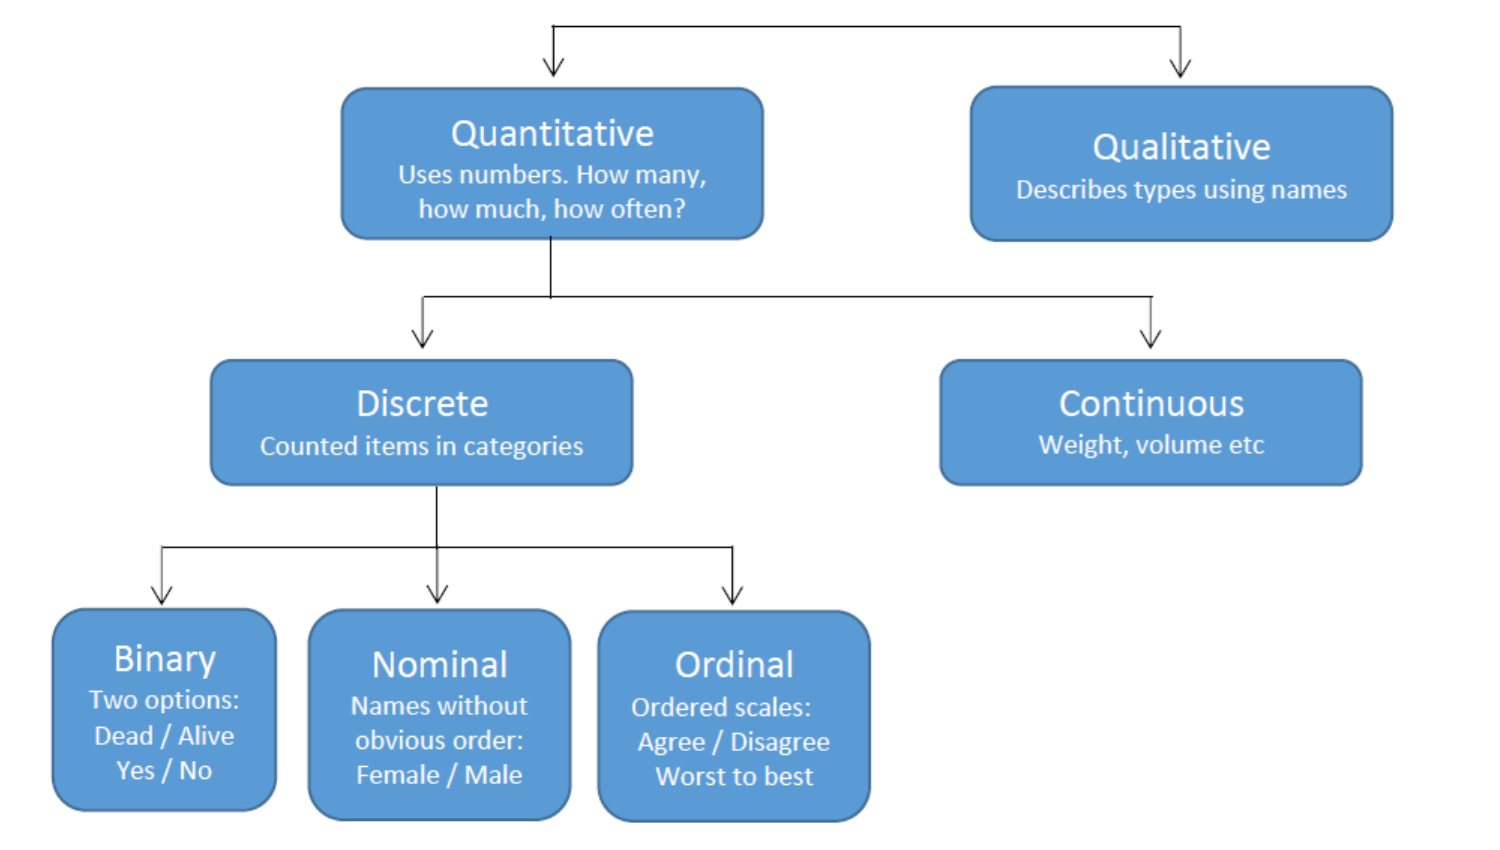
Variables in Analysis
Independent Variable:
Considered the cause
plotted on the x-axis.
Dependent Variable:
Considered the effect
plotted on the y-axis.
Graph Selection:
Understanding the nature of variables aids in deciding which statistical tool is appropriate.
Graph Types
Bar Graphs
Suited for tests of differences among two or more groups.
Scatter Plot
Proper for examining relationships between two variables.
Normal Distribution Definition
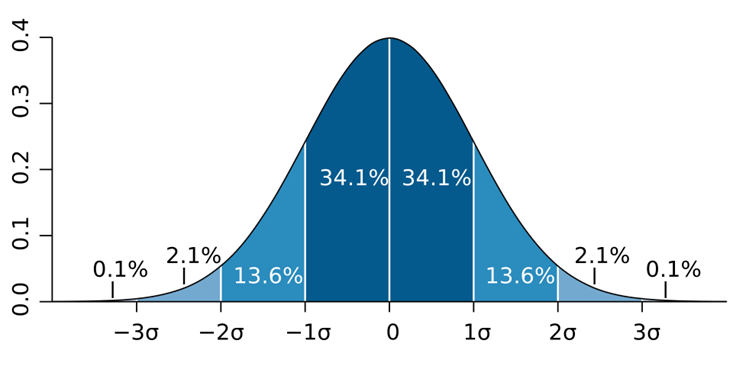
Defined by mean value (µ) and standard deviation (σ).
Parametric Statistical Methods
Parametric vs Non-Parametric: Focus on methods suitable for continuous data predominantly following a normal distribution.
Parametric tests assume normal distribution and homogeneity of variances.
The Central Limit Theorem: Suggests that with larger sample sizes, distributions will tend more closely toward normal.
Sample Mean (x): The average of the sample data.
Sample Standard Deviation (s): Measure of dispersion within the sample data.
Skew: deviation from symmetry caused by a long tail
Kurtosis: Measures the peak and tail thickness of the distribution.
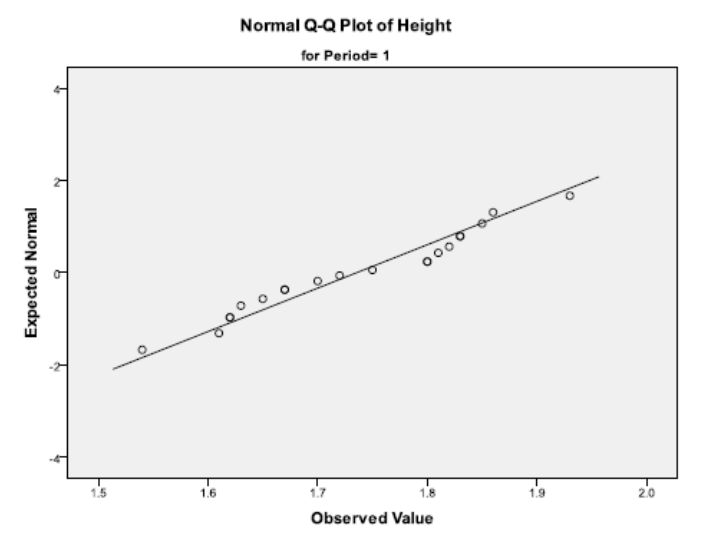
Q-Q Plots
Q-Q plots compare quantiles of observed data against theoretical quantiles of a normal distribution.
Points close to the reference line indicate normality; curves suggest departures from normality.
Caution: Normality tests can yield poor results with small sample sizes, making Q-Q plots more useful.
Error Measurements
Standard Error of the Mean (SEM)
Definition: SEM is the standard deviation of sample means.
Calculation: where n is the sample size.
95% Confidence Interval (CI)
CI indicates the range surrounding the sample mean where the true population mean is expected to fall in 95% of samples.
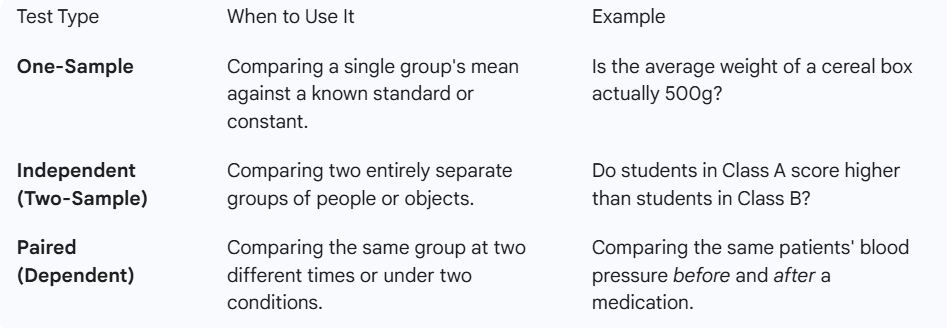
Here is a guide mapped to the folders you’ve provided.
1. The Decision Tree: Which Test to Use?
A. Comparing Groups (Difference)
Use these when you want to see if one group performed differently than another.
Number of Groups | Independent Variables (Factors) | Use This Test |
2 Groups (e.g., Male vs. Female) | 1 Factor | T-test |
3+ Groups (e.g., Low, Mid, High Dose) | 1 Factor | One-Way ANOVA |
3+ Groups | 2 Factors (e.g., Dosage AND Gender) | Two-way ANOVA |
B. Analyzing Relationships (Association)
Use these when you want to see if two variables move together.
Correlation: "Is there a link between study hours and exam scores?" (No prediction, just a relationship).
Linear Regression: "Can I predict a house price based on its square footage?" (Predicting an outcome).
2. When to use the "Special" Folders
Data and Assumptions
Before running any of the tests above (T-test, ANOVA, Regression), you must check if your data is "well-behaved."
Check for Normality: Use
shapiro.test()or look at a Q-Q plot.Check for Homogeneity of Variance: Use
leveneTest().If assumptions fail: This is where you go to the Data Transformation folder (to fix the data) or the Non-parametric folder.
Non-Parametric Tests
Use these if your data is not normally distributed (messy/skewed) or if you are dealing with ranks/ordinals.
Instead of a T-test: Use Mann-Whitney U or Wilcoxon.
Instead of ANOVA: Use Kruskal-Wallis.
Instead of Correlation: Use Spearman’s Rho.
Counting Frequency (Counts): Use Chi-Square (found in your "Non-Parametric... dealing with counts" folder).
Advanced Complicated Analysis
This likely covers scenarios where you have many variables at once:
Multiple Regression: Predicting one outcome using 3 or more predictors.
ANCOVA: An ANOVA but "controlling" for a third variable (a covariate).
3. Quick Reference Cheat Sheet
"Does [Category A] differ from [Category B]?"
→ T-test (Parametric) or Mann-Whitney (Non-parametric).
"Does [Category A, B, or C] affect [Score]?"
→ One-way ANOVA (Parametric) or Kruskal-Wallis (Non-parametric).
"Does [Variable X] predict [Variable Y]?"
→ Correlation/Regression.
"Is there a preference between [Option A] and [Option B]?" (Counting people)
→ Chi-Square.
4. Helpful R Functions to Remember
Based on your R Toolbox folder, keep these handy:
t.test(y ~ x)— T-testaov(y ~ x)— ANOVAcor.test(x, y)— Correlationlm(y ~ x)— Linear Model (Regression)ggplot()— For anything in your Graphing folder.