1.2.6 Price determination ——
What is equilibrium price and how is it determined
Price equilibrium is where supply is equal to demand so where the supply and demand curves cross.
Price is known as market clearing price as all products supplied to the market are cleared (bought), but no buyers are unable to buy the good
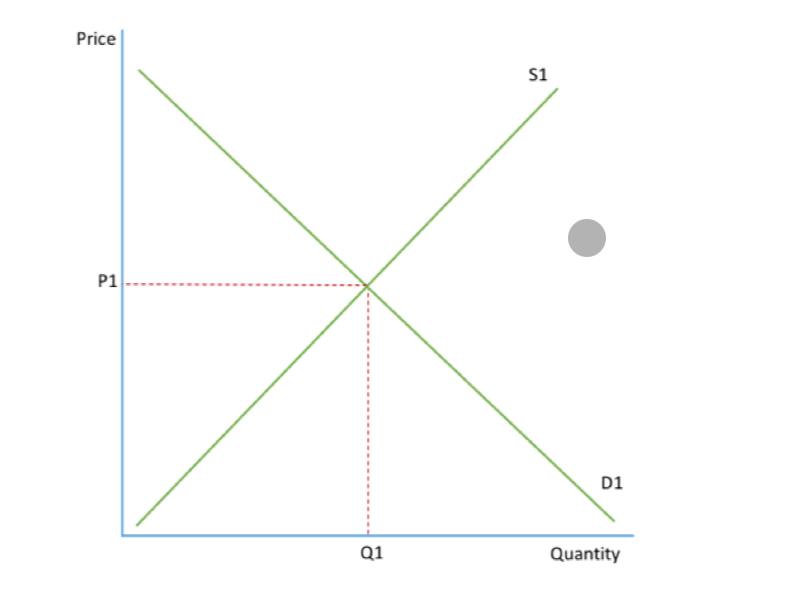
Example of market clearing price at P1
How to use supply and demand diagrams to depict excess supply and excess demand
Excess demand
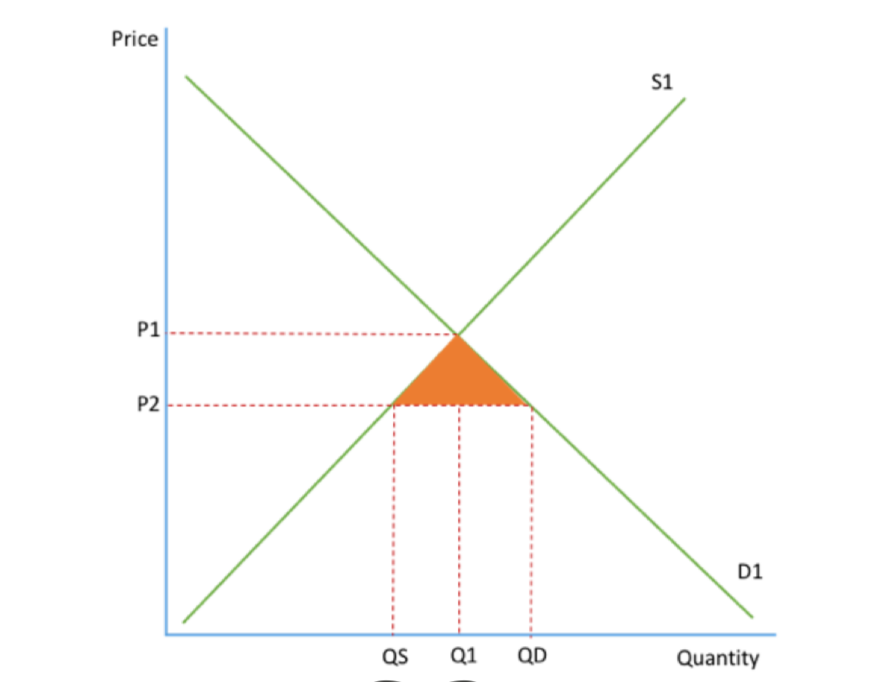
If price is set below equilibrium, then there is excess demand
At price P2, suppliers are willing to supply Qs but consumers demand QD meaning there is excess demand (of orange shaded area)
As a result there is a shortage in the market
The operation of market forces to eliminate excess demand
In the case of excess demand:
Firms know they can charge higher prices and still sell their goods
This will cause an extension in supply
They will now charge P1 for quantity Q1.
Higher price will lead to contraction in demand
The prices will now be at equilibrium
Excess supply
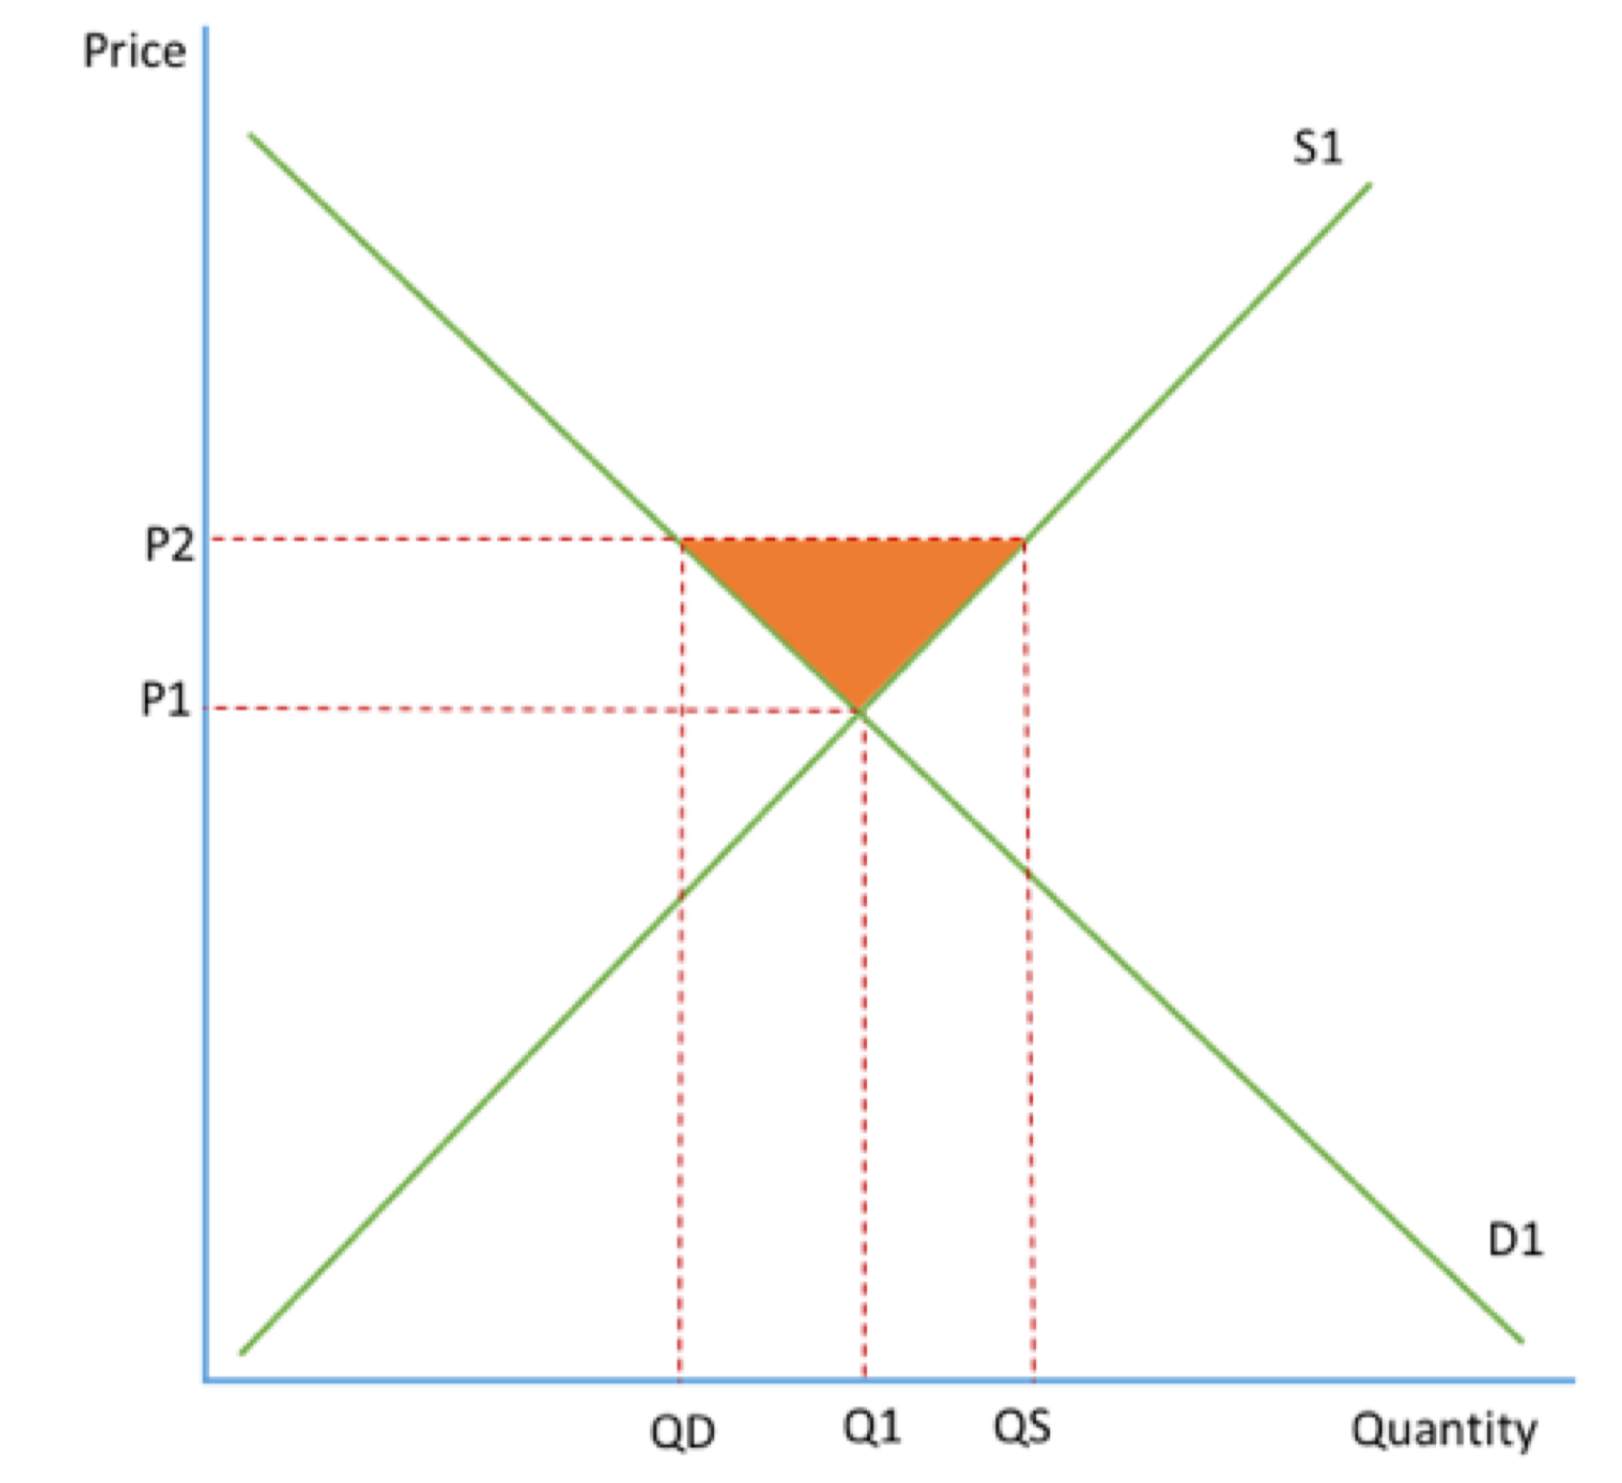
If price is set higher than equilibrium, there there is excess supply
At price P2, suppliers are willing to supply QS but consumers only demand QD meaning that there is excess supply of the orange shaded area
Prices would have to fall
The operation of market forces to eliminate excess supply
Firms have unsold goods which encourgaes them to put on sales to sell their excess goods
This causes prices to fall and supply to contract to P1
Demand will extend to P1
The market will now be in equilibrium
The use of supply and demand diagrams to show how shifts in demand and supply curves cause the equilibrium price and quantity to change in real world situations
Demand
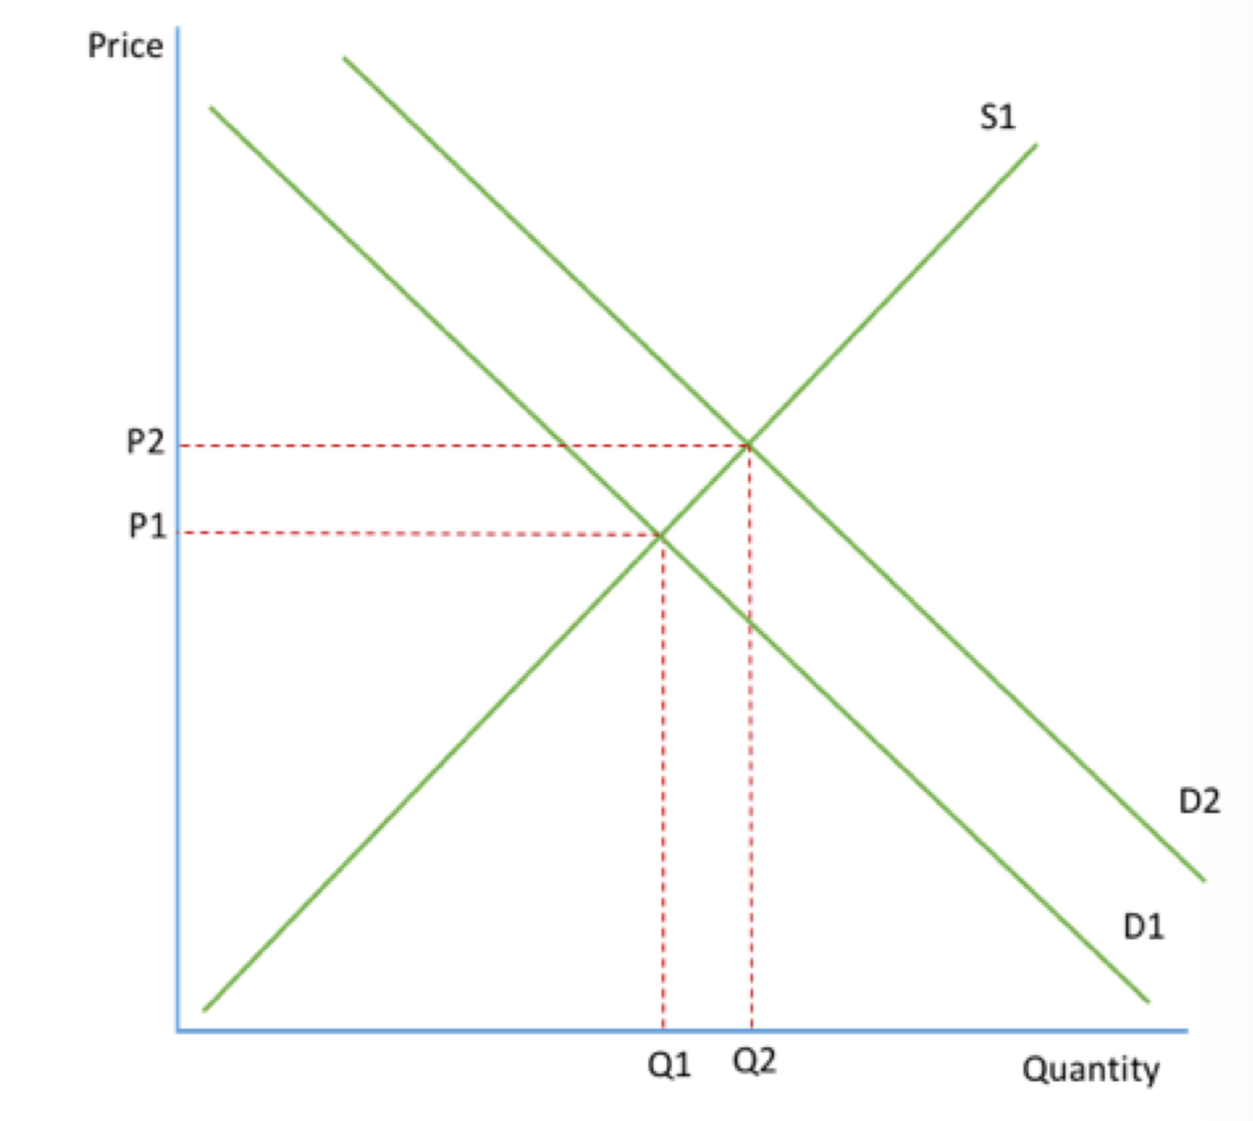
An increase in demand from D1 to D2 will lead to an increase in price from P1 to P2 and an increase in output from Q1 to Q2.
A decrease in demand would decrease price and output
Supply:
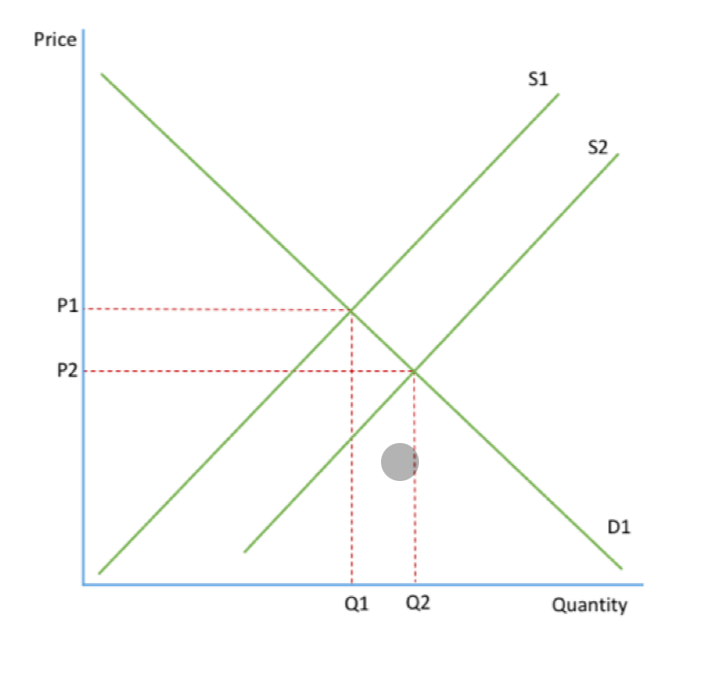
An increase in supply from S1 to S2 will increase output from Q1 to Q2 and decrease price from P1 to P2. A decrease in supply would increase price and decrease output.