Unit 9: Data
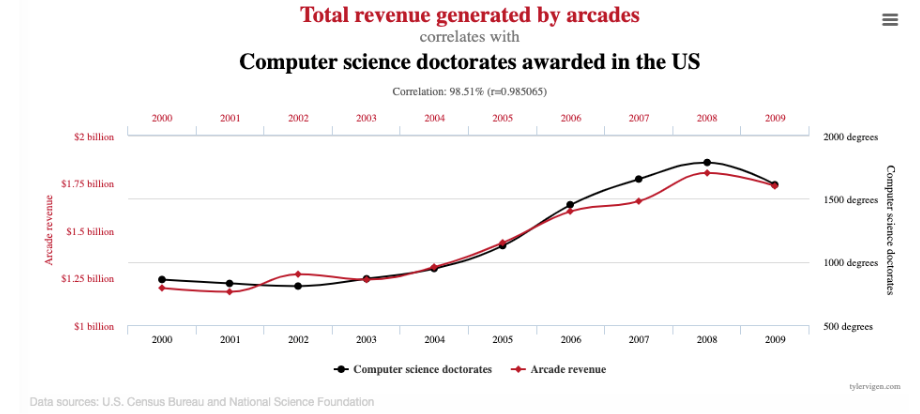
- Correlation does not equal Causation
* Correlation: similarities, patterns
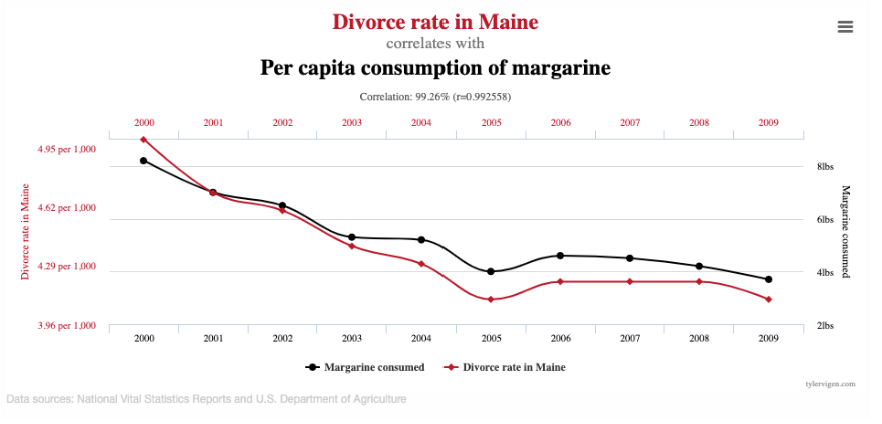
* Causation: this thing caused that thing
- Metadata: data about data
* It can be changed without impacting the primary data
* Used for finding, organizing, and managing information
* Increases effective use of data by providing extra information
* Allows data to be structured and organized - Fact: What does the data show?
- Opinion: Why might that be the case?
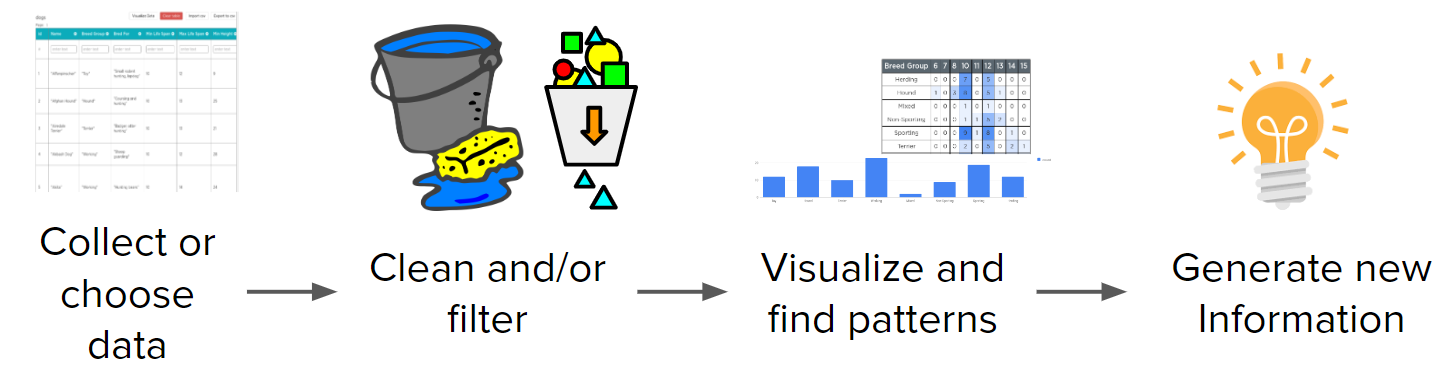
- Visualizations can help us:
* Answer questions
* Look at lots of data at once
* See patterns that are "invisible" if you just look at the table
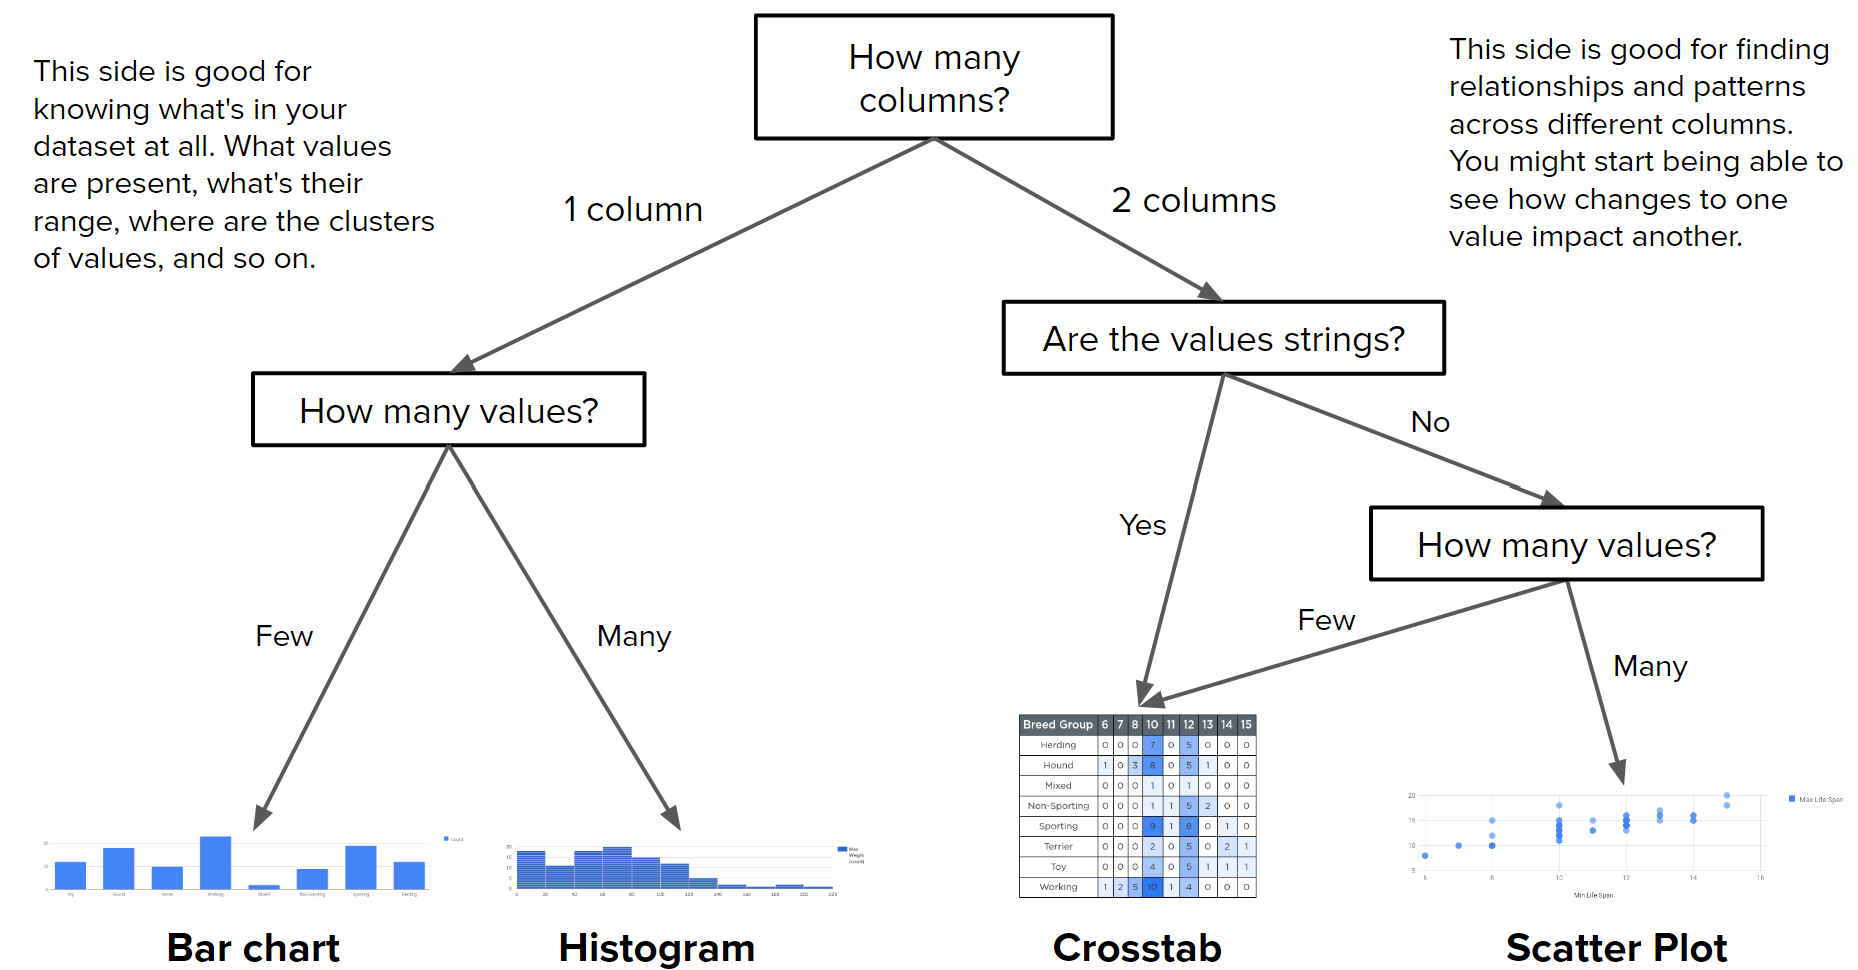
- Histograms can only be created with numeric data but can be useful when a normal bar chart may be difficult to read
- Charts and other visualizations can help both find and communicate what we've learned from data
- Bar charts and histograms are two common chart types for exploring one column of data in a table
- Cleaning Data
* Data needs to be cleaned when:
* Data is incomplete
* Data is invalid
* Multiple tables are combined into one
* “Messy” data is caused by:
* Users enter in different types of data ("two", 2)
* Users use different abbreviations to represent the same information ("February", "Feb", "Febr")
* Data may have different spellings ("color", "colour") or inconsistent capitalization ("spring", "Spring")
* Method:
* Look through the data manually
* Find and fix messy data
* Use a program to find and fix messy data
* Filtering data:
* Allows the user to look at a subset of the data - A crosstab chart counts how many times combinations of values appear
* Useful for:
* Finding the most / least common combinations of values in two columns
* Finding patterns across two columns Exploring two columns when one or both are strings.
* Not useful:
* If either column has too many values (the chart would be enormous) - Scatter: Shows combinations of values from two columns
* Useful for:
* Seeing patterns and trends between two values
* Numeric data with lots of different values
* Not useful:
* Lots of repeated values
- Open Data
* "sharing data with others so they can can analyze it"
* Open data is publicly available data shared by governments, organizations, and others
* Making data open help spread useful knowledge or creates opportunities for others to use it to solve problems - Citizen Science and Crowdsourcing
* "collecting data from others so you can analyze it"
* Crowdsourcing is the practice of obtaining input or information from a large number of people via the Internet
* Citizen science is research where some of the data collection is done by members of the public using own computing devices which leads to solving scientific problems
* Crowdsourcing offers new models for collaboration, such as connecting businesses or social causes with funding
* Both are examples of how human capabilities can be enhanced by collaboration via computing - Big data
* "Collect huge amounts of data so we can learn even more from it"
* The size of the datasets we analyzed impacts how much information can be extracted
* As a result, in business, science, and many other contexts people are working with increasingly big data sets
* When data gets too big it can no longer be processed on one computer
* Cloud computing or parallel systems are sometimes used to help process all that information
* In general scalability of your system is important to consider when working with big data
* You want your system to be able to work even as you're using more and more data - Racism - prejudice, discrimination, or antagonism directed against a person or people on the basis of their membership in a particular racial or ethnic group, typically one that is a minority or marginalized