Copy of General Biology I
✅ 01: Biology & Learning
01: Biology & Learning
Tuesday, September 2
I. Memory and Learning
→ CC types of memory
→SEQ process of memory formation and learning
→SEQ long-term potentiation
II. Workshop Organization
→ SEQ workshop components
I. Memory and Learning
A. Nervous System
Consists of circuits or neurons and supporting cells
B. Nerve Plasticity
Ability of the nervous system to be modified after birth
Brain is dynamic → can be remodeled
Most remodeling occurs at synapsis
↳junctions between neurons
Changes are activity dependant
C. Memory
anatomical/physiological event occurring synapses dependent on neuronal plasticity and activity
Short-Term Memory (STM)
Info stored for a short time → seconds to minutes
Limited capacity (-7)
Released if irrelevant (not used)
Long-Term Memory (LTM)
Activated when info needs to be retained
As far as we can tell, infinite duration/capacity
Cannot use directly → retrieved to STM
Use It or Lose It
High activity → many connections
Low activity → lose connections
Multiple active synapses → stronger response at all synapses
Memory ≠ Learning
Learning: use of knowledge/experiences (memory) to decrease likelihood of negative outcome
Aka → you do better as a result of learning
Memory: which parts of fence are electrified
Learning: never attacking the same spot twice
Goals of Workshop
Improve ability to form memories
Use memories to learn and problem solve
Develop learning skills/techniques
Know GB content
D. Long-Term Potentiation
Lasting increase in the strength of synaptic transmission - physiological changes
Facilitates memory and retrieval
Activity dependent
Learner needs to use information
Use of information is a sorting process
Use → important → retained
Not used → unimportant → discarded
Discarded = no synapses formed
(see photos)
Facilitated by:
Organization-associations aid in memory formation
Chunking - learning sets of related info rather than just one thing at a time
↳Helps w/ memory and retrieval 0 easier to recall chunksActivity - practice = learning
II. Workshop Organization
Workshop weekly Practice Questions
Graded → old exam question, exact same format
“Reality check” → not, graded, self-assessment
Exams: 3x per semester
Same question format as PDs
Exam Guide
1st level & 2nd level → outline
Outcomes → learning outcomes (potential exam questions)
Organizers → how to practice
Verified correct &
✅ 02: Foundations of Biology
02: Foundations of Biology
Thursday, September 4
I. Themes in Biology
→ CC, SEQ levels of organization
II. The Scientific method
→ SEQ process fo science
III. Basic elements of Chemistry
→ CC chemical bonds
IV. Emergent Properties of Water
→ CC properties of water
I. Themes in Biology
A. Evolution
Unifying idea of biology - all living organisms are modified descendants of common ancestors
“Nothing in biology makes sense except in the light of evolution.” - T. Dobzhansky, 1972
B. Emergent Properties
Properties the results from arrangement and interaction of parts within system
The whole is more than just the sum of its parts
Ex. the pieces of a bike can’t get you anywhere, but the whole becomes a method for transportation (emergent property)
C. Levels of Biological Organization
The Biosphere
Ecosystems
Communities
Populations
Organisms
Organs and Organ Systems
Tissues
Cells
Organelles
Molecules
II. The Scientific Method
A. Introduction to Science
Science from Latin “to know”
Method of inquiry - finding natural explanations for natural phenomena
Limited to observable and measurable structures and process
Systematic methods of investigating natural world - hot haphazard
Language of Science
Hypothesis: testable proposed explanation for observations based on available data; an educated guess; Ex: A light doesn't work because the bulb is dead.
Prediction: Expected outcome when you test hypothesis; Ex: If the bulb is dead, then the light will work when I replace it.
Theory: broad explanation with significant support, leads to new hypotheses and accurate predictions; Ex: Earth revolves around the sun.
Law: statement of what always occurs under certain circumstances; observable pattern, not explanatory - “what” not “why;” Ex: conservation of energy
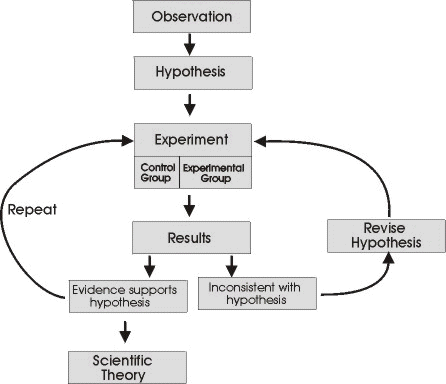
The Scientific Process
III. Basic Elements of Chemistry
Table 2.1 Elements in the Human Body
Oxygen, Carbon, Hydrogen, Oxygen → 96.3% of Body Mass
(see photos)
A. Electrons
Atoms made of protons (+), neutrons (/), electrons (-)
Electrons (e-)
Subatomic particles
-1 charge, 1 unit of negative charge
Move rapidly around atomic nucleus
Potential Energy
Energy (E) that a material possesses due to its location or structure
Can be used to do work - capacity to cause change
Once used, work has to be done to restore
Electrons and Potential Energy
e- located in distinct shells
Have potential E due to distance from nucleus
Further from nucleus → higher E
Absorb E to move to higher shell
Release E when fall to lower shell
Valance Electrons
Valence Shell - outermost shell
Valence electrons occupy valence shell
H and He - up to 2 e- in valence shell
All others - up to 8 e- in valence shell
Electrons Summary
Subatomic particles, carry a -1 charge
Surround atomic nucleus in discreet regions called shells
Contain E based on their location
Why so much on Electrons?
Bond and Reactions
Properties Depend on Atomic Structure
Element, # valence e-, # e- to fill valence shell, #covalent bonds (single, double, or triple)
(see photos)
B. Formation of Molecules
Molecule: a compound of 2 or more atoms held together by chemical bonds
Chemical formula tells:
What type of atoms
How many of each
Ex: H2O - 2 hydrogen, 1 oxygen
Emergent Properties of Compounds
Sodium (super dangerous) + Chlorine (super dangerous) = Sodium chloride (table salt)
Characteristics can differ from those of component elements
C. Chemical Bonds
Result of how atoms share electrons
“Want” (most stable with) a full valence shell
Will share, donate, or accept e- to achieve
Potential E stored in chemical bonds
Electronegativity
Measure of atom’s affinity for e-
Atoms in a molecules attract electrons to varying degrees
More electronegative → more strongly pulls e- towards itself
D. Types of Bonds and Interactions
Covalent Bond
sharing e- between atoms
Results in a full valence shell for each
Strongest type of bond (under biological conditions)
Ex: Hydrogen (H2) → H:H; H-H
Nonpolar Covalent Bonds
Same or similar electronegativity → e- shared equally
Ex: O2
Polar Covalent Bonds
Unequal electronegativity → unequal e- sharing
Causes partial (+) or (-) charges (𝜍 = partial charge)
Ionic Bonds
Highly unequal electronegativity → e- lost or gained → ion: charged atom
Like changes repel, opposites attract
Bond formed by attraction between anion (-) and cation (+)
Ex: Na & Cl
Salts
Compound formed by ionic bonds - form crystals
Dissolve in water
Van der Waals Interactions
(Relatively) short-lived, (relatively) weak interactions due to electron position and motion
Areas with partial (+) and (-) charges interact
Strong in large numbers
Includes many different interactions - London dispersion forces, hydrogen bonds
Hydrogen Bonds
Type of Van der Waals
Partial charges result when H binds to electronegative atom (e.g. O or N)
𝜍+ (on H)tends to associate with 𝜍- (on electronegative atom)
Resulting interaction is called a hydrogen bond
IV. Emergent Properties of Water
A. Hydrogen Bonds
Water is a polar molecule (due to polar covalent bonds)
→ Forms H bonds with each other
(see photos, Pearson fig 3.2)
B. Consequences of H-bonds
Cohesion: attraction between water molecules
Adhesion: attraction between water molecules and other substances
Moderates temperature - high specific heat
Expands when frozen - ice floats
“Universal” solvent - anything polar will dissolve aka hydrophilic (but not nonpolar - hydrophobic)
✅ 03: Biological Molecules
03: Biological Molecules
Tuesday, September 8
I. Biological Importance of Carbon
→ CC functional groups
II. Biological Macromolecules
→ SEQ Process fo Polymerization
→ CC Classes of Biological Molecules
I. Biological Importance of Carbon
A. Intro to Carbon
Organic compounds (C bonded to C or H)
The study of carbon compounds (the chemistry of life)
Cell ~70-90% H20, most of the rest is C-based compounds
Carbon can form 4 bonds bonds (complex molecules)
B. Hydrocarbons
Organic molecules of only C and H
Ex. Methane CH4
Nonpolar, unchanged (nonionic)
↳hydrophobic
Can contain functional groups
↳replace one or more H
C. Functional Groups
Key to molecular function
Replace H with something else
6 Key Groups
1. Hydroxyl Group (-OH)
Oxygen bound to hydrogen
Alcohols, end in -ol
Polar, hydrophilic
Ex. ethanol, alcohol in beverages
2. Carbonyl Group (=O)
C with double covalent bond to O
Polar, hydrophilic - but not all polar molecules are equal
Ex. acetone, the simplest ketone propanal, an aldehyde
3. Carboxyl Group (-COOH)
C with double bond to O and single bond OH
Can release proton (H+) → acidic (carboxylic acids)
Polar, hydrophilic, important part of amino acids
Ex. acetic acid, which gives vinegar its sour taste
Ionized form of (-COOH) found in cells
4. Amino Group (-NH2)
N bound to 2 Hs
Proton (H+) acceptor - basic
Important component of amino acids
E. glycine, an amino acid (carboxyl group)
5. Phosphate Group (-PO4H2)
O bonded to phosphorus (P), bonded to 1 O, 2 OHs
1 double bond present
Can release 1 or both H+
↳Exists ionized and nonionizedAcidic, hydrophilic, found in P and nucleic acids
E. glycerol phosphate, which takes part in many chemical reactions in cells
6. Methyl Group (-CH3)
C bonded to 3 H, all single bonds
Nonpolar, hydrophobic
In DNA, effects gene expression
Ex. 5-Methyl cytosine, a component of DNA that has been modified by addition of a methyl group
II. Biological Macromolecules
A. Macromolecules
Large molecules - thousands of atoms
Monomers: identical or similar building blocks
Polymers: produced by linking monomers
All polymers are macromolecules, not all macromolecules are polymers
Dehydration Reaction (Synthesis)
Dehydration reaction: synthesizing a polymer
Dehydration removes a water molecules, forming a new bond
Enzyme: dehydrogenase
*-ase = enzyme
Hydrolysis
Breaking down a polymer
Adds water molecule, breaking a bond
Enzyme: hydrolases
B. Carbohydrates
Made of C, H, and O
Approx. ratio of CH2O
Fuel and structural
Monosaccharides
Single sugars
Monomer of carbohydrates
Usually 3-6 carbons
Ex. glucose C6H12O6
Polysaccharides
Polymer of hundreds-thousands of monosaccharides
Connected by glycosidic linkage
Two Main Functions in Cells
1. Storage - starch, glycogen
2. Structure - cellulose, chitin
C. Lipids
Diverse, hydrophobic, NOT polymers
Do NOT dissolve in water
Dissolve in nonpolar solvents
Ex. chloroform
Three important lipid families
Fats
Phospholipids
steroids
Lipid Synthesis
Often dehydration reaction results in ester linkage
Glycerol
One of three dehydration reactions in the synthesis of a fat
Fats
Most abundant lipid-energy storage → contain 9 cal/gram carbs/proteins = 4 cal/g
Structure: glycerol + 1, 2, 3 fatty acids
Glycerol: 3 carbon alcohol 3 -OH groups
Fatty Acid: unbranched hydrocarbon, ~14 -22C carboxyl group
Phospholipid
Glycerol + 2 fatty acid phosphate group
Amphiatic: has hydrophobic and hydrophilic traits
Fatty acid “tails” + phosphate “head”
Steroids
3 6-C rings, 1 5-C ring
Differ in functional groups
Ex. cholesterol, sex hormones
D. Proteins
Monomers = amino acids
All have same basic structure
20 Amino Acids in Cellular Life
Can be:
Nonpolar: hydrocarbon side chains
Polar: hydroxyl groups
Charges: acidic or basic
Polypeptides
Many (100+) AA’s joined in linear sequence by peptide bonds
Not protein yet; requires correct shape
Effect of Protein Unfolding
Denature: loss of proteins native structure
Lose structure → lose function
Protein Functions
Basically everything: structure, signaling, enzymes, defense, transport
E. Nucleic Acids
Polymers of nucleotides
2 classes
DNA: deoxyribonucleic acid
RNA: ribonucleic acid
Store and transmit genetic information
✅ 04: Origins of Life
04: Origins of Life
I. Process of Abiogenesis
Chemical evolution hypothesis: Life from non-living
Abiotic synthesis of monomers
Formation of organic macromolecules
Formation of protocells
Origin of self-replicating molecules
A. Abiotic synthesis of monomers
First life developed from non-living organic molecules
→abiogenesis
Those molecules had to form spontaneously
→Abiotic synthesis
4 Requirements for Abiotic Synthesis
Very little free O2 in atmosphere (favors bond formation)
Source of E (Lightning, UV radiation)
Inorganic Building Blocks: (Ions, H2O, Atmosphere: CO2, CO, H2, N2, NH3, H2S, CH4)
Time (earth formed around 4.5 billion years ago. Life began around 3.5 billion years ago)
2) Oparin-Haldane hypothesis (1920’s)
Conditions of early earth favored spontaneous formation of simple organic molecules
Molecules accumulated in oceans & formed “organic soup”
Prebiotic (primoridial) soup
Test of hypothesis: Miller and Urey (1953) Apparatus, Stimulate conditions
Experiment repeated: Nucleic acid bases
All aa
Lipids, Sugars, ATP
Iron-Sulfer World Hypothesis
Hydrothermal vents
Protected
Hot H20, CO, minerals
Abiotic Synthesis Hypotheses
2 general ideas - differ in “where”
Oparin-Haldance Hypothesis: 1920s, life formed near Earth’s surface - shallow water
Iron-Sulfur Hypothesis: recent hypothesis, life formed at deep sea vents
B. Abiotic Synthesis of Organic Macromolecules
Clay/Rock surfaces
Can form on clay or rock surfaces
Metal ions (Zn2+, Fe2+) catalyze polymerization
Experimentally: Polypeptides, Polynucleotides, Vesicles
Lab
Drip AA solution onto hot rocks -> Polypeptides
C. Formation of Protocells
Vesicle: fluid-filled compartment surrounded by membrane-like structure
Spontaneously forms from lipids in water
Vesicle
Fluid filled compartments
Membrane
Form when hydrophobic molecules added to H2O
2) Montmorillonite
Soft clay form volcanic ash
Early Earth
Ions catalyze vesicles formation
Conclusion of experiment: Montmorillinite greatly increases rate of vesicle self-assembly
Protocells
Aggregates of abiotically produced organic macromolecules
Vesicle with many attributes of living cells:
Maintain internal chemical environment different from external environment
Divide in ½ when large
No mechanism of heredity
Electrical potential across surface
Absorb materials → osmotic swelling
Unique internal chemical environment
Divide if sufficiently large
BUT: No mechanism of heredity
D. Appearance of Self-Replication
In living cells…
Genetic information stored in DNA
Info from DNA is Transcribed into mRNA
Info from mRNA is Translated into protein
DNA → RNA* → Protein
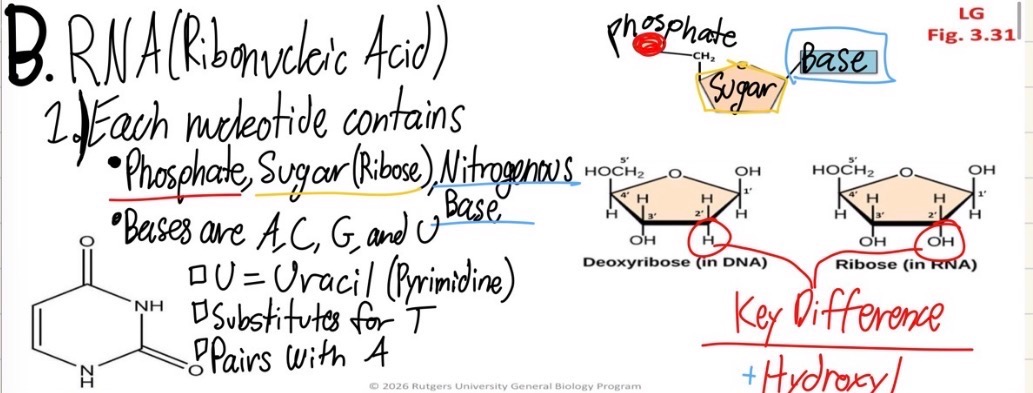
*Thought that RNA was the first nucleus acid in living things
RNA World Hypothesis
Pre-biotic earth
RNA molecules that could catalyze:
I. Synthesis of RNA -> Replicate itself
II. Peptide bond formation -> Protein synthesis
RNA with catalytic properties
Hypothesis
RNA (single stranded) was 1st genetic material
Evolved into DNA (double stranded)
ADVANTAGE OF DNA: More stable & better at storing genetic information
The first replicating systems used RNA to store AND copy genetic information
Limited role for polypeptides
DNA incorporated later
Ribozymes
RNA molecules with enzymatic properties
E.g. Cleave RNA; Catalyze RNA polymerization
(see photos)
II. History of Life
Divisions
Rocks and Fossils
A. The First Cells
Prokaryotes - no nucleus, or organelles
EX: Stromatolites
Fossils of microorganisms
Layers of bacteria & sediment
Earliest direct evidence of life
Anaerobic - did not use oxygen
Heterotrophs (1st) - obtain organic molecules from the environment for Energy
Fermentation
Anaerobic (without oxygen) breakdown
2) photosynthetic autotrophs (2nd)
Energy from sunlight to produce food from simple inorganic molecules
Cyanobacteria
- O2 revolution (Rapid increase of atmospheric O2 around 2.4 billion years ago)
3) Aerobes (3rd)
Aerobic respiration (Uses O2)
Lots of energy from food -> ATP (they can make way more ATP)
Major advantage over fermentation
B. Autotrophy
Use E from sunlight - made own food (big advantage)
1st released S2
Later, released O2 by splitting H2O (cyanobacteria)
Oxygen Apocalypse
~2.5 bya
Rise in atmospheric O2 due to oxygenic photosynthesis
Killed off most organisms
Banded iron formation
Then Aerobes Took Over
Deal with O2 via aerobic respiration
Bonus: higher ATP yield
Most life today is aerobic
C. Origin of eukaryotes
Appeared ~2 billion years ago
More complex
Cells with membrane-bound nucleus and organelles
Endosymbiotic theory - How Eukaryotes arose from prokaryotes
The Endosymbiotic theory
Primary Endosymbiosis
A prokaryote was engulfed
Endosimbiosis -> A mutual and obligate relationship between host and endosymbiont
4) Multicellular eukaryotes
1.7 Billion years ago: Microscopic
600: Million years ago: Large, Soft bodied, diverse
535-525 Million years ago: Cambrian explosion. Rapid evolution of animals
500 Million years ago: Colonization of land. Fungi, Plants, & land animals
TREE OF LIFE VISUAL
III. Chemistry and Biology
Memory
Biological Molecules
✅ 05: Cell Structure
Cellular Characteristics & Diversity
Cells
Smallest unit that carries out all activities associated with life
Order
E processing
Regulation/Homeostasis
Growth & development
Reproduction
Response to stimuli
Types of organisms
| b. Multicellular |
|---|
3. All cells have a common ancestor (Tree of life)
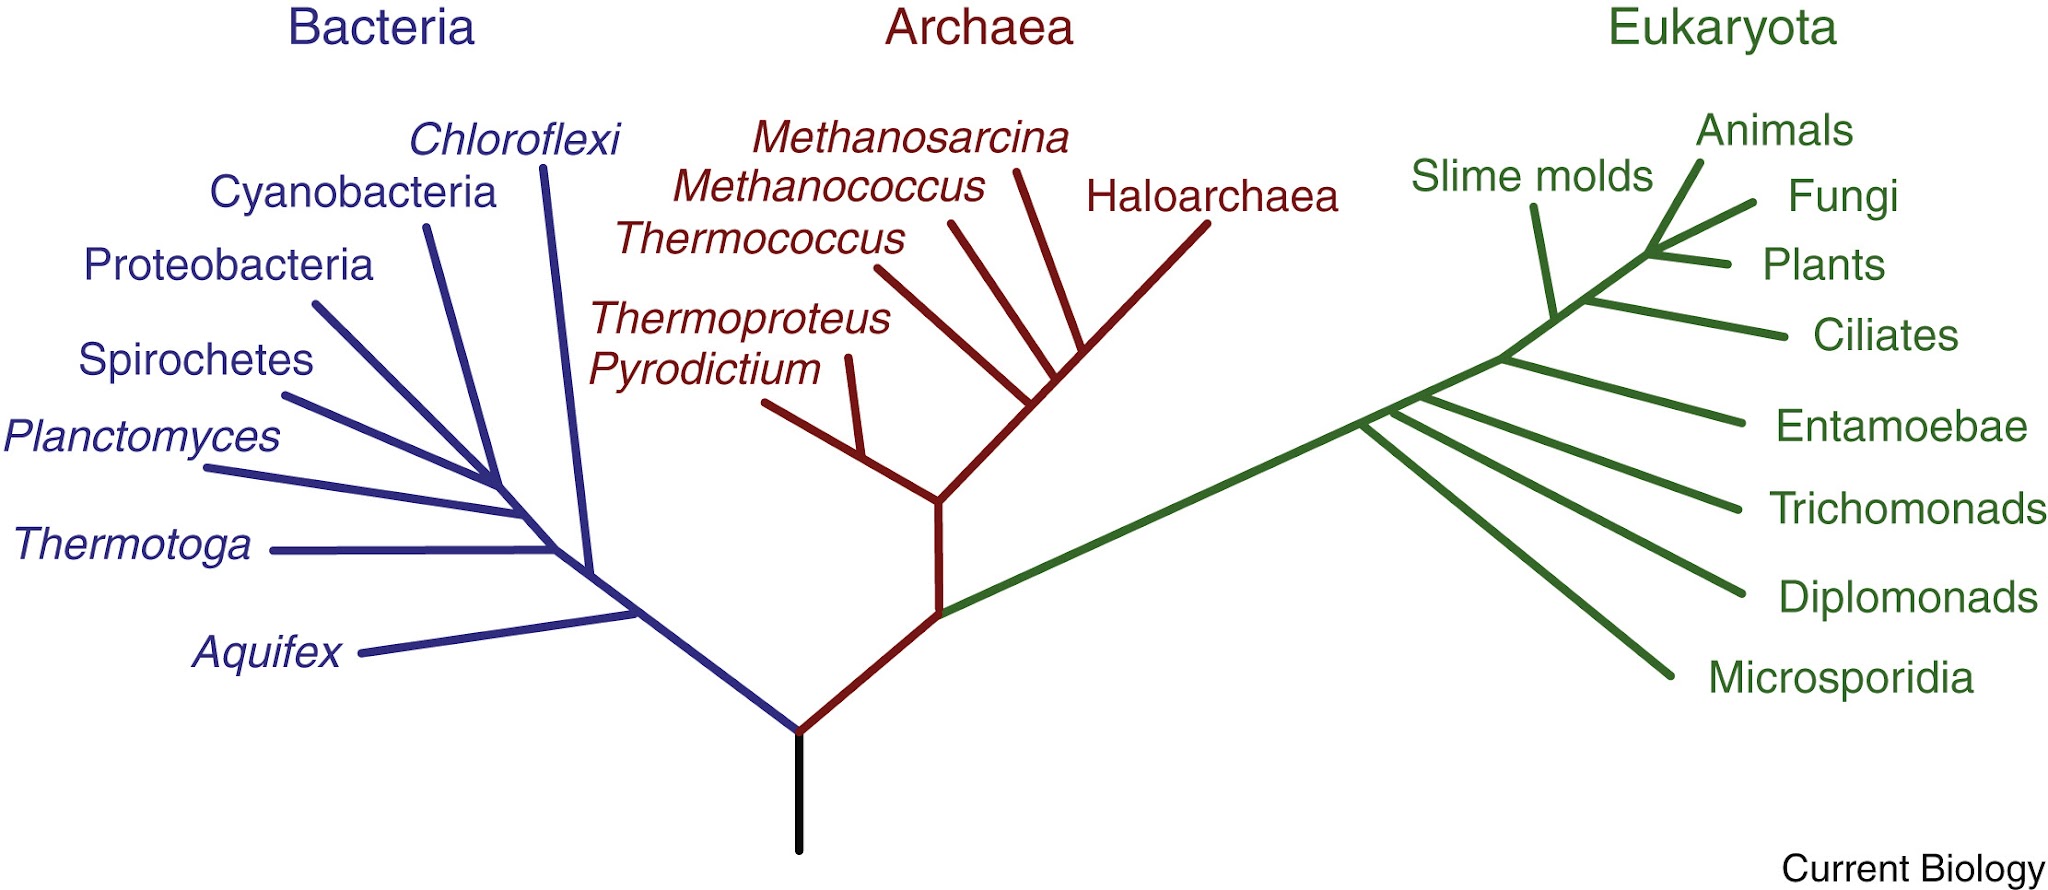
LUCA = Last universal common ancestor
3 Domains
Bacteria
Archea
Eukarya
Prokaryotes (prok) = Domains, Bacteria, & Archaea
Eukaryotes (euk) = Domain Eukaryote
4. Evolution of prok and euk
Cell Size
Prok = 1 - 10 um
Euk = 10 - 100 um
Cell size is limited by SA: vol
PM
Boundary
Everything must cross
SA: vol
Determines how efficiently cell can exchange materials with env
-> Maximum SA:vol
1 length box | 5 length box | 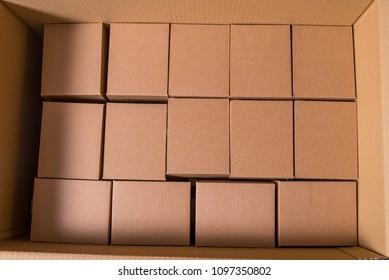 | |
|---|---|---|---|
Total surface area | 6 | 150 | 750 |
Total volume | 1 | 125 | 125 |
SA: vol | 6 | 1.2 | 6 |
Significance |
PROK |
NO GOOD |
EUK |
B. Prokaryotes
Single-celled
1st appeared around 3.5 bya
4. Generalized structure of a prokaryotic cell
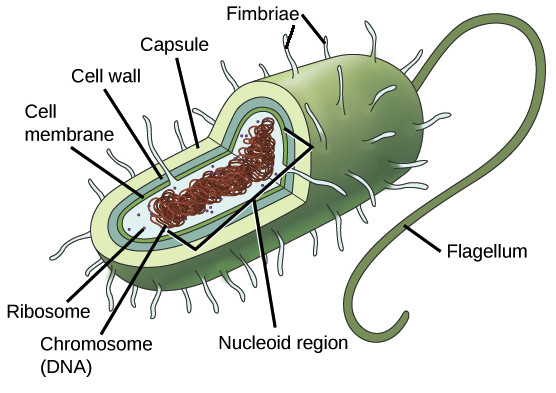
Nucleoid region:
Chromosomes: ds Ribosomes: Protein synthesis Plasma (cell) membrane (PM) encloses cell, interaction w/ env Cell wall: rigid Capsule: OUter coating Pilo: Attachment structure Flagellum: Locomotion |
|---|
Lack nucleus Lack Membrane-bounded organelles |
C. Eukaryotes
Single- & multi-celled
1st appeared around 1.8 bya
Domain eukarya
4.Generalized structure of Eukaryotic cell
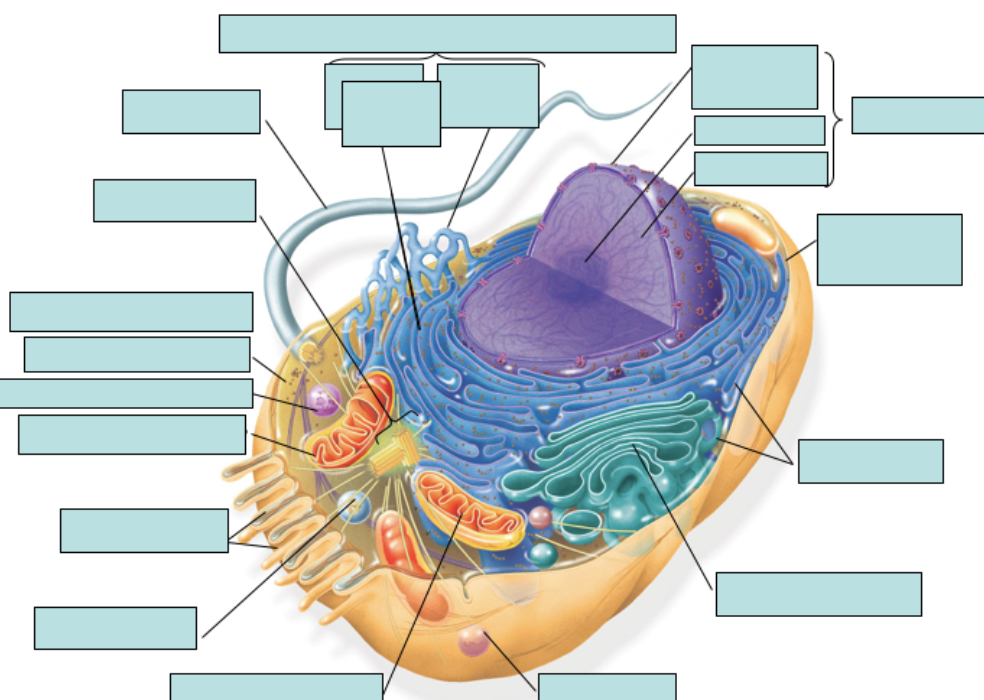
Compartments Specialized activities
|
|---|
II. Components of Eukaryotic Cells
Endomembrane System
Membrane = Lipid bilayer
Closed Compartments (organelles)
Interact with each other through:
Direct physical continuity or vesicles (Lumen, Budding, Fusion)
Plasma membrane (PM)
Encloses cell contents
Selectively permeable
Regulates passage
2. Nucleus
DNA (genetic material)
Nuclear envelope
2 concentric membranes
Nuclear pores
Nucleolus
RNA & proteins
No membrane
Synthesizes ribosomes
3. Endoplasmic reticulum (ER)
ER membrane continuous with the outer membrane of the nuclear envelope
ER lumen (internal space)
Single internal compartment
Rough ER (RER)
Ribosomes attached to outer surface
Polypeptides made of ribosomes -> Through translocon (=pore) into RER lumen -> Folded & modified -> Transport vesicle (w/proteins) buds off RER membrane -> Vesicle inserted into target membrane
Smooth ER (SER)
No ribosomes
Continuous w/RER
Primary of lipid synthesis
Glycogen breakdown -> Regulates blood glucose
Detoxifying enzymes
- Add -OH groups -> More soluble
- Ex: Alcohol and drug abuse
- Liver cells produce more SER
- Increased rate of drug breakdown
- Increased tolerance
4. Golgi apparatus
Stacks of membranous sacs (cisternae)
Each has own lumen
Protein modification
Each stack has
1. cis face
Closest to nucleus/ER
Receives transport vesicles from RER
2. Medial cisternae
Vesicles move through
Modification
3. Trans face
Closest to PM
Transport vesicles (exit and & transported)
5. Lysosomes
Sacs of hydrolytic enzymes
Ex: Phagocytosis
6. Vacuoles
Large vesicles
Variety of functions depending on the cell
Ex: Storage, H20 balance
B. Ribosomes
No membrane
- not organelles
Produced by nucleolus
Exit nucleus through nuclear pores -> Enter cytoplasm
2 types
Free in cytoplasm
Bound to RER
Protein synthesis
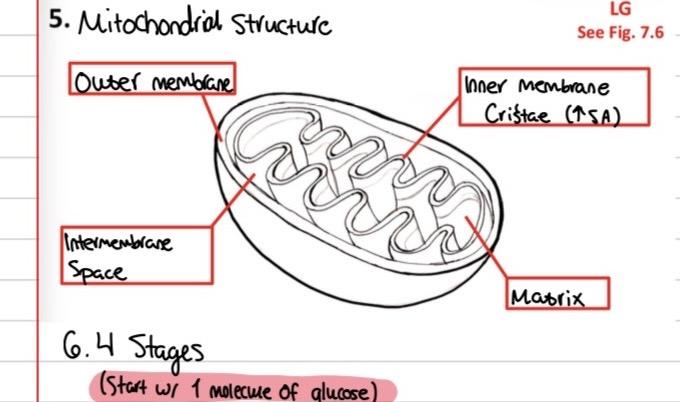
C. Mitochondria and chloroplasts
Mitochondria
All euk
Aerobic respiration
Chloroplasts
Only photosynthetic euk (plants and algae)
✅ 06: Membranes and Transport
Membrane Structure
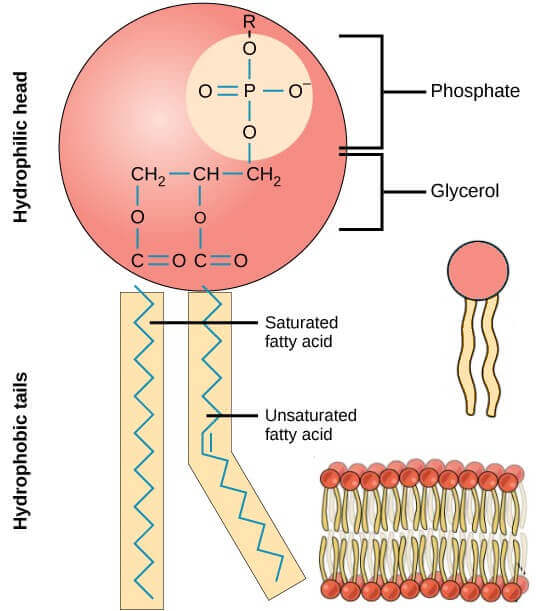
Components
Phospholipids
Structure
Amphipathic
Cylindrial
Bilayers
2. Proteins
a. Peripheral
Bound to surface
Hydrophilic
b. Integral
c. Proteins determine most main functions
Intercellular joining
Cell-cell recognition
Signal transduction
MISSING
MISSING
3. Carbohydrates
Glycoprotein
Glycolipid
B. Fluid-Mosaic Model
Fluid
Phospholipids move laterally in 1 layer
Factors that affect fluidity
Temperature
Fatty acid chain length
Various lengths = more fluid
Degree of fatty acid saturation
Saturated tails pack together -> less fluid
Unsaturated tails prevent packing -> more fluid
Cholesteral
At lower temps
- > Prevents solidification
- At higher temps
- > Prevents too much fluidity
2. Mosaic - > Proteins form patterns
a. Some proteins stay in place by:
- Extracellular matrix
b. Some proteins move laterally within one layer
Membrane Transport
Passive transport
No metabolic E
E from concentration ([]) gradient
Diffusion
-> Tendency for substances to spread out into an available space
-> Net movement is down [] gradient (from high to low)
-> Continues until dynamic equilibrium is reached (no net charge)
Simply diffusion across a permeable membrane
Movement of particles from high to low []
No transport protein
Osmosis
Simple diffusion of water of H20 across a membrane
Background
Solvent: Dissolves other substances
Solute: Dissolved substance
H2O moves across membrane, solutes do not
Tonicity: Ability of solution to cause a cell to gain or loose H20
-> Comparison of 2 solutions
Isotonic = Same [solute] = Same [H2O]
Hypertonic = Higher [solute] = Lower [H2O]
Hypotonic = Lower [solute] = Higher [H2O]
Water moves from high [H2O] to low [H2O]
Equalizes solute concentration on both sides of the membrane
Direction of osmosis (H2O moves across membrane, solutes do not)
Review of simple diffusion & osmosis
Some materials cross
Gases: O2, CO2, N2
Small hydrocarbons (hydrophobic)
H2O (hydrophilic, but small & uncharged)
- Many cannot
Large Molecules: Too big
Polar molecules (ex: glucose): hydrophilic
Ions (H+): Charged, hydrophilic
Problem: Lipid bilayers too selective
Solution: Transport proteins
3. Facilitated diffusion
Transmembrane protein
Passive
- No metabolic E
- E from gradient []
Channel proteins do not change shape
Do not change shape
Hydrophobic AA
Solutes pass through
Ex: aquaporins
Carrier proteins
Bind to specific solute -> Protein changes shape -> "carries" substance through
B. Active transport
Cell supplies metabolic E (ATP)
Transport protein required
Transmembrane, changes shape
Works against [] gradient
-> Materials can be stockpiled
Ex: Sodium-potassium pump
Bulk Transport
Large molecules
Many molecules
Vesicles
Requires E input from the cell (ATP)
Exoxytosis
Vesicle fuses w/ PM & contents released
Wastes & secretory products
Adds lipids to PM -> Growth of PM
B. Endocytosis
Materials enter by vesicles from PM
Phagocytosis
Cell ingests large particle -> Food vacuole -> Fuses with lysosome
Pinocytosis
Fluid & dissolved materials -> vesicle -> contents transfer to cytoplasm
Draw and explain Figure 5.7
07: Metabolism
Metabolism & Energy
Energy flow through ecosystems.
Light E -> Photosynthesis -> Concerted into chemical energy resulting in oxygen produced
Then cellular respiration, transforms organic molecules into ATP (another form of chemical energy) -> some ATP turns into heat energy -> some heat energy leaves the molecule
(Cellular respiration can go back to photosynthesis in a chart)
Metabolism
Sum of all chemical reactions & E transformations in organism
Emergent property of life
Arises from orderly interaction between molecules
2 types of metabolic reactions
Anabolic = Synthetic
Simple -> Complex
Require E
Catabolic = Degradative
Complex -> Simple
Release E
4. Regulated Homeostasis
B. Energy (E)
Intro
Ability to do work
2 forms
i. Potential = Stored
ii. Kinetic = Motion
Laws of Thermodynamics
i. E cannot be created or destroyed
ii. E can be converted from one form to another
E transformations are not 100% efficient
-> Lost as heat
Cannot perform work
Disperses into env
Every energy transformation increases entropy (disorder)
Low entropy = Ordered
High entropy = Disordered
2. Energy & Life
Ultimate source of energy for most organisms?
Radiant E from the sun
Direct source of E for heterotrophs
Food (Low entropy = Unstable E)
Cellular work
Mechanical
Transport
Chemical
Free E = G (Gibbs)
E from reaction that is available to do work
Delta G = Change in system before and after reaction
3. Chemical reactions in cells
Exergonic (“E outward”)
i. Reactants have more potential E than products
E released
R -> P + E
ii. G in initial state > G in final state
Delta G is negative # (Loss of free energy)
iii. Spontaneous
Goes from higher to lower free E
Energetically favorable
Does not equal Instantaneous
iv. Catabolic reactions
Endergonic reactions (“E inward”)
i. Reactants have less potential energy than products
Input of E required
R + E -> P
ii. G in initial state < G in final state
Delta G is positive # (Gain of free energy)
iii. Not spontaneous
iv. Anabolic reactions
C. ATP (adenosine triphosphate)
High E compound
Structure
Adenine = nitrogenous base
Ribose = 5C sugar
3 phosphate groups (Pi)
Phosphate bonds (covalent)
store lots of potential E
2. Function
Terminal Pi removed by hydrolysis reactions
= Exergonic
Pi transferred to substrate
= E for endergonic reaction
E for endergonic reactions is from couples reactions
Enzymes
Activation Energy (EsubA)
Chemical reactions involve breaking and forming bonds
E is needed to start a reaction
-> Barrier that determines reaction rate
- Even exergonic —
B Function
Biological catalysts
Speed up rate of reactions by lowering EsubA
Are not used up
Proteins, -ase
Act on specific substrate
EX: Sucrase splits Sucrose
Induced fit model
Globular proteins
Clefts/grooves
Active site
Induced fit
Substrate binds
-> changed shape of enzyme
-> strain breaks bonds
Enzymes often work in “teams”
Metabolic pathway
Organized set of chemical reactions
Series of defined steps
Each step catalyzed by different enzyme
Results in specific product
Redox reactions
Transfer of e-
Oxidation (“acted upon by oxygen”)
Loss of e- (s)
Reduction
Gain of e- (s)
Positive charge reduced
OILRIG= Oxidation is loss, reduction is gain
E- cannot exist in free state in cells
Must have both reactions -> Redox
Significance of e- transfer
-> Transfers R to an acceptor molecule
B. Movement of hydrogen atoms
C. Electron carriers
Compounds that function as e- shuttles
Easily reduced (accepted e-) or oxidized (lost e-)
Reduced forms have higher potential energy
NAD
NAD+ = Oxidized form
NADH = Reduced form (has accepted 2 e- and 1 H+)
NADP
NADP+ = Oxidized form
NADPH = Reduced form
FAD
FAD+ = Oxidized form
FADH2 = Reduced form
Redox summery
Metabolism involves moving e-
Redox reactions are couples reactions that involve the gain and loss of e-
E-acceptor compounds like NAD+ store and use E during metabolism
08: Photosynthesis
All life needs
Source of energy
Source of carbon
Introduction
Nutritional mods
Chemoheterotroph
E source = organic compound
C source - organic compounds
Consumers (feed on other organisms)
Glucose
Photoautotroph
E source = light
C source - CO2 (Inorganic)
Producer (can produce organic compounds)
Photosynthesis
Light energy + inorganic carbon source -> Chemical energy (organic)
B. Light
Properties
Waves
Photon
Small particle of E
E inversely proportional to wavelength
Shorter wavelength = more E/photon
Longer wavelength = less E/photon
2. Effect of photon on electron
Electron in ground state -> electron absorbs light energy -> electron energized (unstable)
-> electron returns to ground state
OR
-> electron leaves and is captured by acceptor (photosynthesis)
Oxidized (lost an electron, + charge) Reduced (gained electron, - charge)
Light and electrons are NOT the same thing
II. Structures
Plant organization
Leaves: Main site of photosynthesis -> Mesophyll cell -> about 30 structures that are chloroplasts: - Photosynthesis organelle - Eukaryotes (endosymbiosis)
Chloroplasts
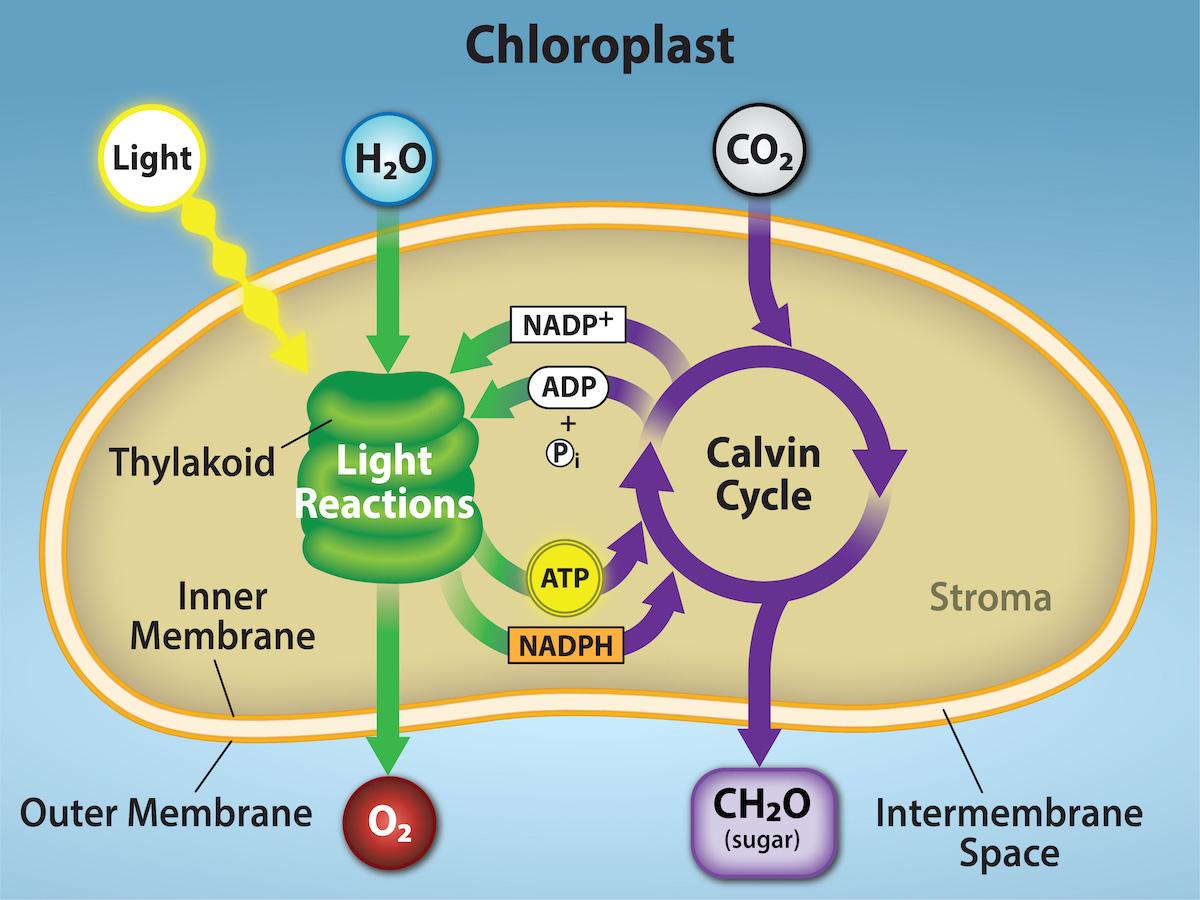
Labeling
Outer membrane
Intermembrane space
Inner membrane
Thylakoid
Thylakoid space
Granum (stack of thylakoids)
Stroma (fluid)
Photosynthetic pigments
Pigment
Absorbs visible light
Photosynthetic
Capture light E
Embedded in thylakoid membranes
Chlorophyll
Structure
Head: Absorbs light E
Tail: Embedded in membrane
Ex: chlorophyll a
III. Process
Overview
Parts
Light dependent reactions (photo)
In thylakoid membrane
Calvin cycle (synthesis)
Light dependent
In stroma
2. Overall reactions (Redox)
Reduction = Gain of H
Oxidation = Loss of H
Endergonic
B. Light dependent reactions
Convert light energy into chemical energy (ATP and NADPH)
Photosystems
In thylakoid membranes
Photosynthetic pigments
Capture light energy
PS I & PS II
Key points
Electron flow (redox reactions)
ATP & NADPH synthesis
2. Linear electron flow and synthesis of ATP and NADPH
PS II captures light E
Chlorophyll electron is excited
Electron transferred to ETC (electron transport chain)
Energy from electron pumps H+ across membrane and into space
Facilitated diffusion of H+ provides E for ATP synthesis
PS I captures light E
Chlorophyll electron is excited
Electron transferred to ETC
NADP+ + H+ + electron (from ETC) —NADP+ reductase—> NADPH
PS II ETC transfers electrons to PS I+
PS II+ is extremely strong oxidizing agent -> Oxidizes H20 & takes electron
C. Calvin cycle
Synthesis of carbs from CO2
Does not require light directly
Require NADPH & ATP
Occurs in stroma (enzymes)
Phases
C fixation
RuBP + CO2 (inorganic) –Rubisco→ PGA (organic)
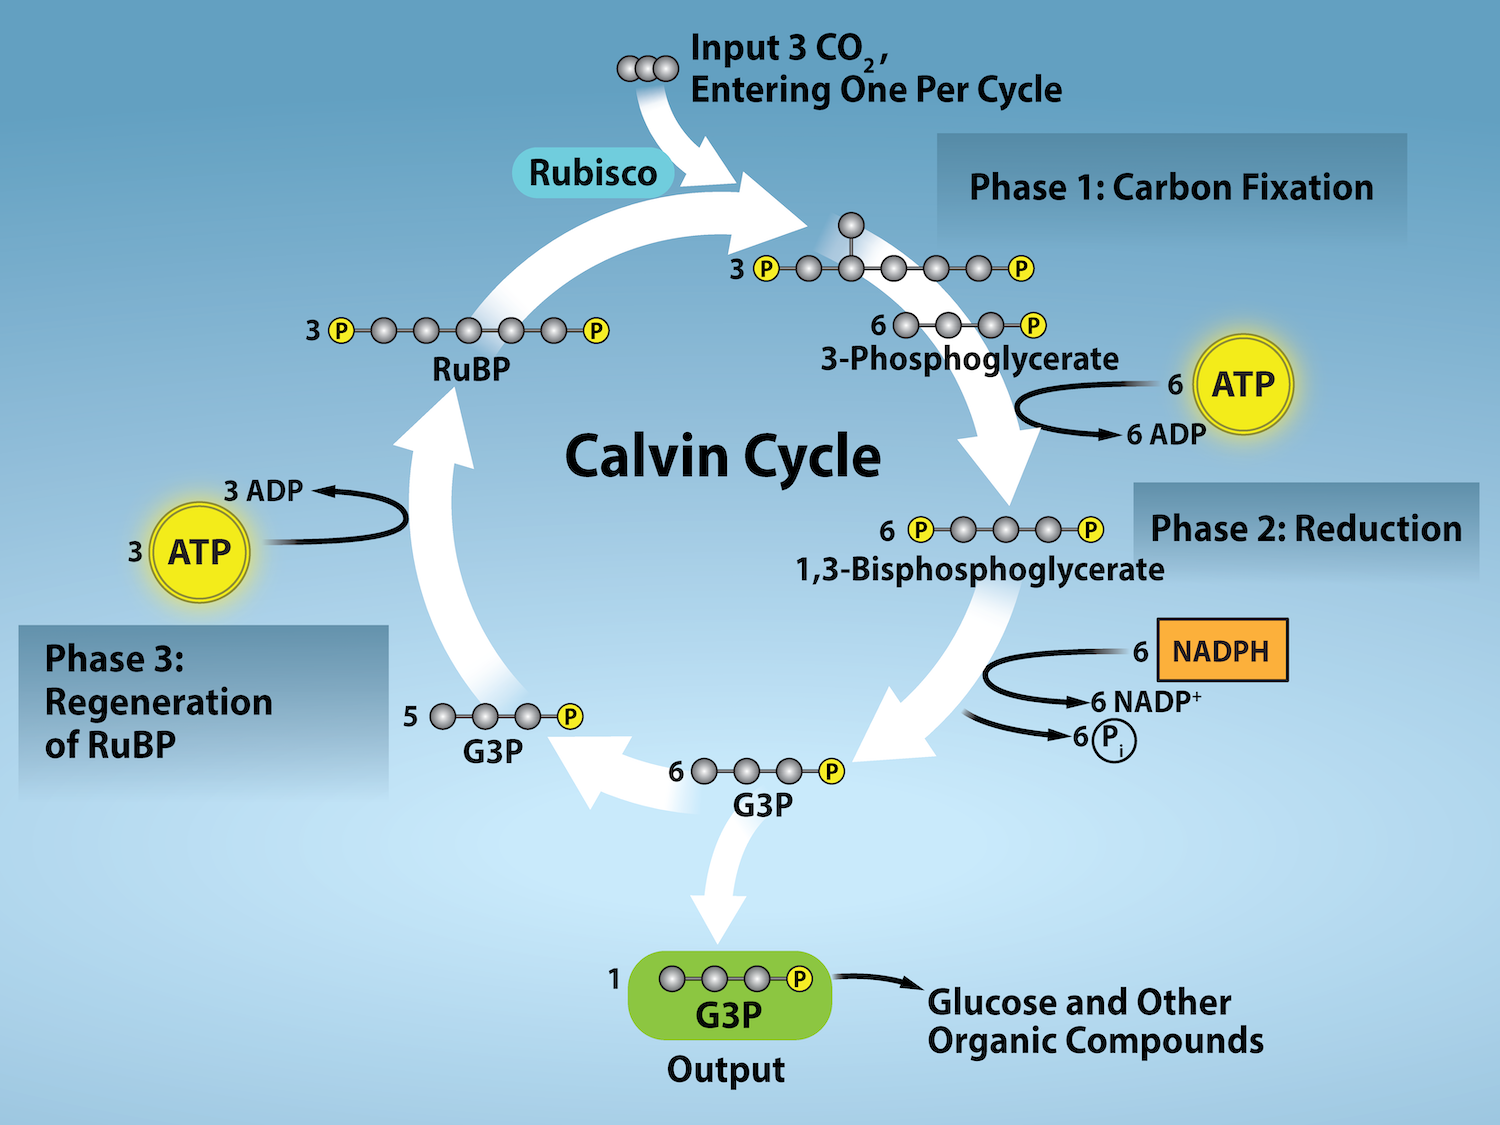
Reduction
Synthesis of organic compounds
ATP required
NADPH required
Regeneration
ATP required
RuBP regenerated
09: Cellular Respiration
Cellular Respiration
I. Introduction to cellular respiration
A. Overview
1. Food: Source of E & C
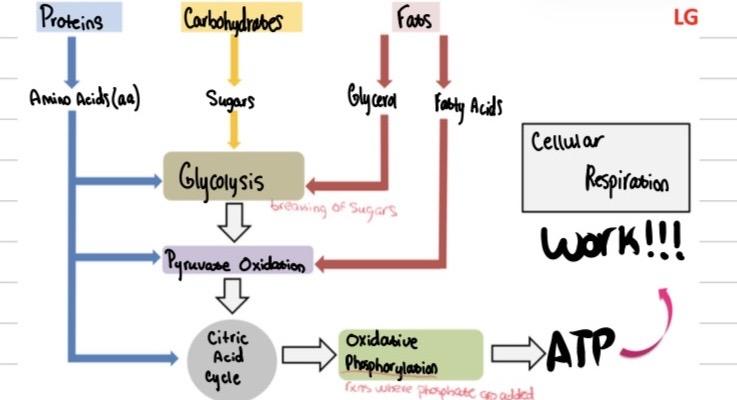
2. Cellular Respiration
Chem E in food → Chem E in ATP
All cells: Prok & Euks
Aerobic (O₂) or anaerobic (no O₂)
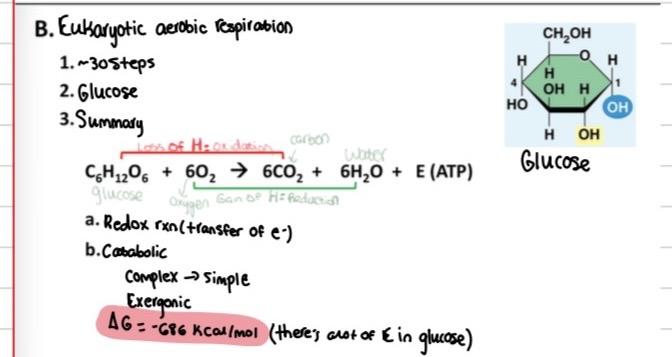
4. Key types of reactions
a. Redox
Transfer of e⁻-
b. Dehydrogenation
Catalyzed by a Dehydrogenase
H atoms move from a substrate to an acceptor
= Transfer of e⁻-
c. Substrate-level phosphorylation (SLP)
Transfer of Pi from a substrate to ADP
Produces ATP
d. Decarboxylation
CO₂ removed (diffuses out)
II. 4 Stages of aerobic cellular respiration
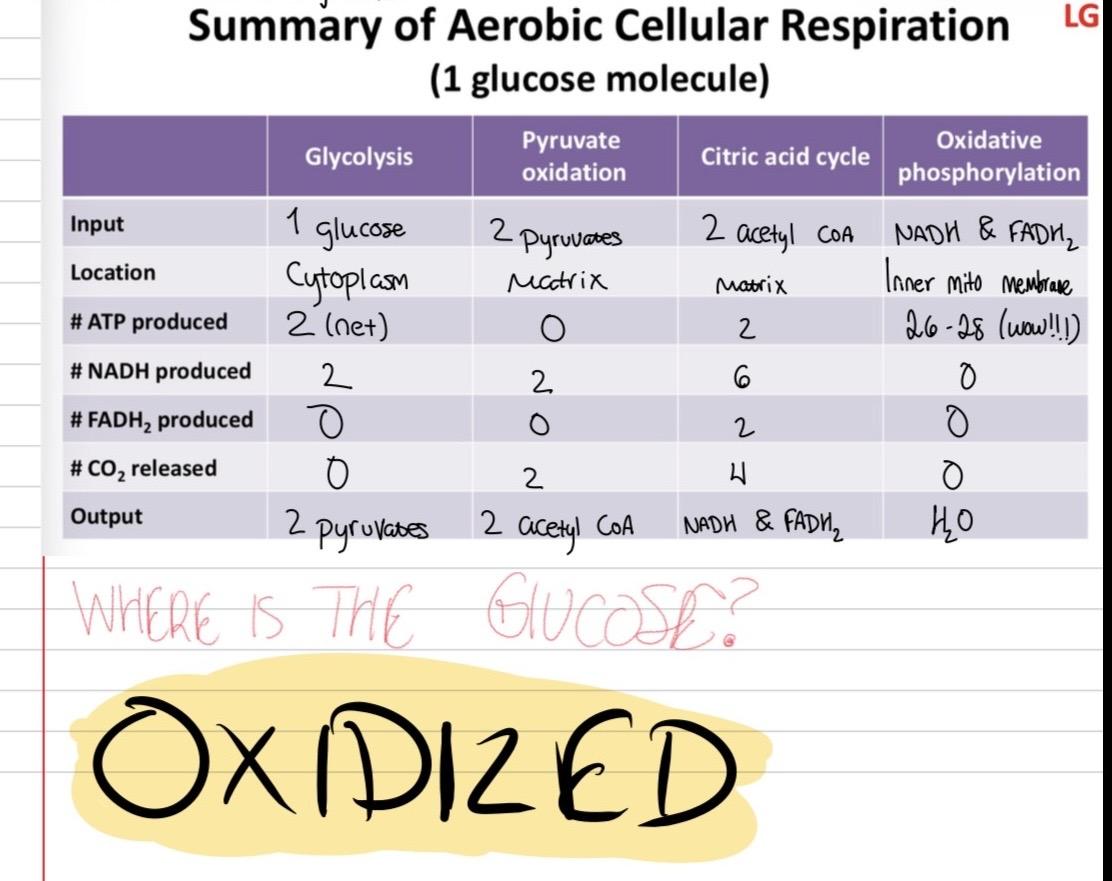
A. Glycolysis
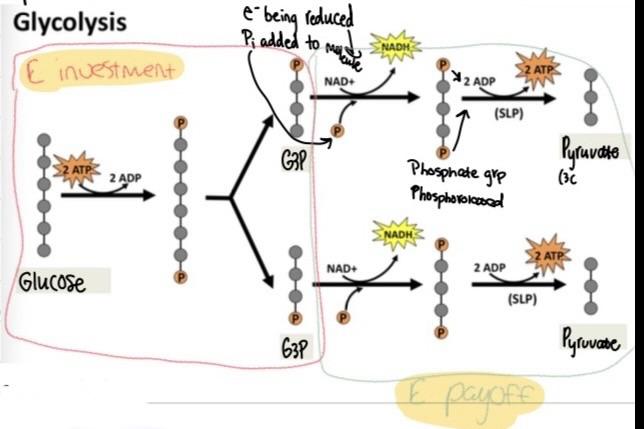
Glucose enters cell via GLUT1
Carrier protein
Facilitated diffusion
Occurs in cytoplasm
2 phases
a. E investment phase
Starts with: Glucose (6C)
Requires: 2 ATP
Ends with: 2 molecules of G3P (each is 3C)
Endergonic
b. E payoff phase
Starts w/: 2 × 63P
Yields: 4 ATP
Ends w/: 2 × pyruvate
Exergonic
|
|---|
B. Pyruvate Oxidation
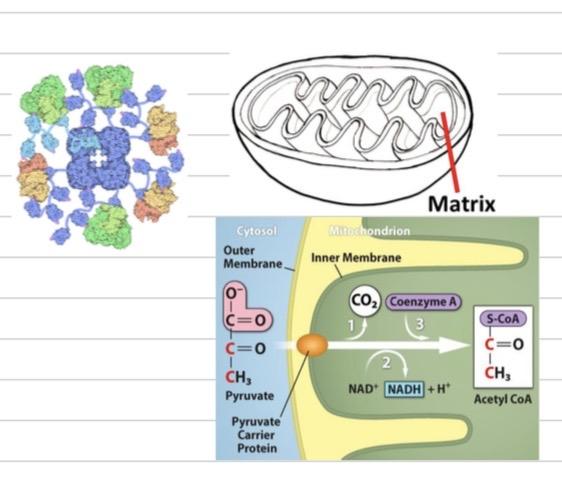
Pyruvate
Enters matrix
Pyruvate dehydrogenase complex
72 polypeptide chains (quaternary structure)
Catalyzes 3 reactions
Steps
a. Decarboxylation
2C compound produced
b. Dehydrogenation
2C compound oxidized
NAD⁺ reduced to NADH
Acetyl group produced
c. Coenzyme A
Transferred to acetyl group
Acetyl CoA produced
Reminder: For every 1 glucose, there are 2 pyruvates
C. Citric Acid Cycle
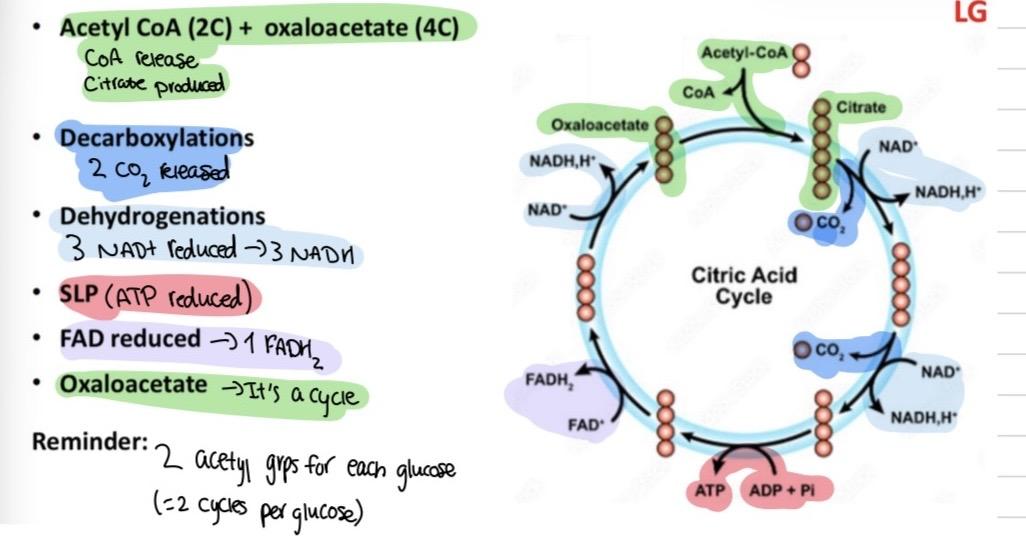
D. Oxidative phosphorylation
1. Electron Transport Chain (ETC)
a. Series of e-⁻ carriers
Embedded in inner mem
b. Series of redox reactions
Each carrier reduced & then oxidized
c. Overall: Transfer e⁻ from NADH & FADH₂ to O₂
2. Chemiosmosis
a. Diffusion of H⁺
b. ATP Synthase
Transmembrane channel
H⁺ diffusion causes rotation (E)
Oxidative phosphorylation (synthesis of ATP by chemiosmosis)
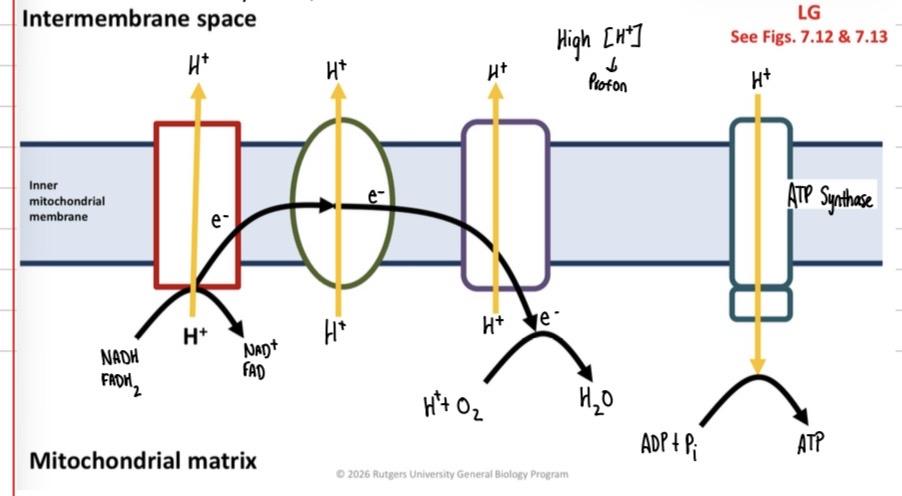
Aerobic Cellular Respiration
O₂ reduced
= Terminal e-⁻ acceptor (TEA)
H₂O produced
If O₂ not available:
→ ETC stops
→ All steps of aerobic resp stop
→ No ATP
→ DEATH
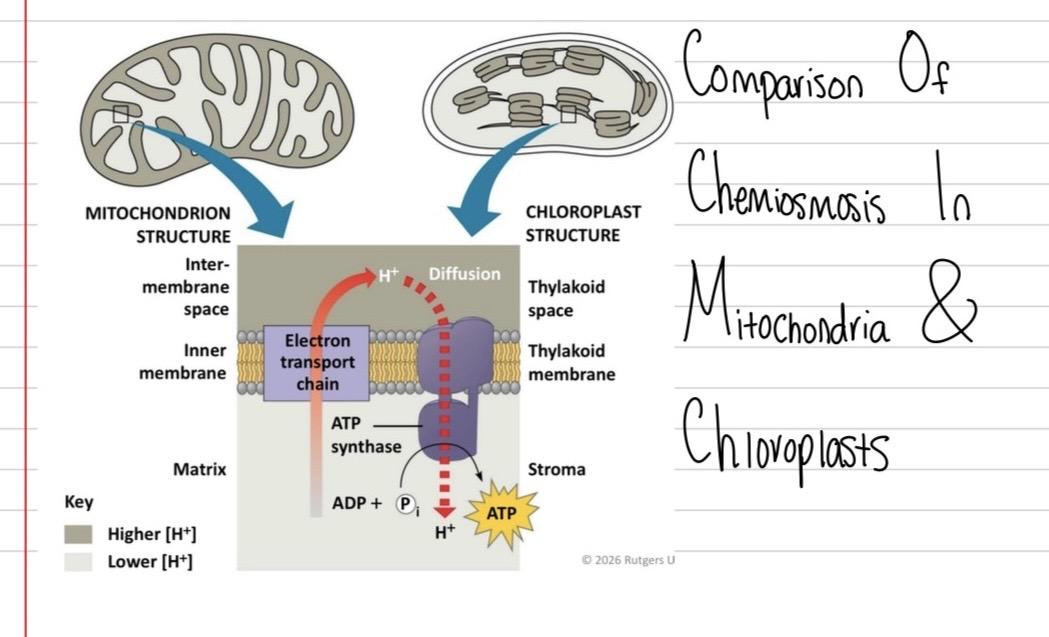
III. Photosynthesis and Respiration
A. Similarities
Double-membrane
ETC & H⁺ gradient
Chemiosmosis & ATP synthase
B. Major Differences
1. Mitochondria
Source of e⁻ is organic molecules (food)
Chemical E in food → Chemical E in ATP
2. Chloroplasts
Source of e-⁻ is water
Light E → Chemical E in ATP
🔴 EXAM 1 (lectures 1-9)
10: Cell Cycle
Genetic material
Introduction
Cell theory
Cell is basic unit of life
All life consists of 1 or more cells
All cells come from other cells
Functions of cell division
Prokaryotic and unicellular eukaryotic cells
-> New organism
Multicellular eukaryotic cells
Growth and development
Tissue renewal and repair
Both distribute identical genetic material into daughter cells
Eukaryotic
Nucleus
Several, linear chromosomes
B. Chromosome
DNA molecule + protein
Gene
Informational units
Code for all proteins
100s or 1000s / chromosome
Each at specific locus
Humans have around 20,000 genes
3. Chromatin
Uncondensed chromosome
Most of time during cell cycle
Coils up and condolences during cell division
4. Chromatid
Highly condensed chromosome
Unique shape and size
Centromere: constricted region where spindles attach
Chromatid (1 chromosome) duplicates, and creates 2 sister chromatids (1 chromosome) held together by one centromere
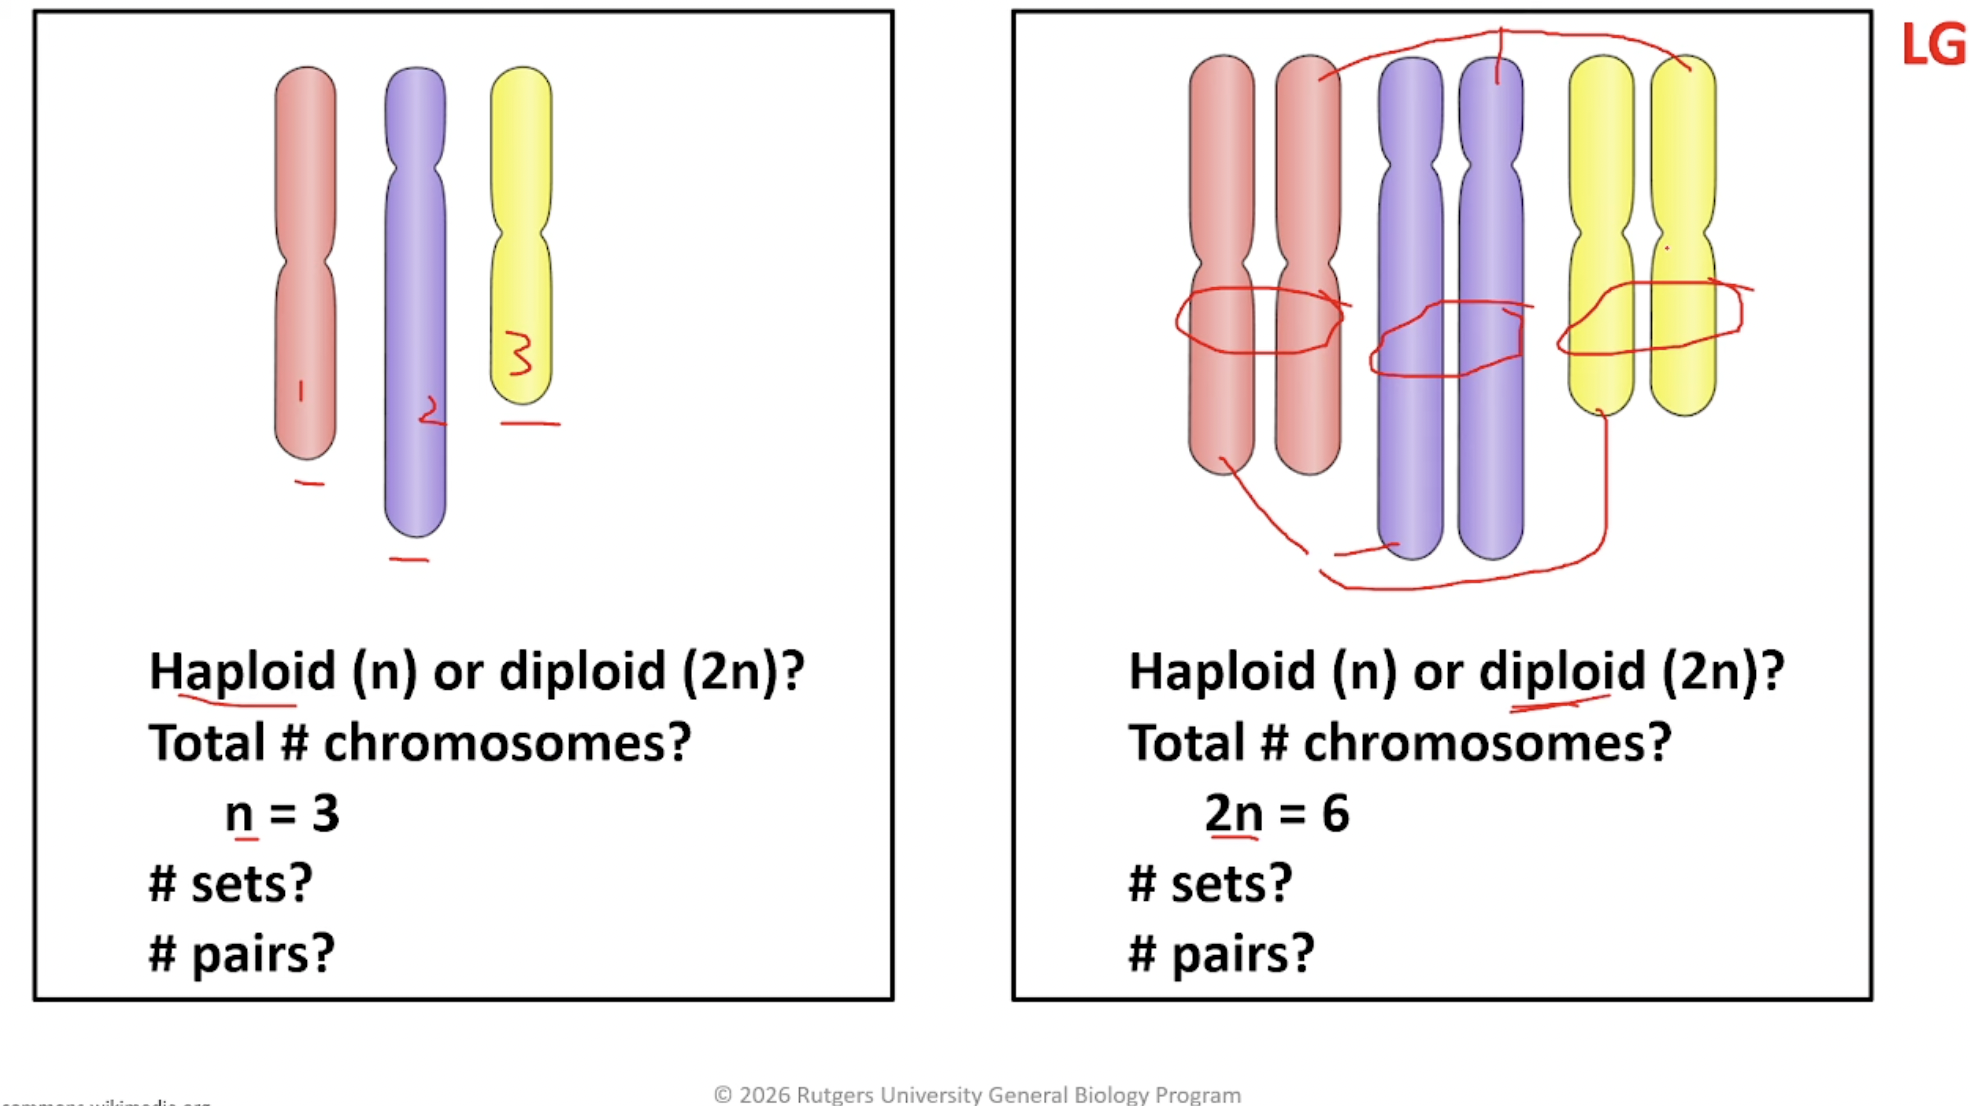
C. Ploidy
The # of sets of chromosomes in a cell
Haploid = n
One set of chromosomes
= one copy of each chromosome
Gametes
= reproductive cells
= sex cells
One set of chromosomes
2. Diploid = 2n
Two sets of chromosomes
= 2 copies of each chromosome
Somatic cells
= body cells
1 copy from mom, 1 copy from dad
Homologous chromosomes
The 2 copies in a pair
Homomorphic
Humans
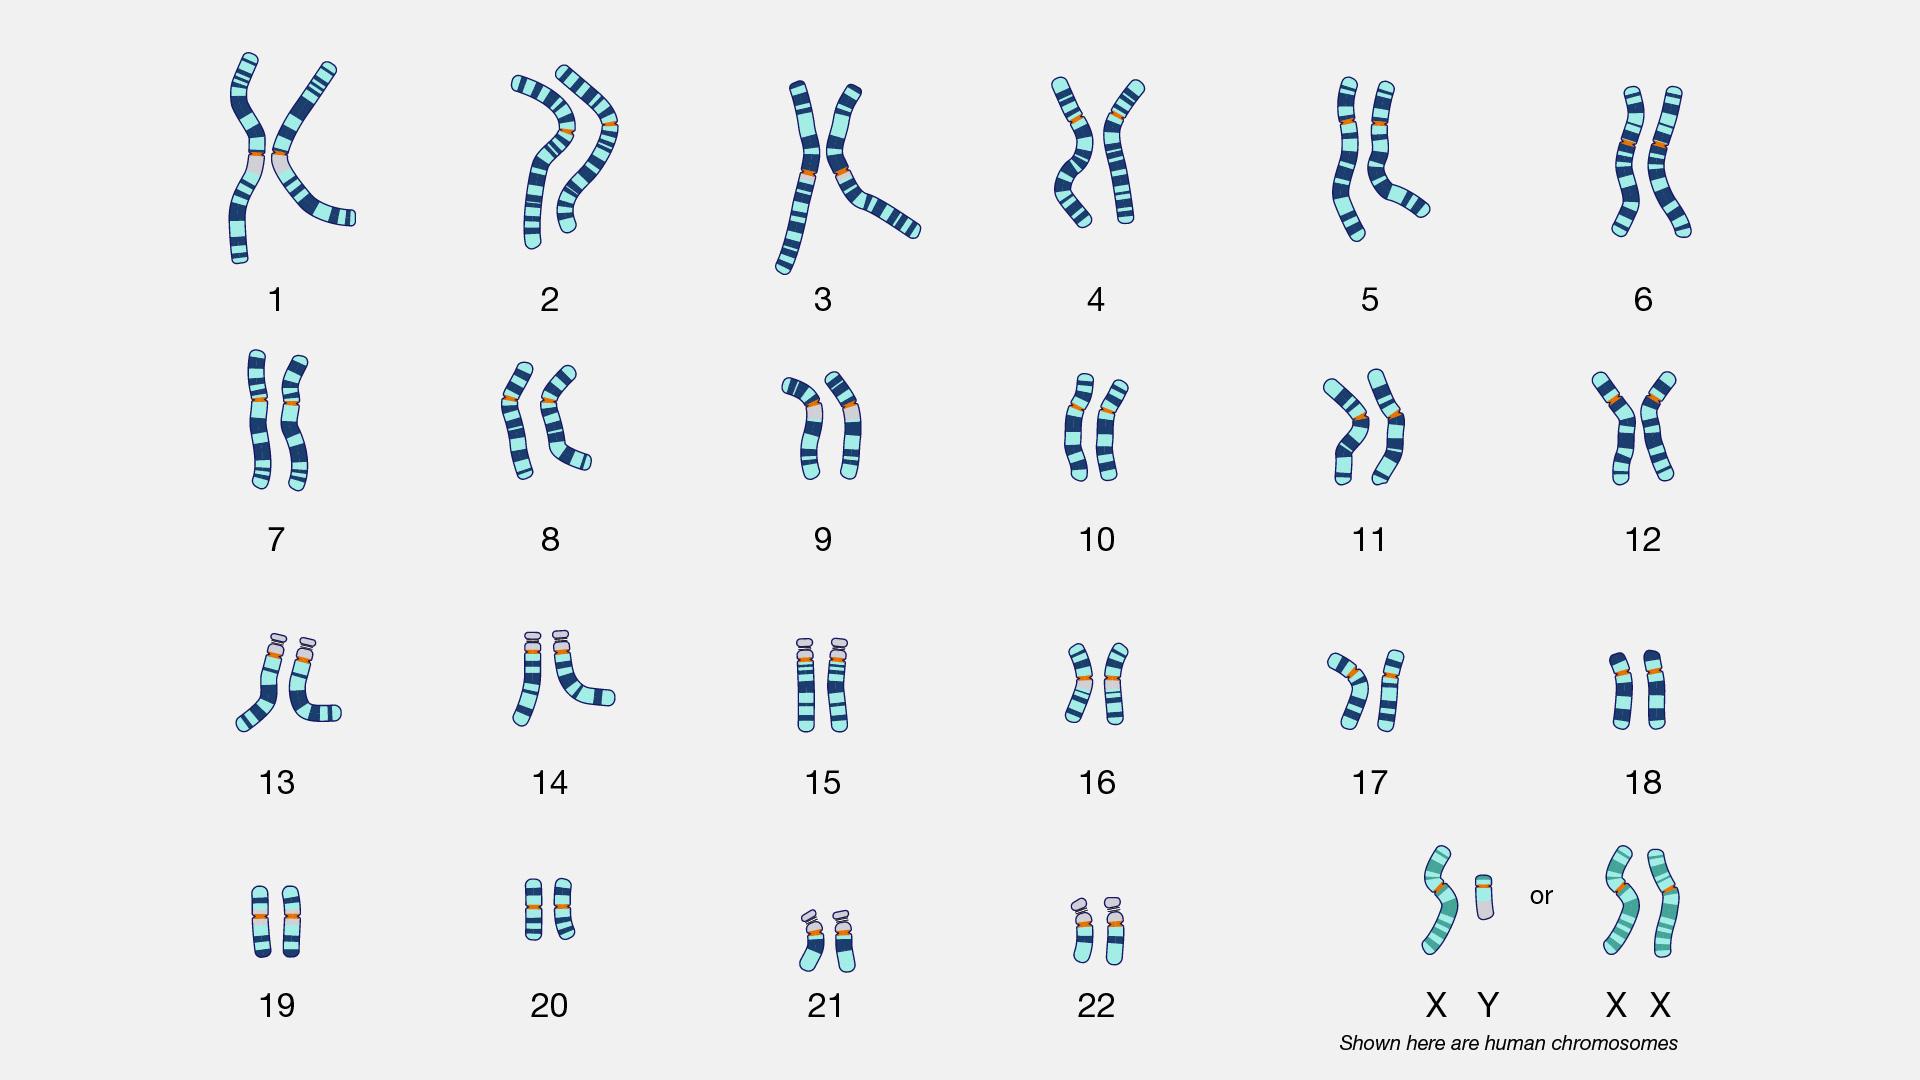
2n = 46
23 pairs
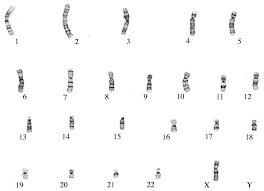
Human karyotype
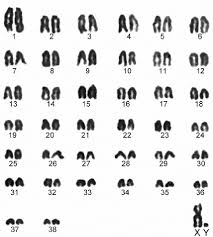
Ex: Dogs
2n = 78
38 pairs
Haploid and diploid cells undergo mitosis
II. Phases of the cell cycle
An ordered series of events in the life of a cell
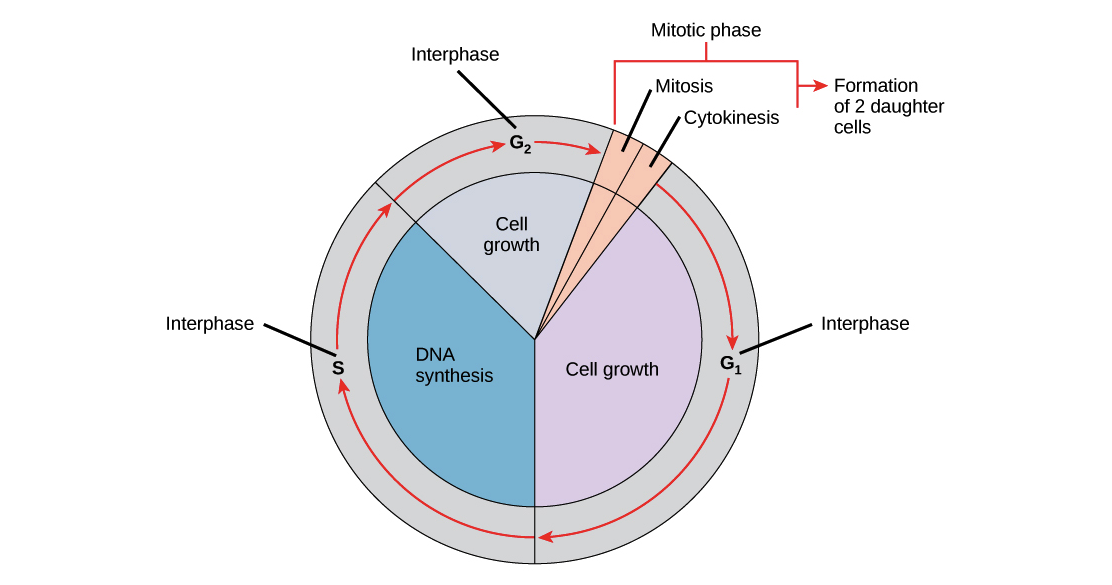
Generation time (T)
One complete revolution
Around 8-20 hours
Events of interphase
Introduction
Around 90% of cycle
Time between division
Not resting
Chromatin
2. 3 stages of interphase
G1
Metabolic activity
Growth, development, & normal function
Prep for S phase
S phase
1. S = synthesis (replication)
- DNA and chromosomal proteins
- Still in form of chromatin
- Ploidy has not changed
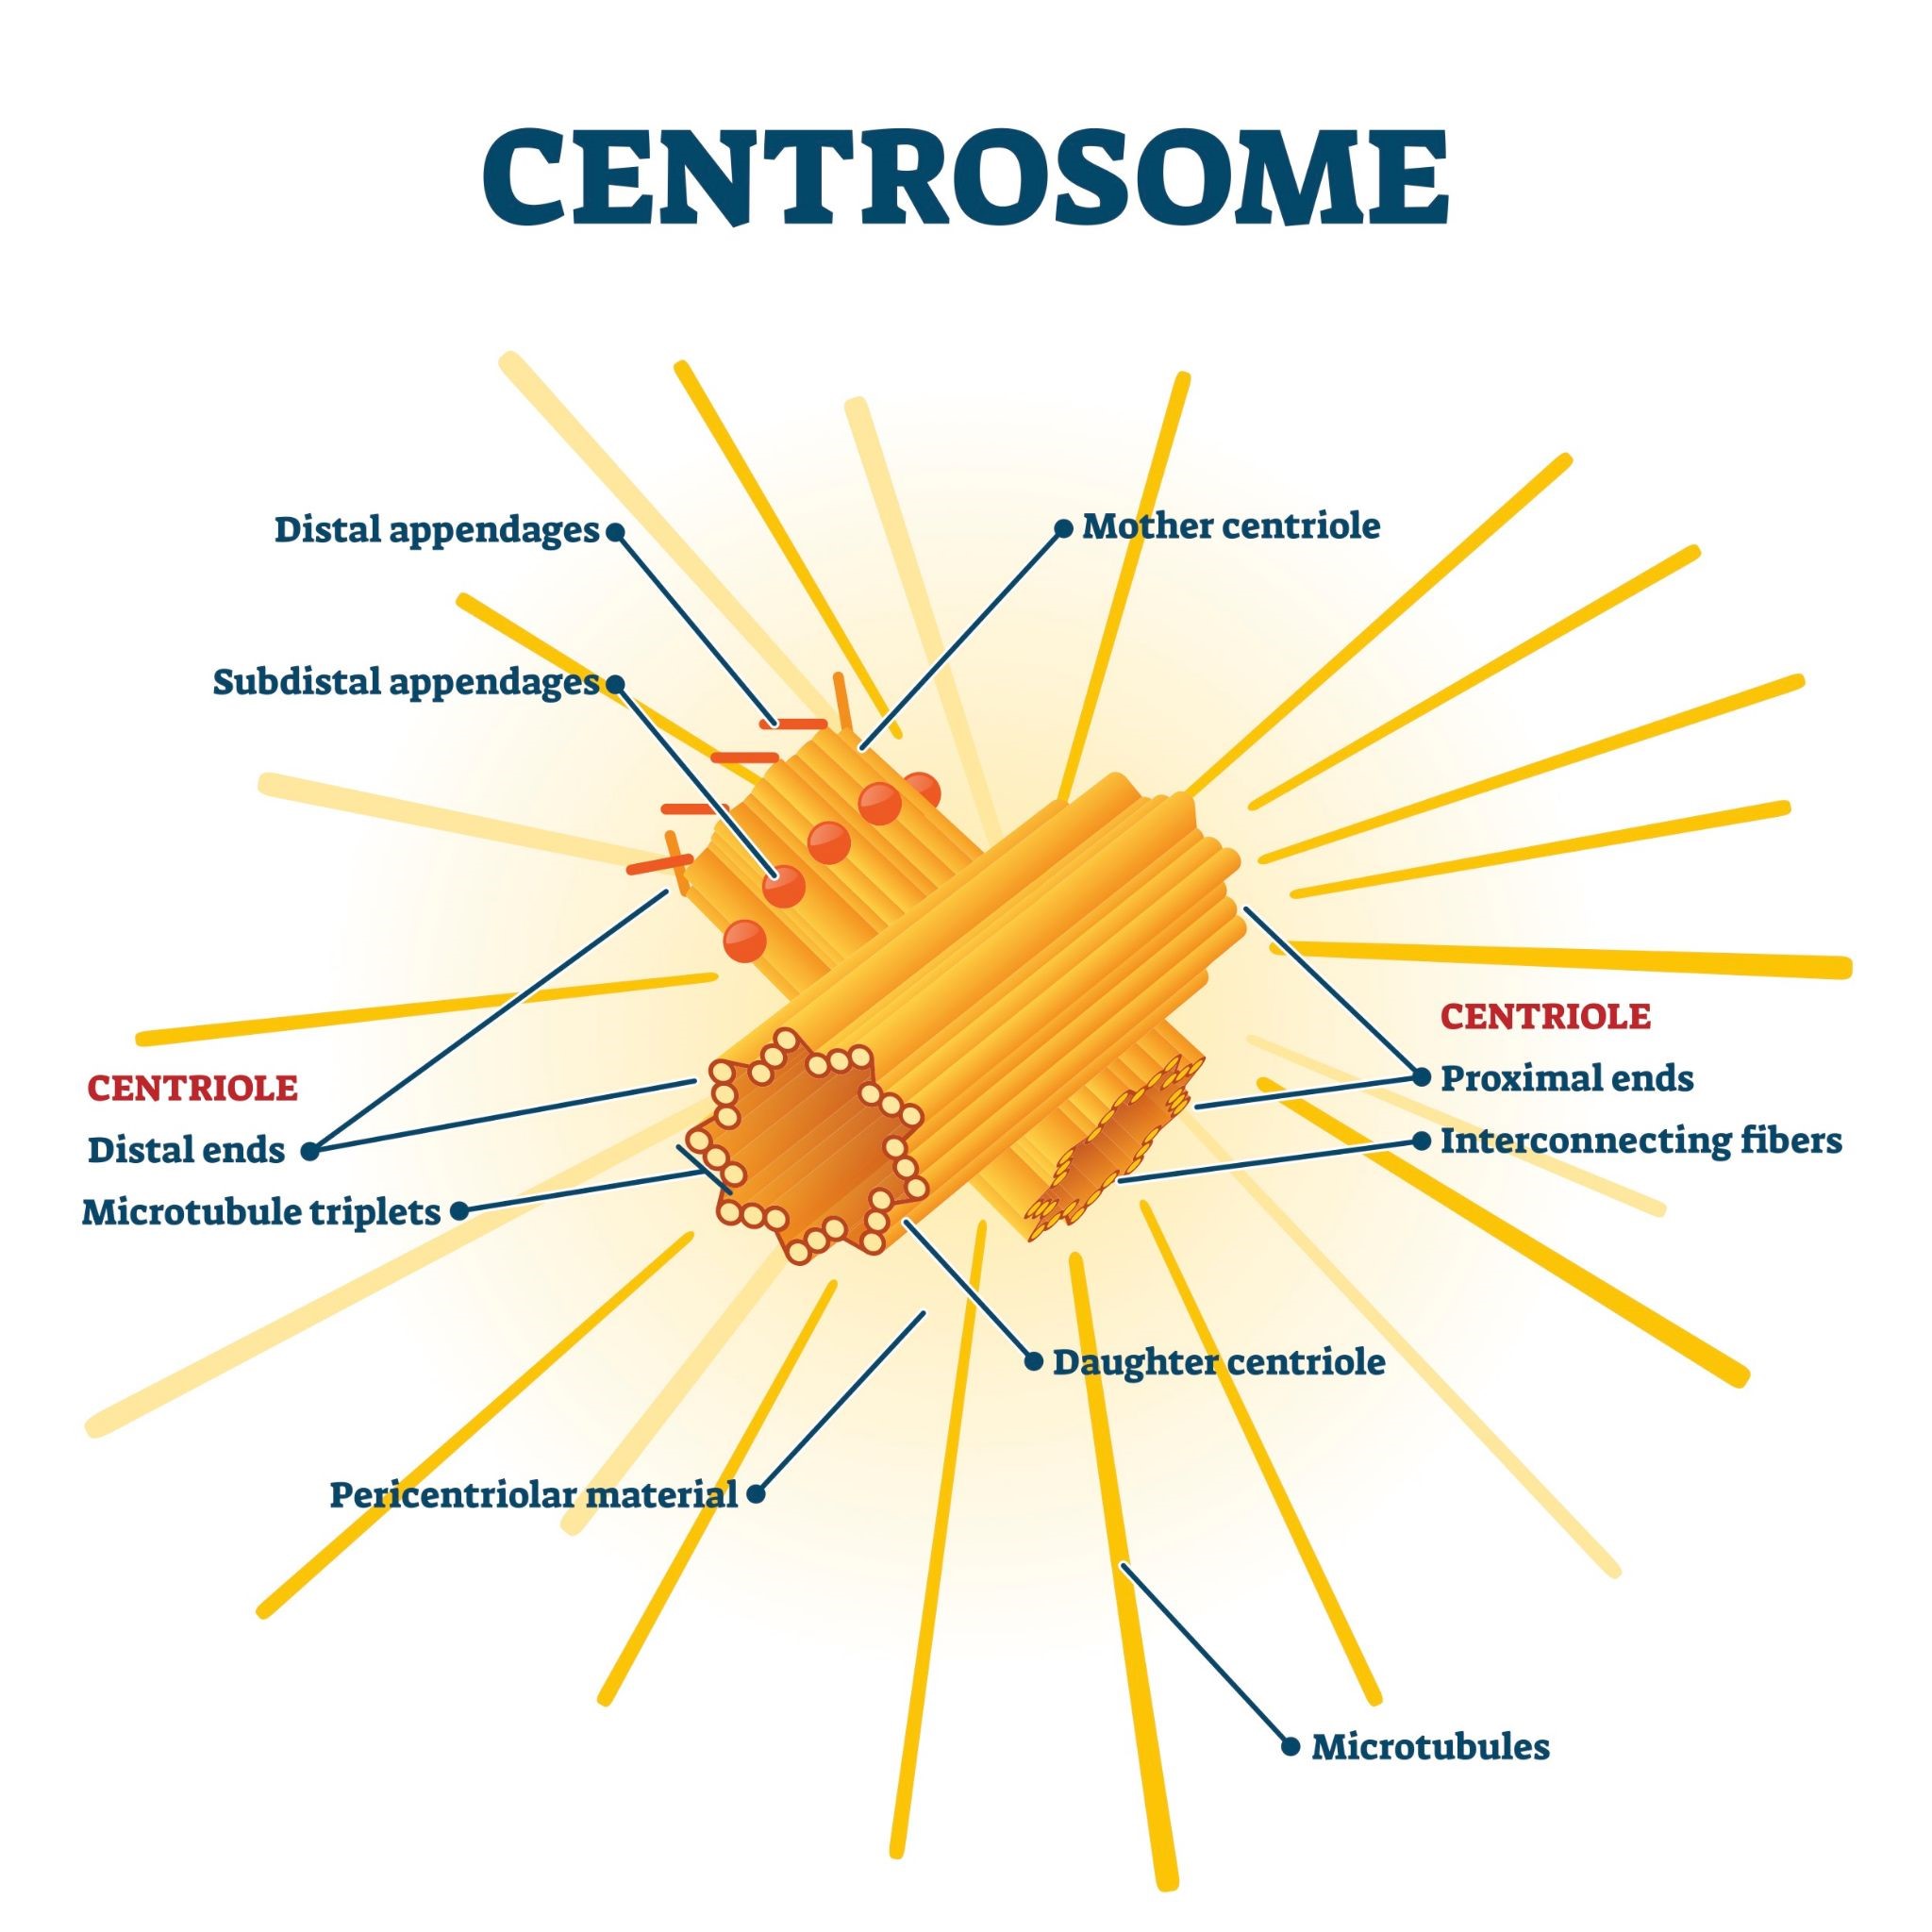
2. Centrosomes duplicate
- pair of centrioles
- only in animal cells
- organize mitotic spindle
3. After replication
Each chromosome
= 2 sister chromatids (exact copies)
Centromere
Sister chromatids most closely attached
Kinetochores
Proteins attached to each centromere
G2
Short phase
Now twice as much DNA
Still chromatin
Prep for mitosis
Metabolic activity
Protein synthesis
B. Events of M phase
Mitosis and Cytokinesis
Around 10% of cell cycle
Mitosis
Nuclear division associated with division of somatic cells
Continuous process:
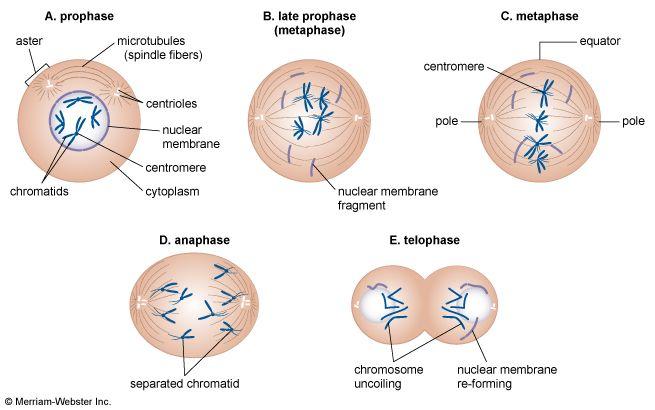
Prophase
Prometaphase
Metaphase
Anaphase
Telophase
Ploidy does NOT change! (if a cell is haploid and goes through mitosis, it will remain haploid. Same for diploid)
Prophase
Chromatin condenses
Nuclear envelope breaks down
Mitotic spindle begins to form
Microtubules
Extend from centrosomes
2. Prometaphase
Centrosomes
Move away from each other towards opposite poles
Spindle
- Continues to elongate
- Attached to kinetochores
3. Metaphase
Chromosomes
Line up on metaphase plate
Sister chromatids
Oriented towards opposite poles
4. Anaphase
Chromatids
Separate at centromeres
Move to opposite poles as microtubules shorten
-> Chromosomes
5. Telophase
Chromosomes start to decondense
Nuclear envelopes form
Spindle depolymerizes
-> 2 nuclei genetically identical to each other & to original parent cell
Ploidy did NOT change!
6. Cytokinesis
Cytoplasm divides into 2 daughter cells
Cell organelles randomly divide between cells
Each nucleus in interphase
Animal cells
Cytokinesis = cleavage
Cleavage furrow
Contratile ring forms
Actin and myosin
Parent pinched into two
Plant cell
Vesicles from golgi
-> line up at old metaphase plate
-> fuse
-> material forms cell plate
-> cell wall
Cell cycle summary
Interphase
Non-dividing
Normal growth and function
Preps for cell division
M phase
Cell division
Mitosis and cytokinesis
Occurs in haploid (n) and diploid (2n) cells
Daughter cells are identical to parent cells
Ploidy does not change
11: Meiosis
Introduction to heredity
Heredity
Transmission of traits from one generation to next
= inheritance
Variation
Differences between individuals
All this plays into genetics
2 types of reproduction
Asexual
Single parent -> Offspring
Single celled organisms One cell -> Two cells 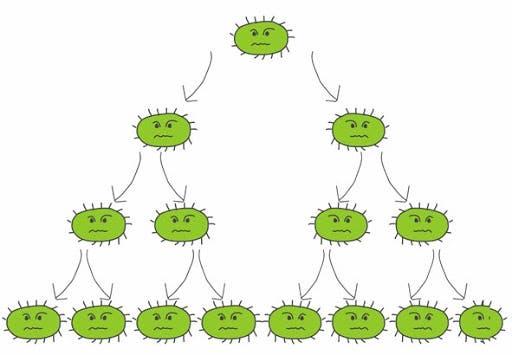 | Multi-cellular organisms -> bud or fragment 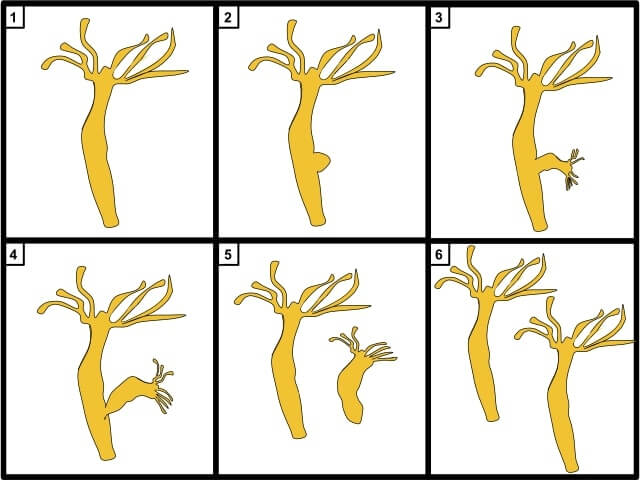 |
|---|
Mitosis
2n parent -> 2n offspring
n parent -> n offspring
Clones
Identical genetic material
Advantages
Rapid & low E
No mate
Many offspring
-> well-adapted to environment
2. Sexual
Parents (2n) -> offspring (2n)
Gamete (n) + Gamete (n) -> Zygote (2n)
How do 2n parents produce n gametes?
Meiosis
One diploid cell -> -> four haploid cells
Chromosome # is half (reduction division)
Offspring not clonal
Advantage -> genetic variation
Some offspring better able to survive change or stress
Meiosis & fertilization
Always occur in sexual reproduction
(Meiosis has the chromosome number, fertilization restores diploid #)
Alternate during life cycle
Maintain constant chromosome #
B. Chromosomes
Homologous chromosomes (homologs)
Pair of chromosomes
Same shape & genes
In a pair, 1 from mom & 1 from dad

Following replication, each chromosome consists of 2 sister chromatids

2. Humans
Somatic cells
Diploid (2n)
46 chromosomes (=23 pairs)
Produce somatic cells (2n) by mitosis
Somatic cell karyotype
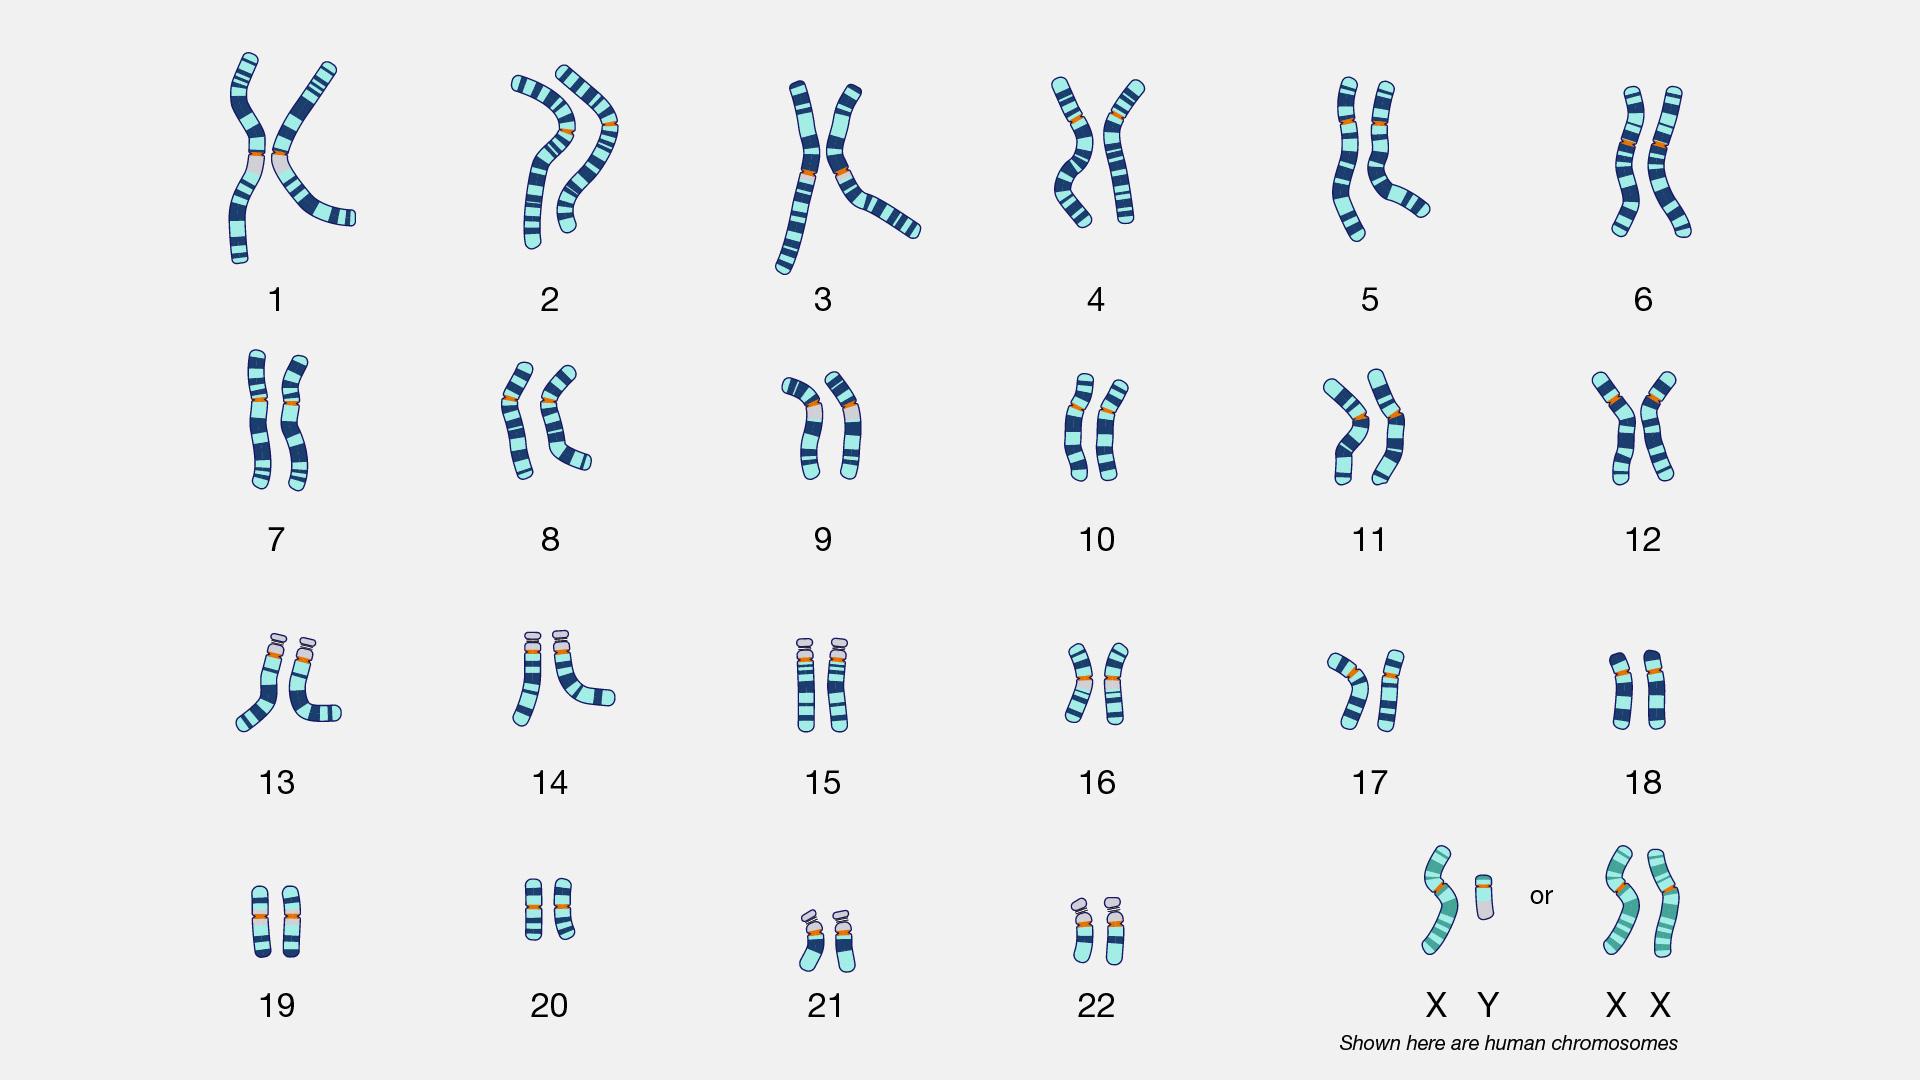
22 pairs of autosomes
1 pair of sex chromosomes
Primordial germ cell
Diploid (2n)
46 chromosomes (=23 pairs)
Produce gametes (n) by meiosis
Gamete karotype
22 autosomes
1 sex chromosome
TABLE CC PRACTICE:
ASEXUAL | SEXUAL | |
|---|---|---|
Genetic variation | ||
Clones | ||
Advantages | ||
n or 2n |
DRAW PRACTICE:
2n = 6

II. Stages of meiosis
Interphase
Meiosis I (P1 P1 M1 A1 T1)
Interkinesis
Meiosis II (P2 P2 M2 A2 T2)
Interphase (same as mitosis)
Chromosomes replicate
S phase
Chromatin
Each chromosome
2 sister chromatids (exact copies)
Humans
46 chromosomes
= 92 chromatids
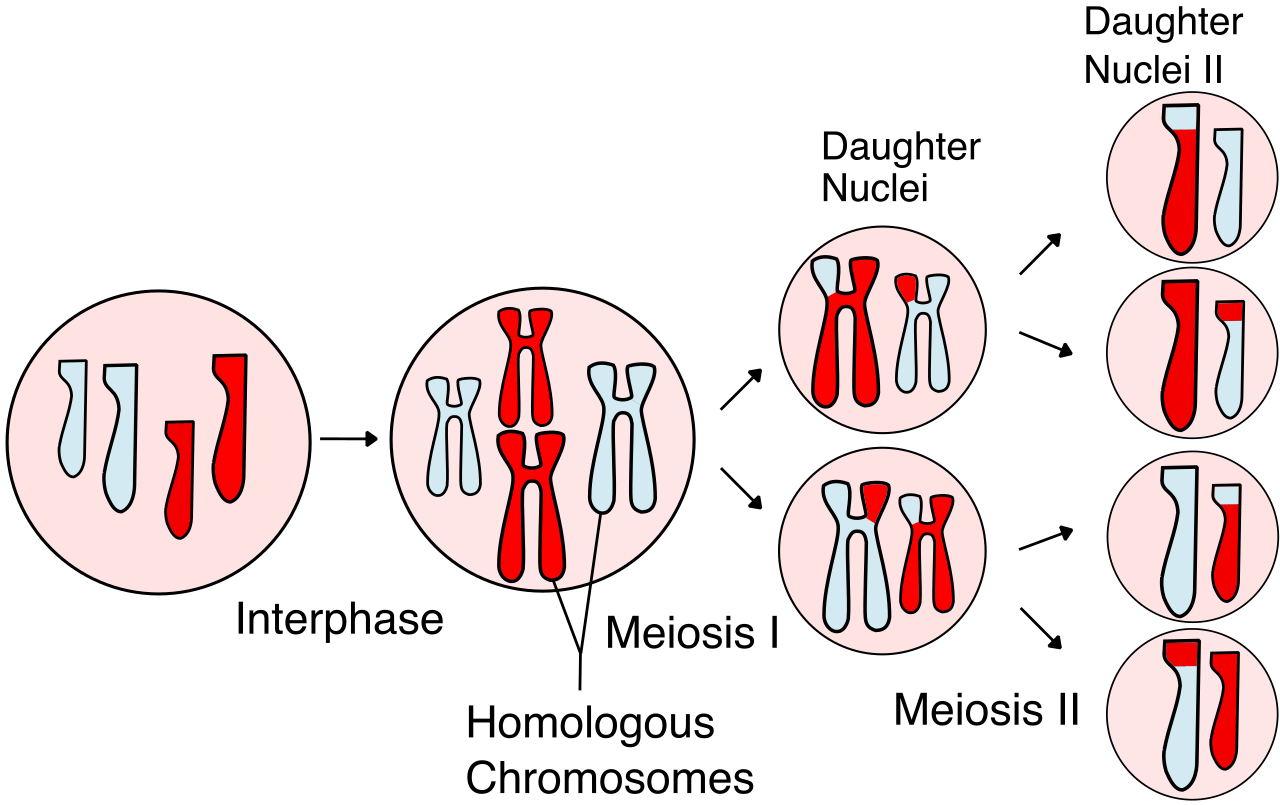
B. Meiosis I
-> Separates homologs
Prophase I
Synapsis
Homologs align & pair
Corresponding genes lined up
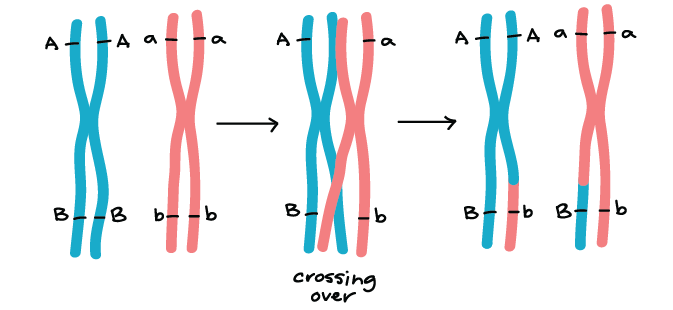
Tetrad = 4 chromatids
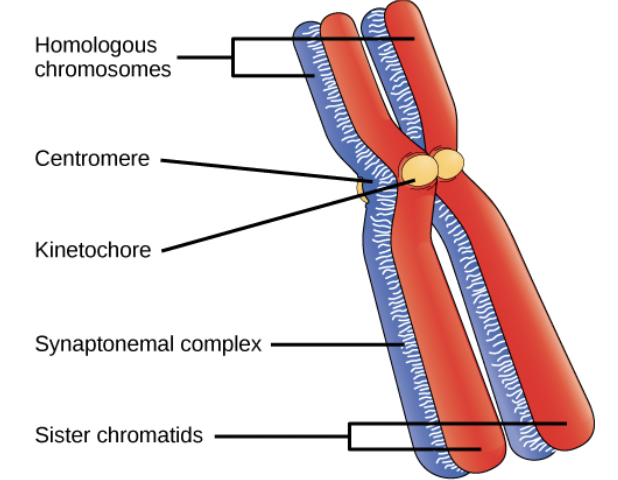
Crossing-over
Between non-sister chromatids
Enzymes break and rejoin DNA molecules
Exchange of genetic material Genetic recombination -> Variation |
|---|
Chromatin combines
2. Prometaphase I
Nuclear envelope fully broken down
Spindle completes & attached to kinetochores
End of prometaphase I in humans
# of Chromosomes? 46
# Chromatids? 92
# Tetrads? 23
3. Metaphase I
Tetrads
Align on metaphase plate
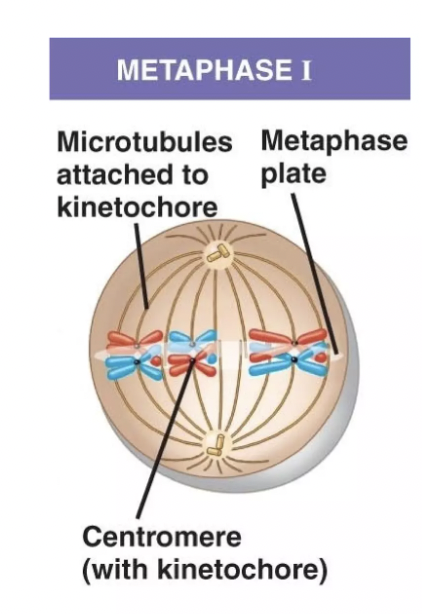
Homologs
Orient to opposite poles
MISSING
4. Anaphase I
Disjunction
Homologs separate
Sister chromatids
Remain attached
Move toward same pole
Chromosomes act independently
Each pole gets random mixture of maternal & paternal
Depends on how tetrads lined up
Nondisjunction
Error
One or more homologs fail to separate
-> one pole gets both homologs
-> other pole had no chromosome for that pair
5. Telophase I & Cytokinesis
Result in 2 haploid cells
Each chromosome = 2 sister chromatids
End of telophase I in humans
# of Chromosomes in each nucleus? 23
# Chromatids? 46
# Tetrads in each cell? 0
C. interkinesis
Between 1st and 2nd division
Short
No DNA synthesis
D. Meiosis II
-> separates sister chromatids
Prophase II and Prometaphase II
Fast
Spindle reforms
No homologs -> no pairing
Metaphase II
Chromosomes line up on metaphase plate
Sister centromeres oriented to opposite poles and attach to spindles
Anaphase II
Chromatids separate & go to opposite poles
Each now a chromosome
|
|---|
Telophase II and Cytokinesis
Chromosomes decondense
Nuclear envelopes form
4 haploid cells (gametes)
In humans, each has 23 chromosomes
Gametes are genetically distinct |
|---|
Overview of meiosis
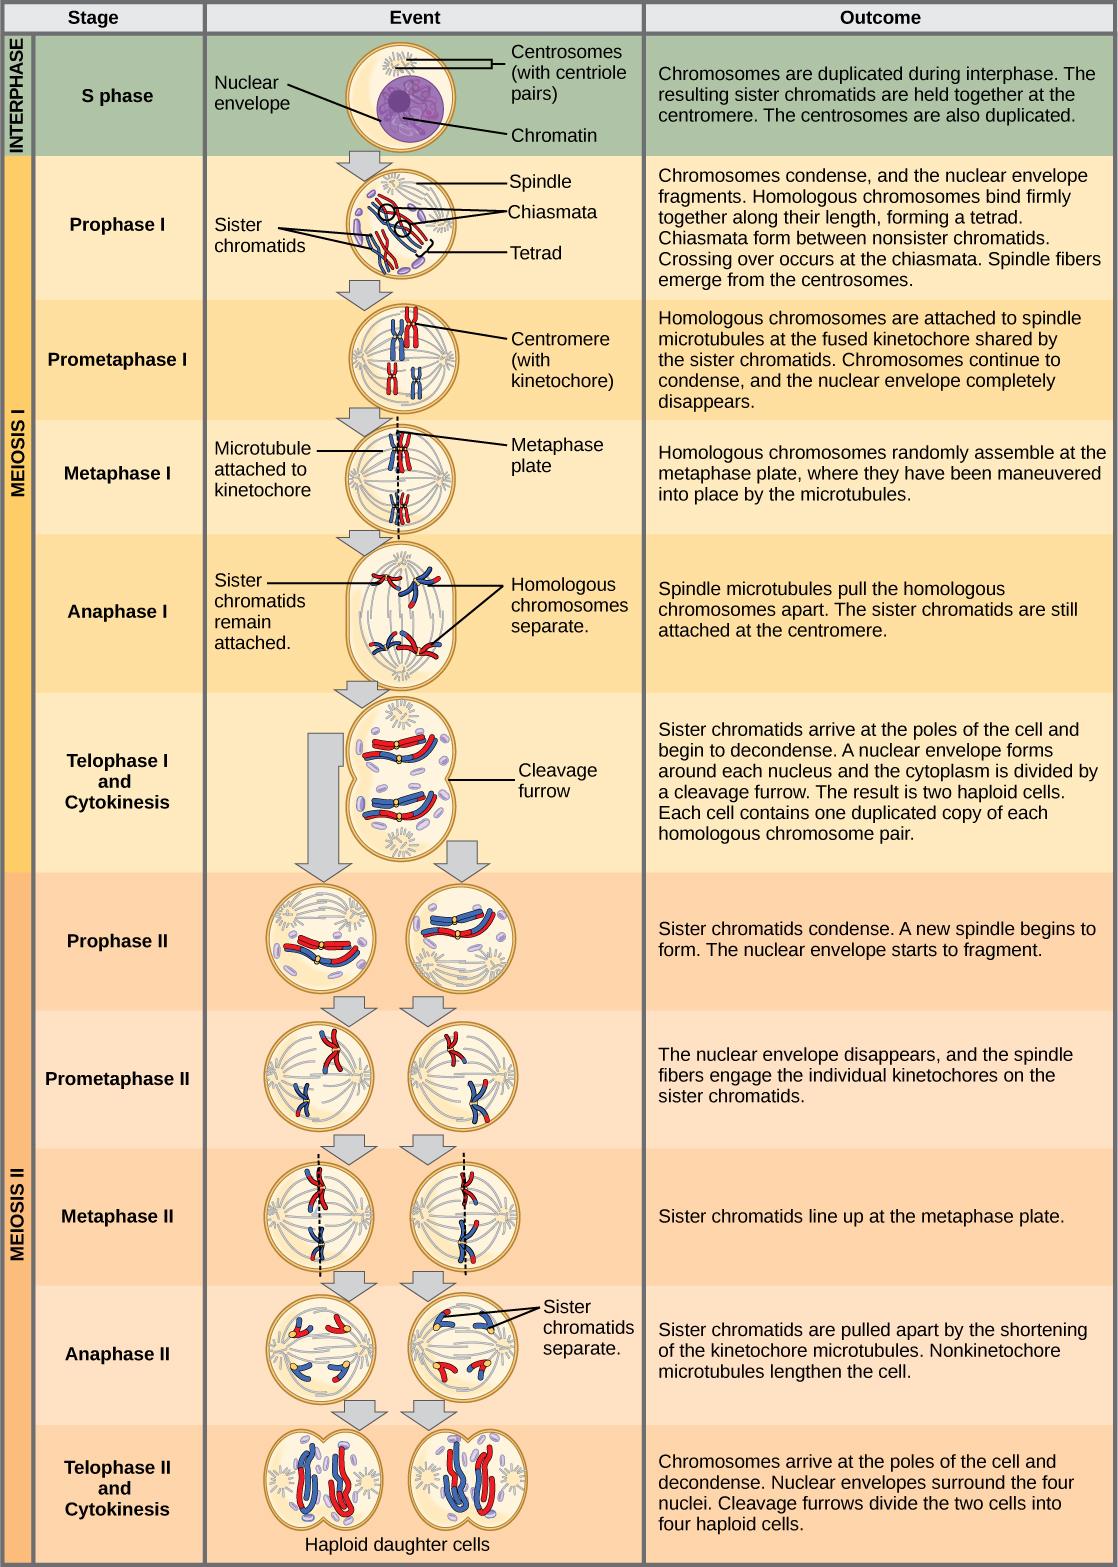
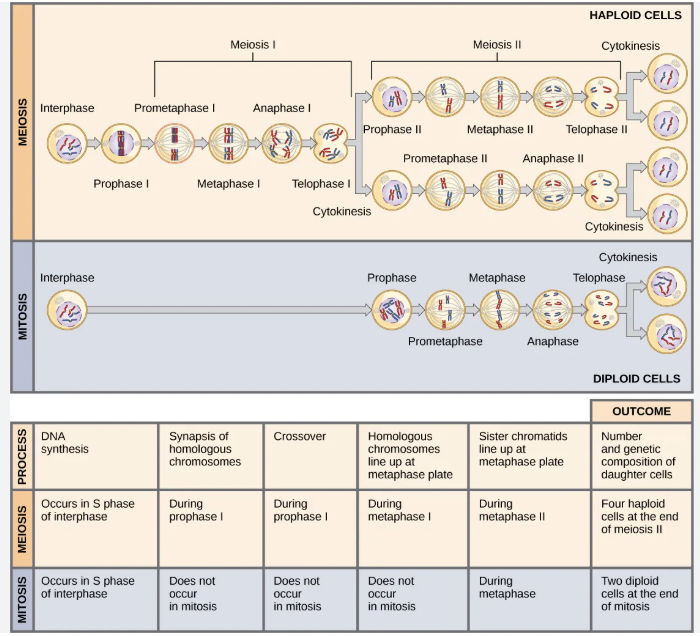
III. Comparison of Mitosis and Meiosis
Types of cells
Processes
# of chromosomes & ploidy
12: Intro to Genetics
Introduction to Genetics
Mendel's experimental approach
Background
Gregor Mendel (1822-1884)
Discovered basic rules of inheritance in Eukaryotes
Published: 1865
Rediscovered: 1900
Foundation of genetics
Experimental organism = Garden pea
Advantages
Inexpensive, easy to grow
Many varieties
Short generation (gen) time, many offspring
Clearly identifiable traits
Easy to control pollination
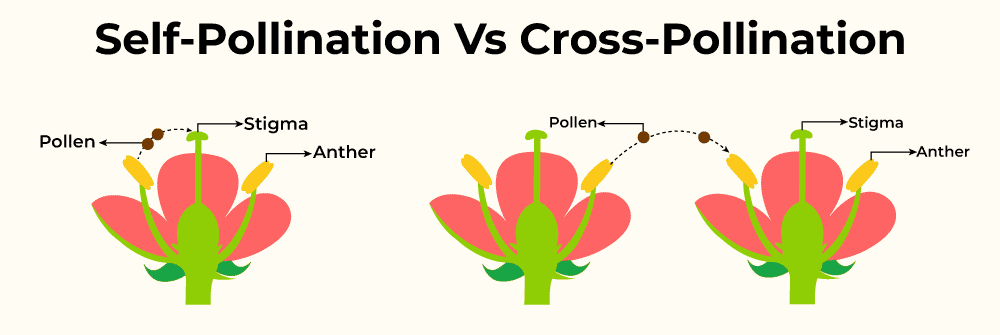
The movement of pollen grains from stamen (male) to carpel (female)
Self-fertilization VS. Cross-fertilization
3. Characters
Specific inherited property
Trait: Variant
EX: Seed texture
Round VS. Wrinkled
7 contrasting pairs
Character | Contrasting traits |
|---|---|
Flower color | Violet VS. White |
Flower position | Axial VS. Terminal |
Plant height | Tall VS. Dwarf |
Seed texture | Round VS. Wrinkled |
Seed color | Yellow VS. Green |
Pea pod texture | Inflated VS. Constricted |
Pea pod color | Green VS. Yellow |
Phenotypes
Observable trait
Expression of genes
4. Applied quantitative methods
Experimental approach
Planned experiments
Recorded data
Analysis of results
Scientific method
5. Developed true reading lines
-> All offspring same phenotype |
-> All offspring same phenotype |
|---|
B. Tested blending inheritance hypothesis
Idea at Mendel’s time
Gametes contain fluid from body
-> Blend to form offspring

b. Problems:
- Pops don't become uniform
- traits “skip” gen
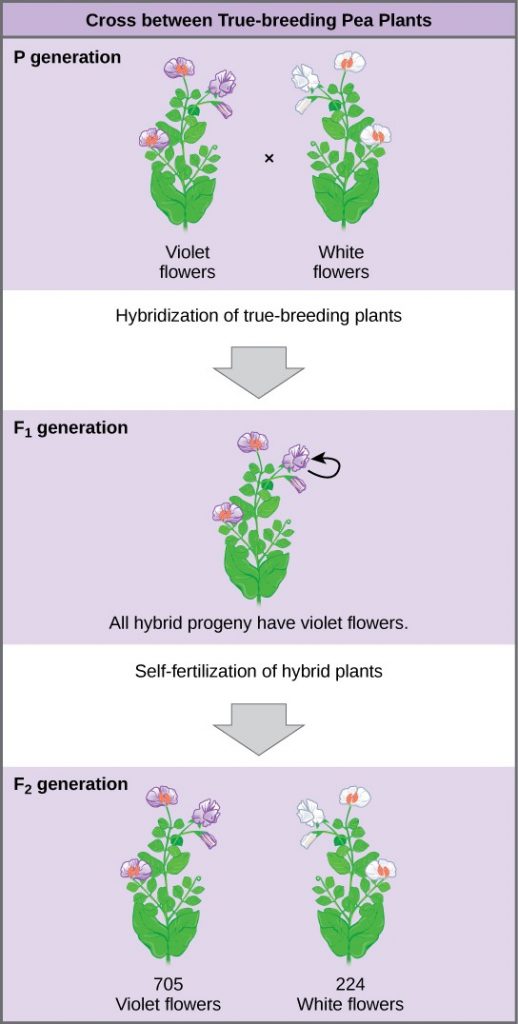
2. Mendel crosses true-breeding plants with contrasting traits
P= Parental Gen
F1= first gen
F2= second gen
Predication: If blending is accurate, then F1 phenotype should be intermediate between P phenotypes
|
|---|
|
|---|
The results of Mendel’s garden pea hybridizations
Character | Contrasting traits | F1 Offpring traits | F2 offspring traits | F2 traits rations |
|---|---|---|---|---|
Flower color | Violet VS. White | 100% violet | 705 violet 224 white | 3.15:1 |
Flower position | Axial VS. Terminal | 100% axial | 651 axial 207 terminal | 3.14:1 |
Plant height | Tall VS. Dwarf | 100% tall | 787 tall 277 dwarf | 2.84:1 |
Seed texture | Round VS. Wrinkled | 100% round | 5474 round 1850 wrinkled | 2.96:1 |
Seed color | Yellow VS. Green | 100% yellow | 6022 yellow 2001 green | 3.01:1 |
Pea pod texture | Inflated VS. Constricted | 100% Inflated | 882 inflated 299 constricted | 2.95:1 |
Pea pod color | Green VS. Yellow | 100% Green | 428 green 152 wrinkled | 2.82:1 |
-> Conclusion: Blending hypothesis rejected
C. Particulate inheritance hypothesis
Characters passed from gen to gen by discrete particles (now know these are genes)
Mendel's model
Genes are discrete units of info
Each parent contributes one allele to offspring
Dominant (dom) alleles masks recessive (rec) alleles
2 laws of inheritance
Modern genetics
Background
Gene
- Basic unit of heredity
- Codes for a protein
- At a specific locus
Alleles
- Alternative versions of genes
Vary slightly in seq
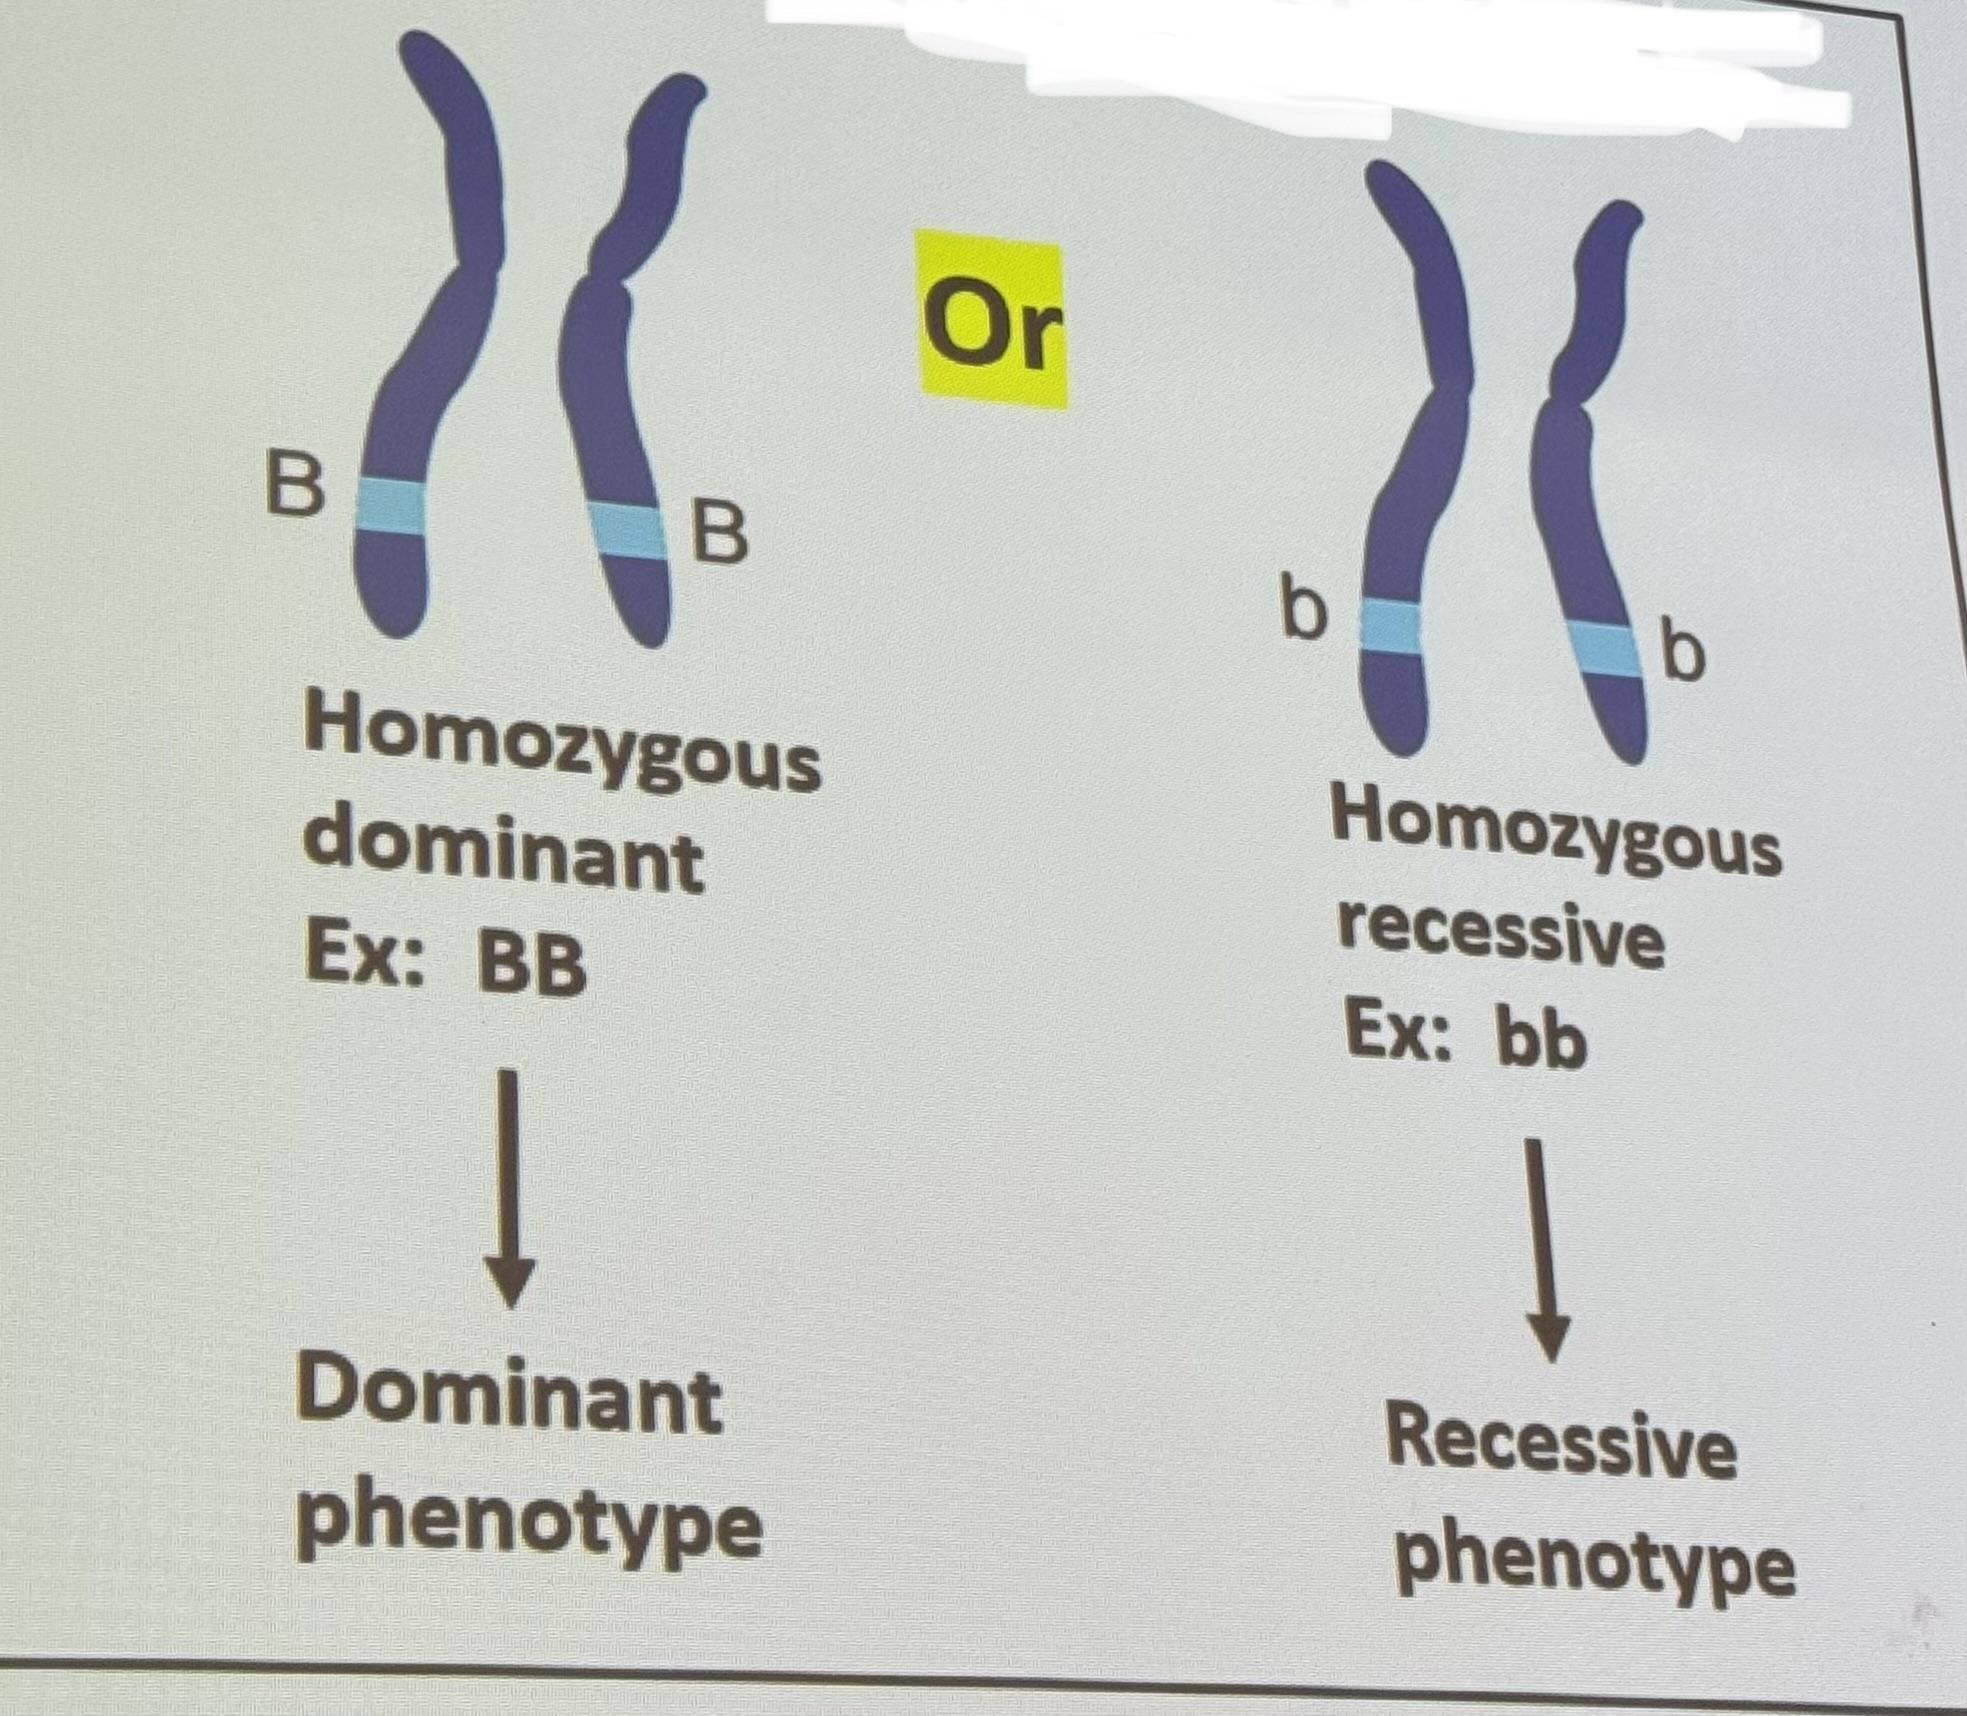
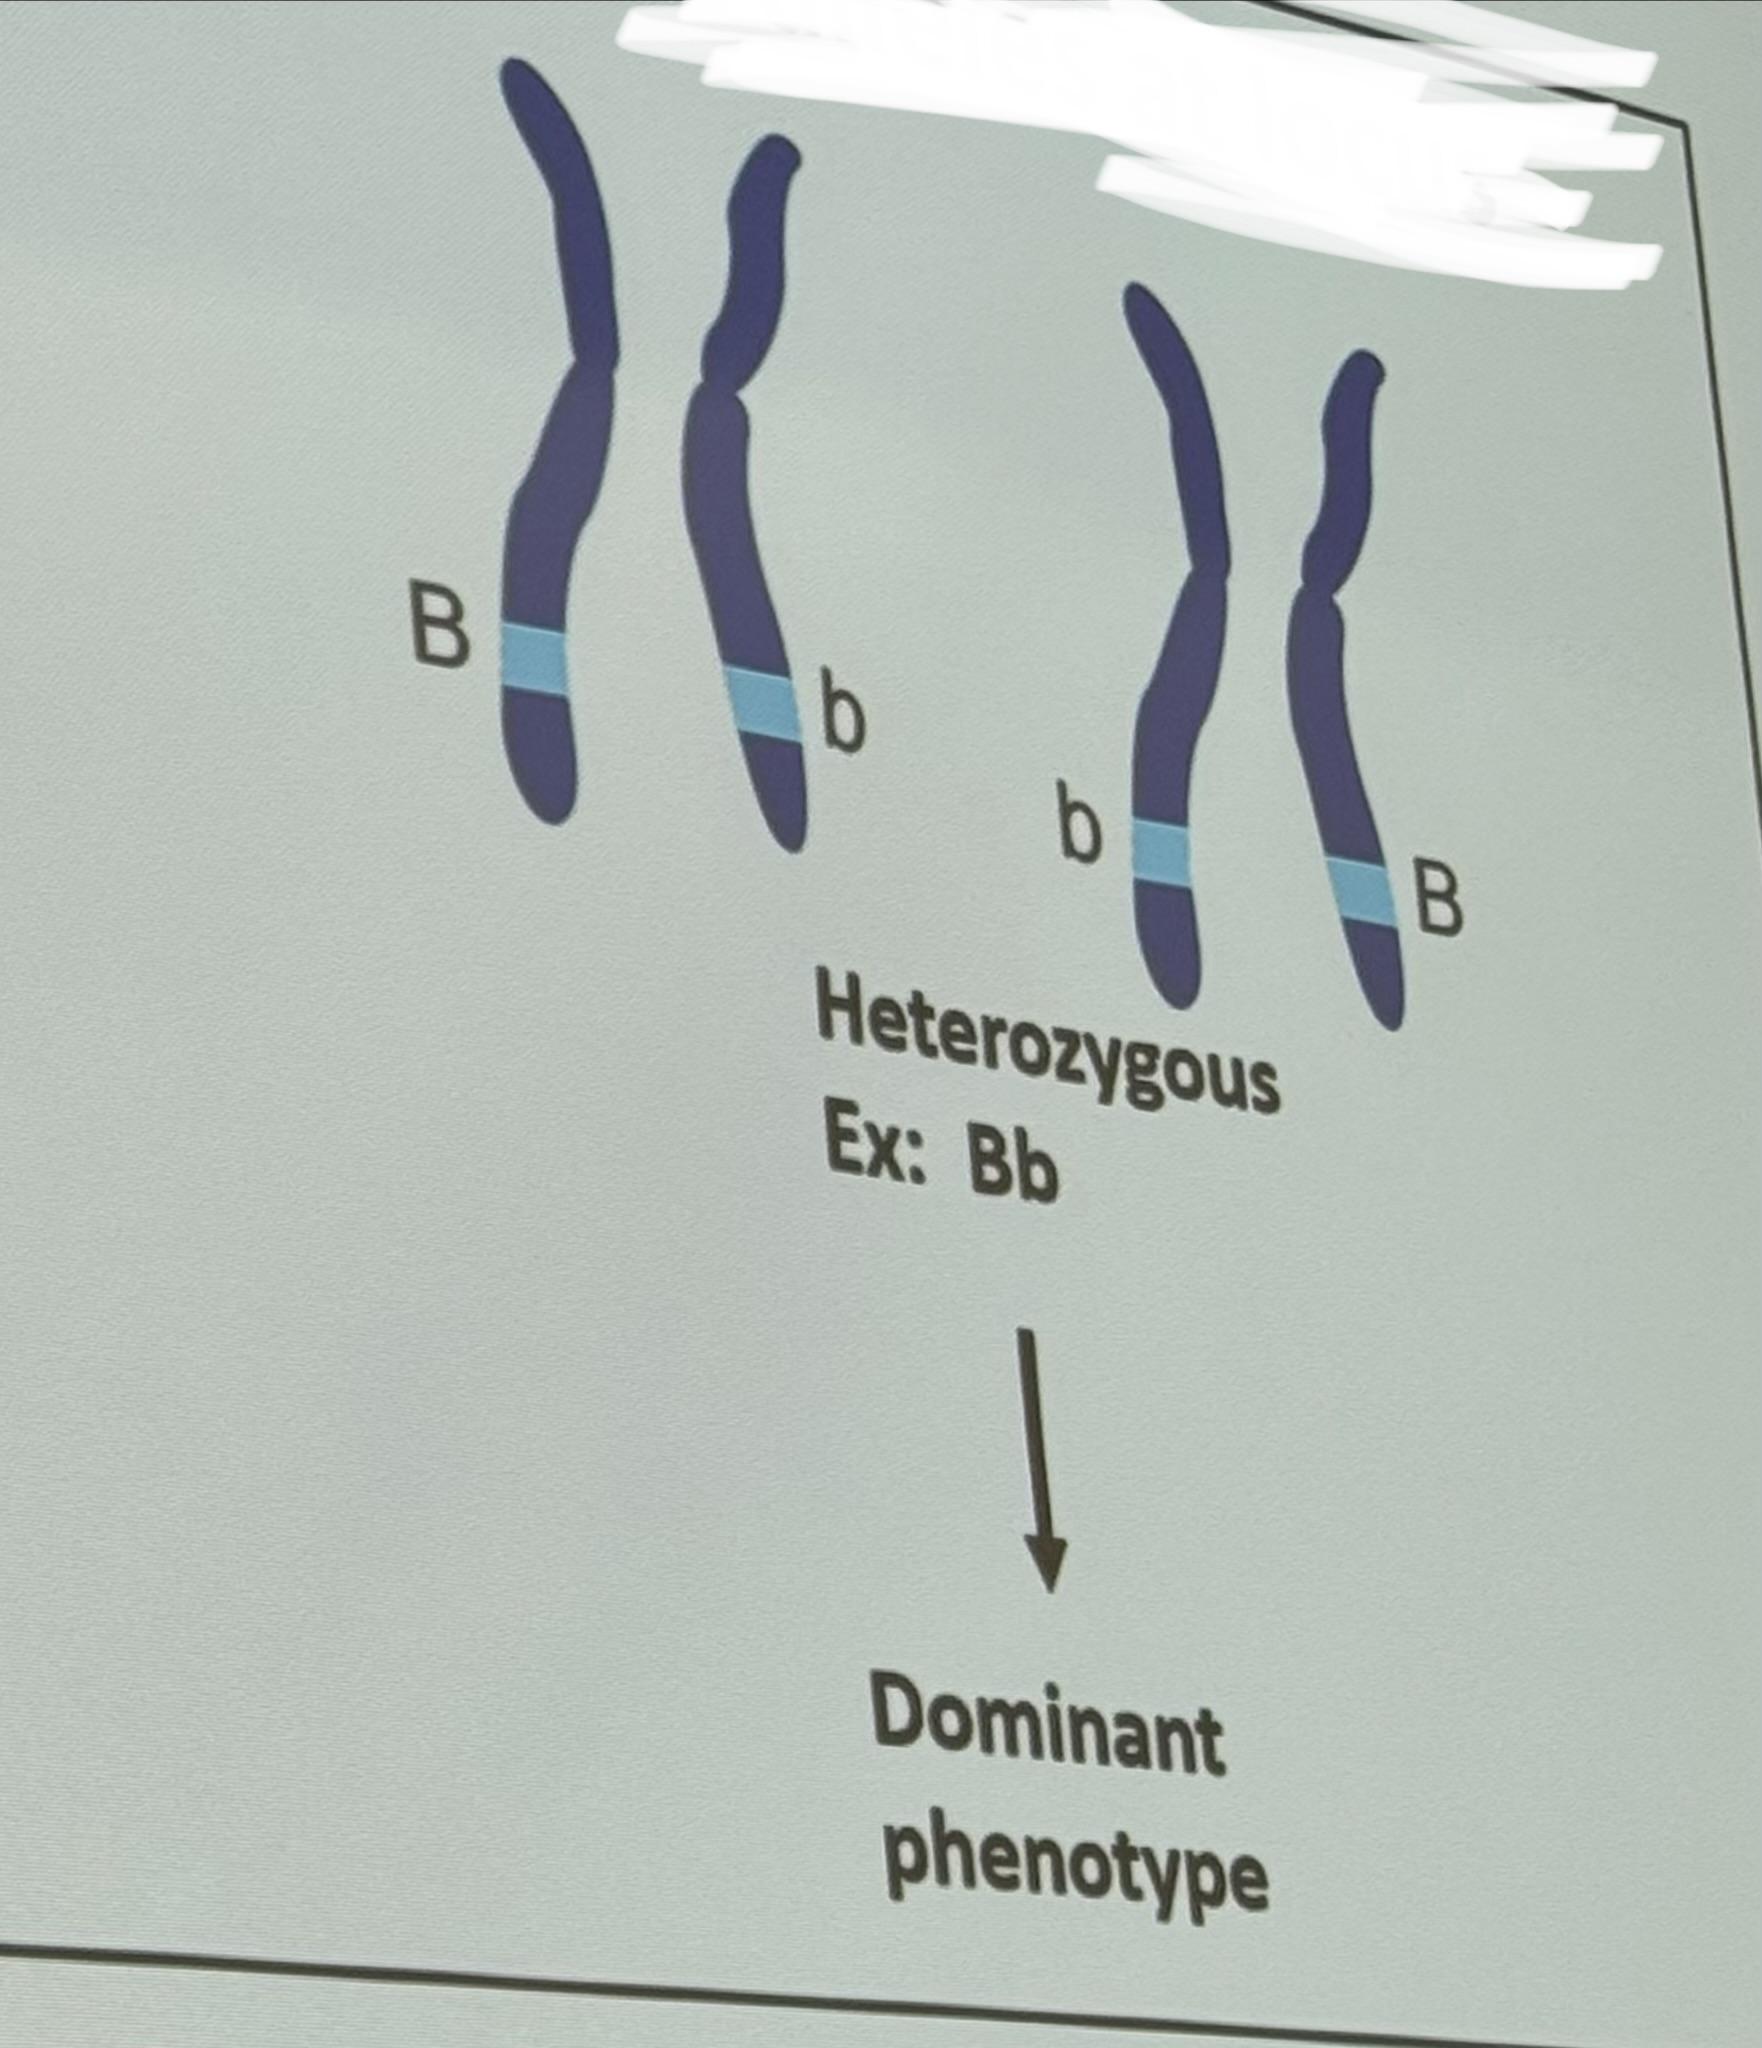
- Dominant (dom): Expressed
- Recessive (rec): Masked
Genotypes (set of alleles)
For each character, individual inherits 2 alleles (one from each parent)
 |
 |
|---|
B. Mendel's Law of Inheritance
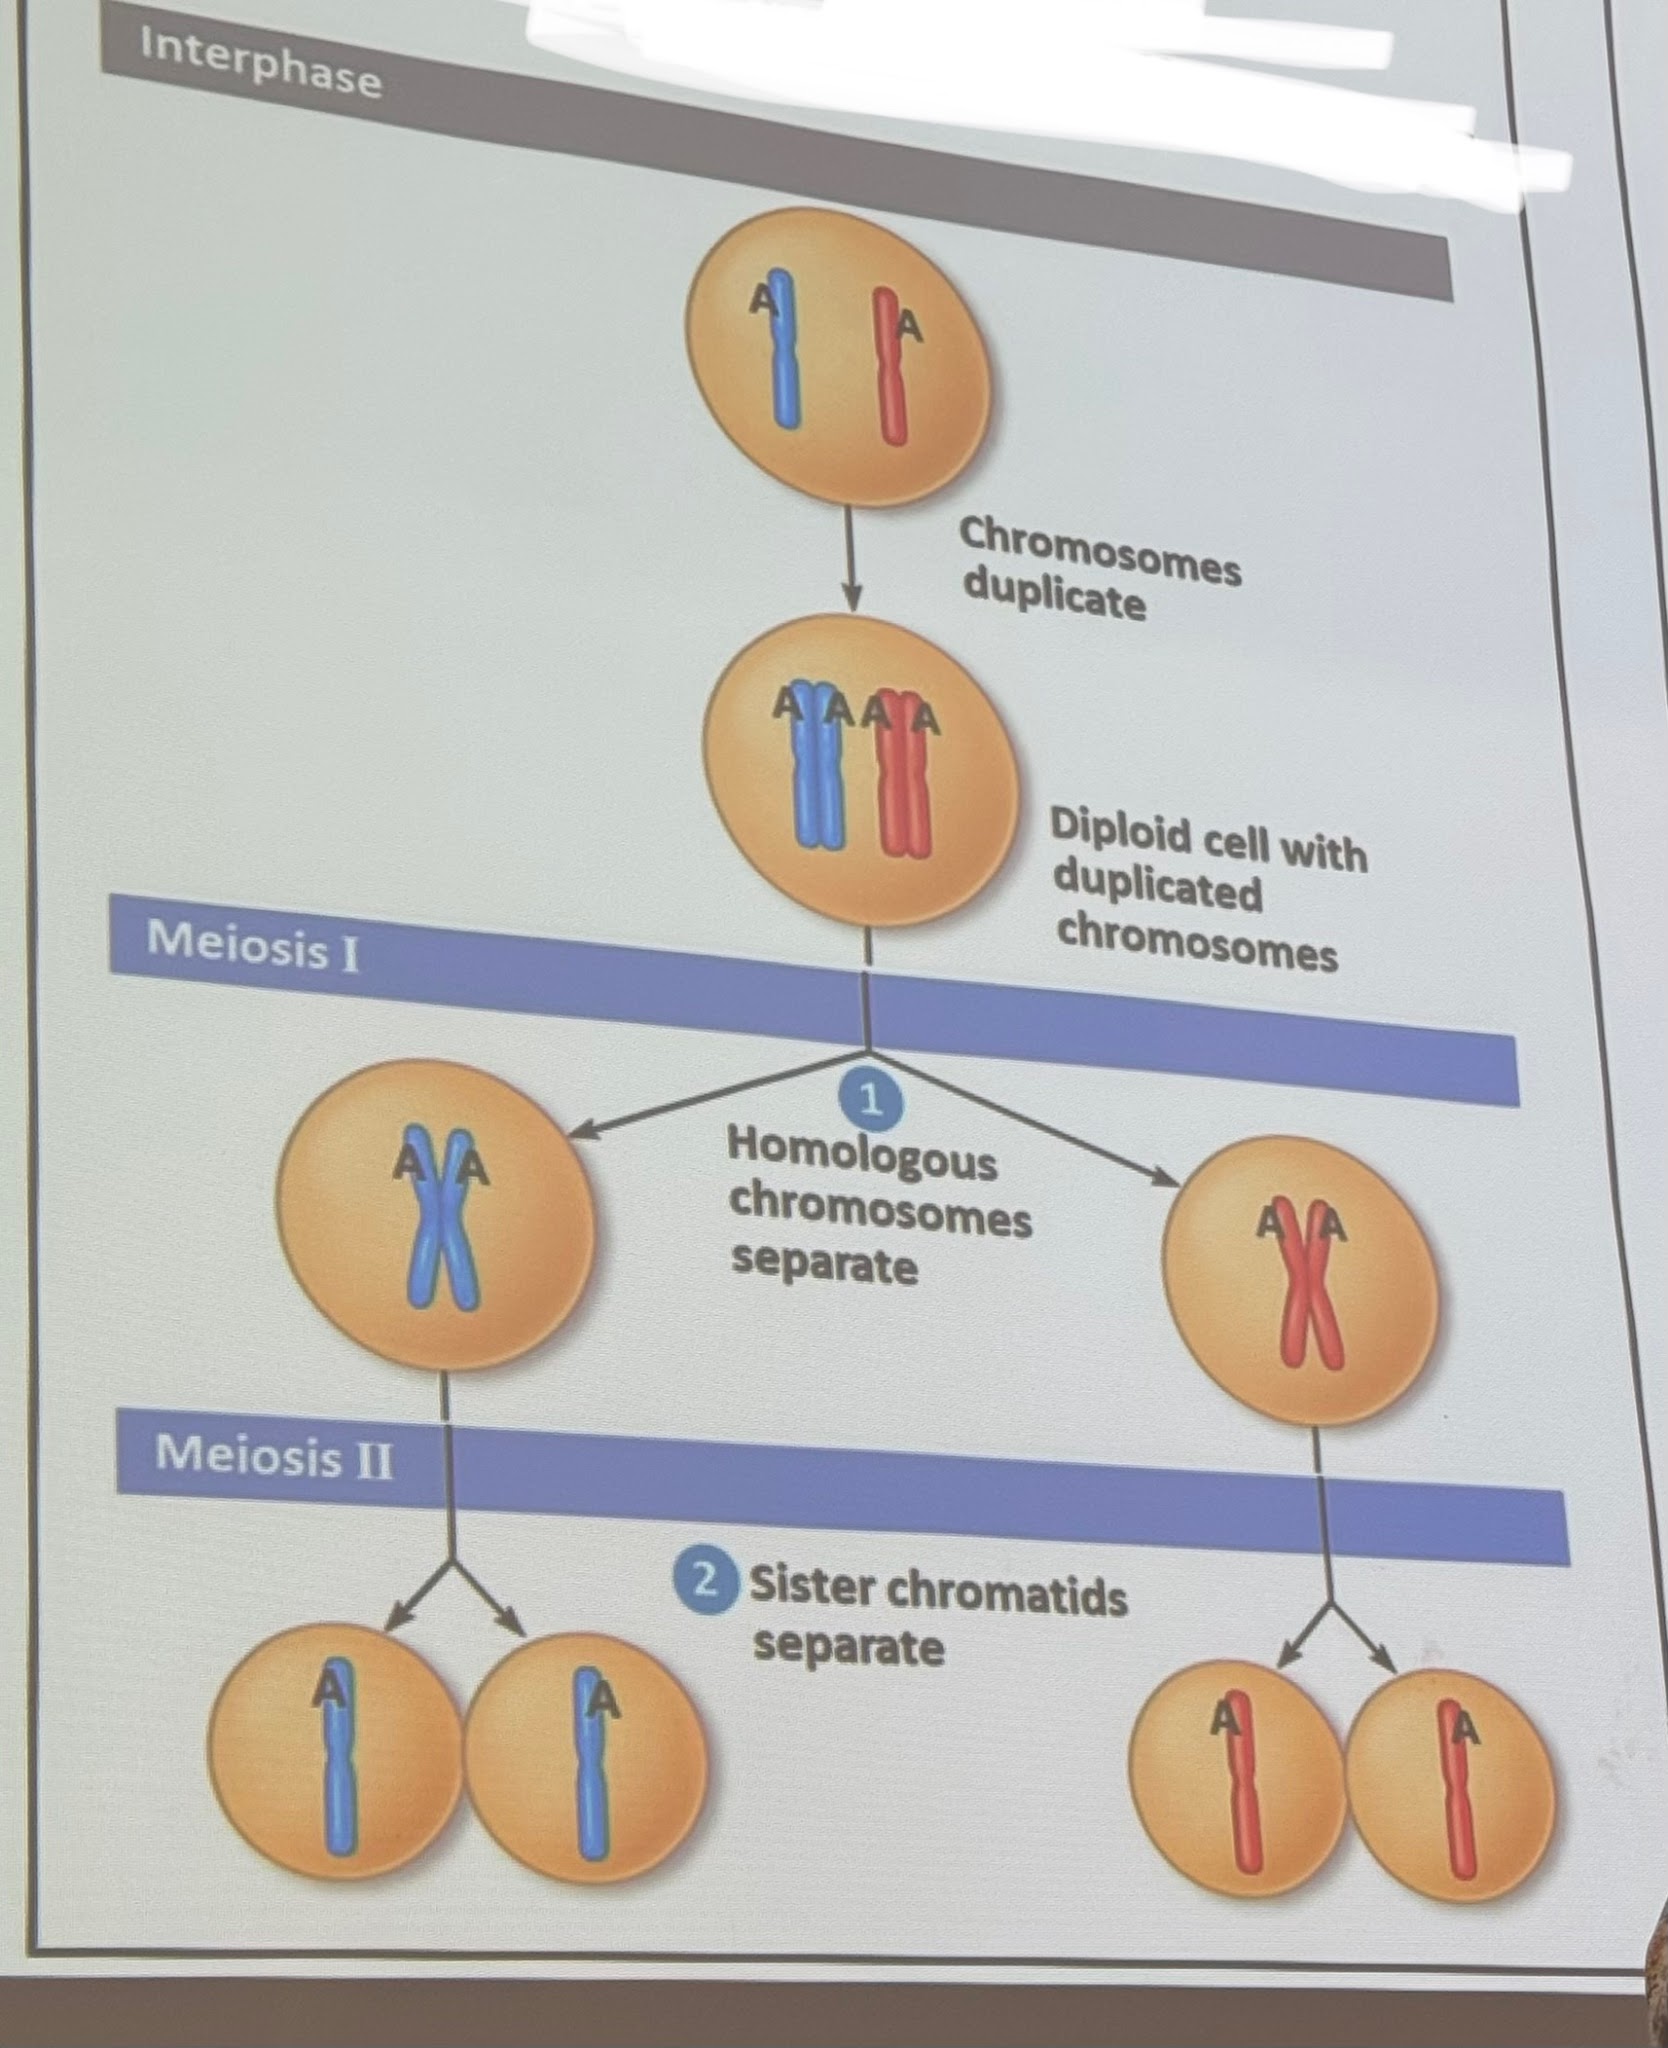
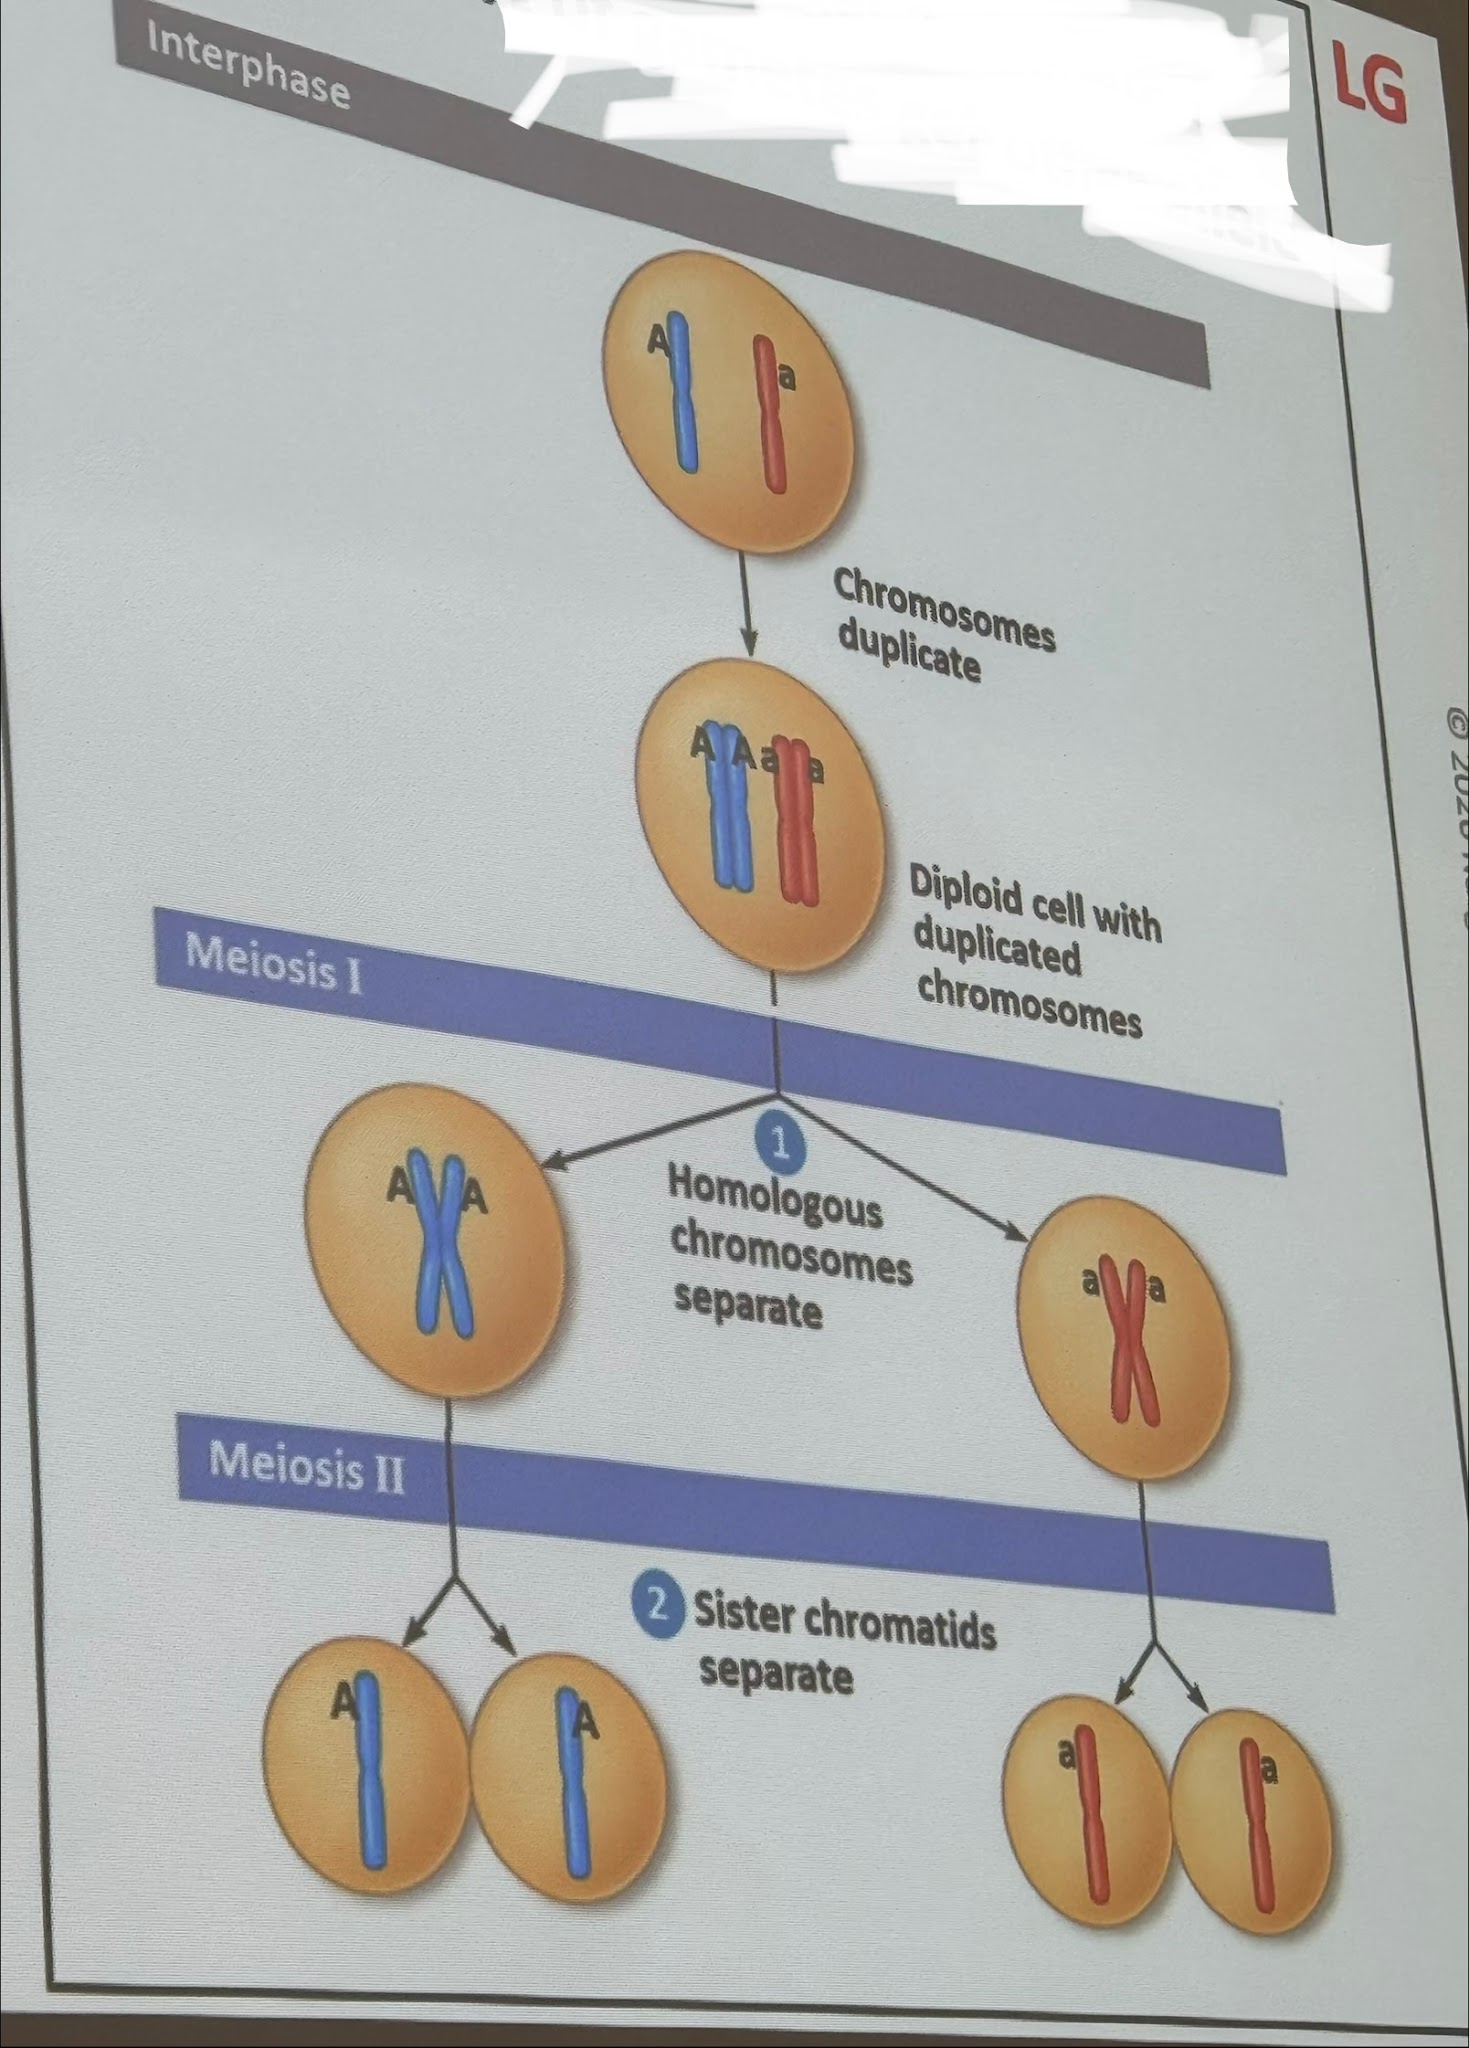
Law of segregation
The 2 alleles for a character segregate during gamete formation and end up in different gametes
 |
 |
|---|
2. Law of independent Assortment
2 or more genes assort independently during gamete formation
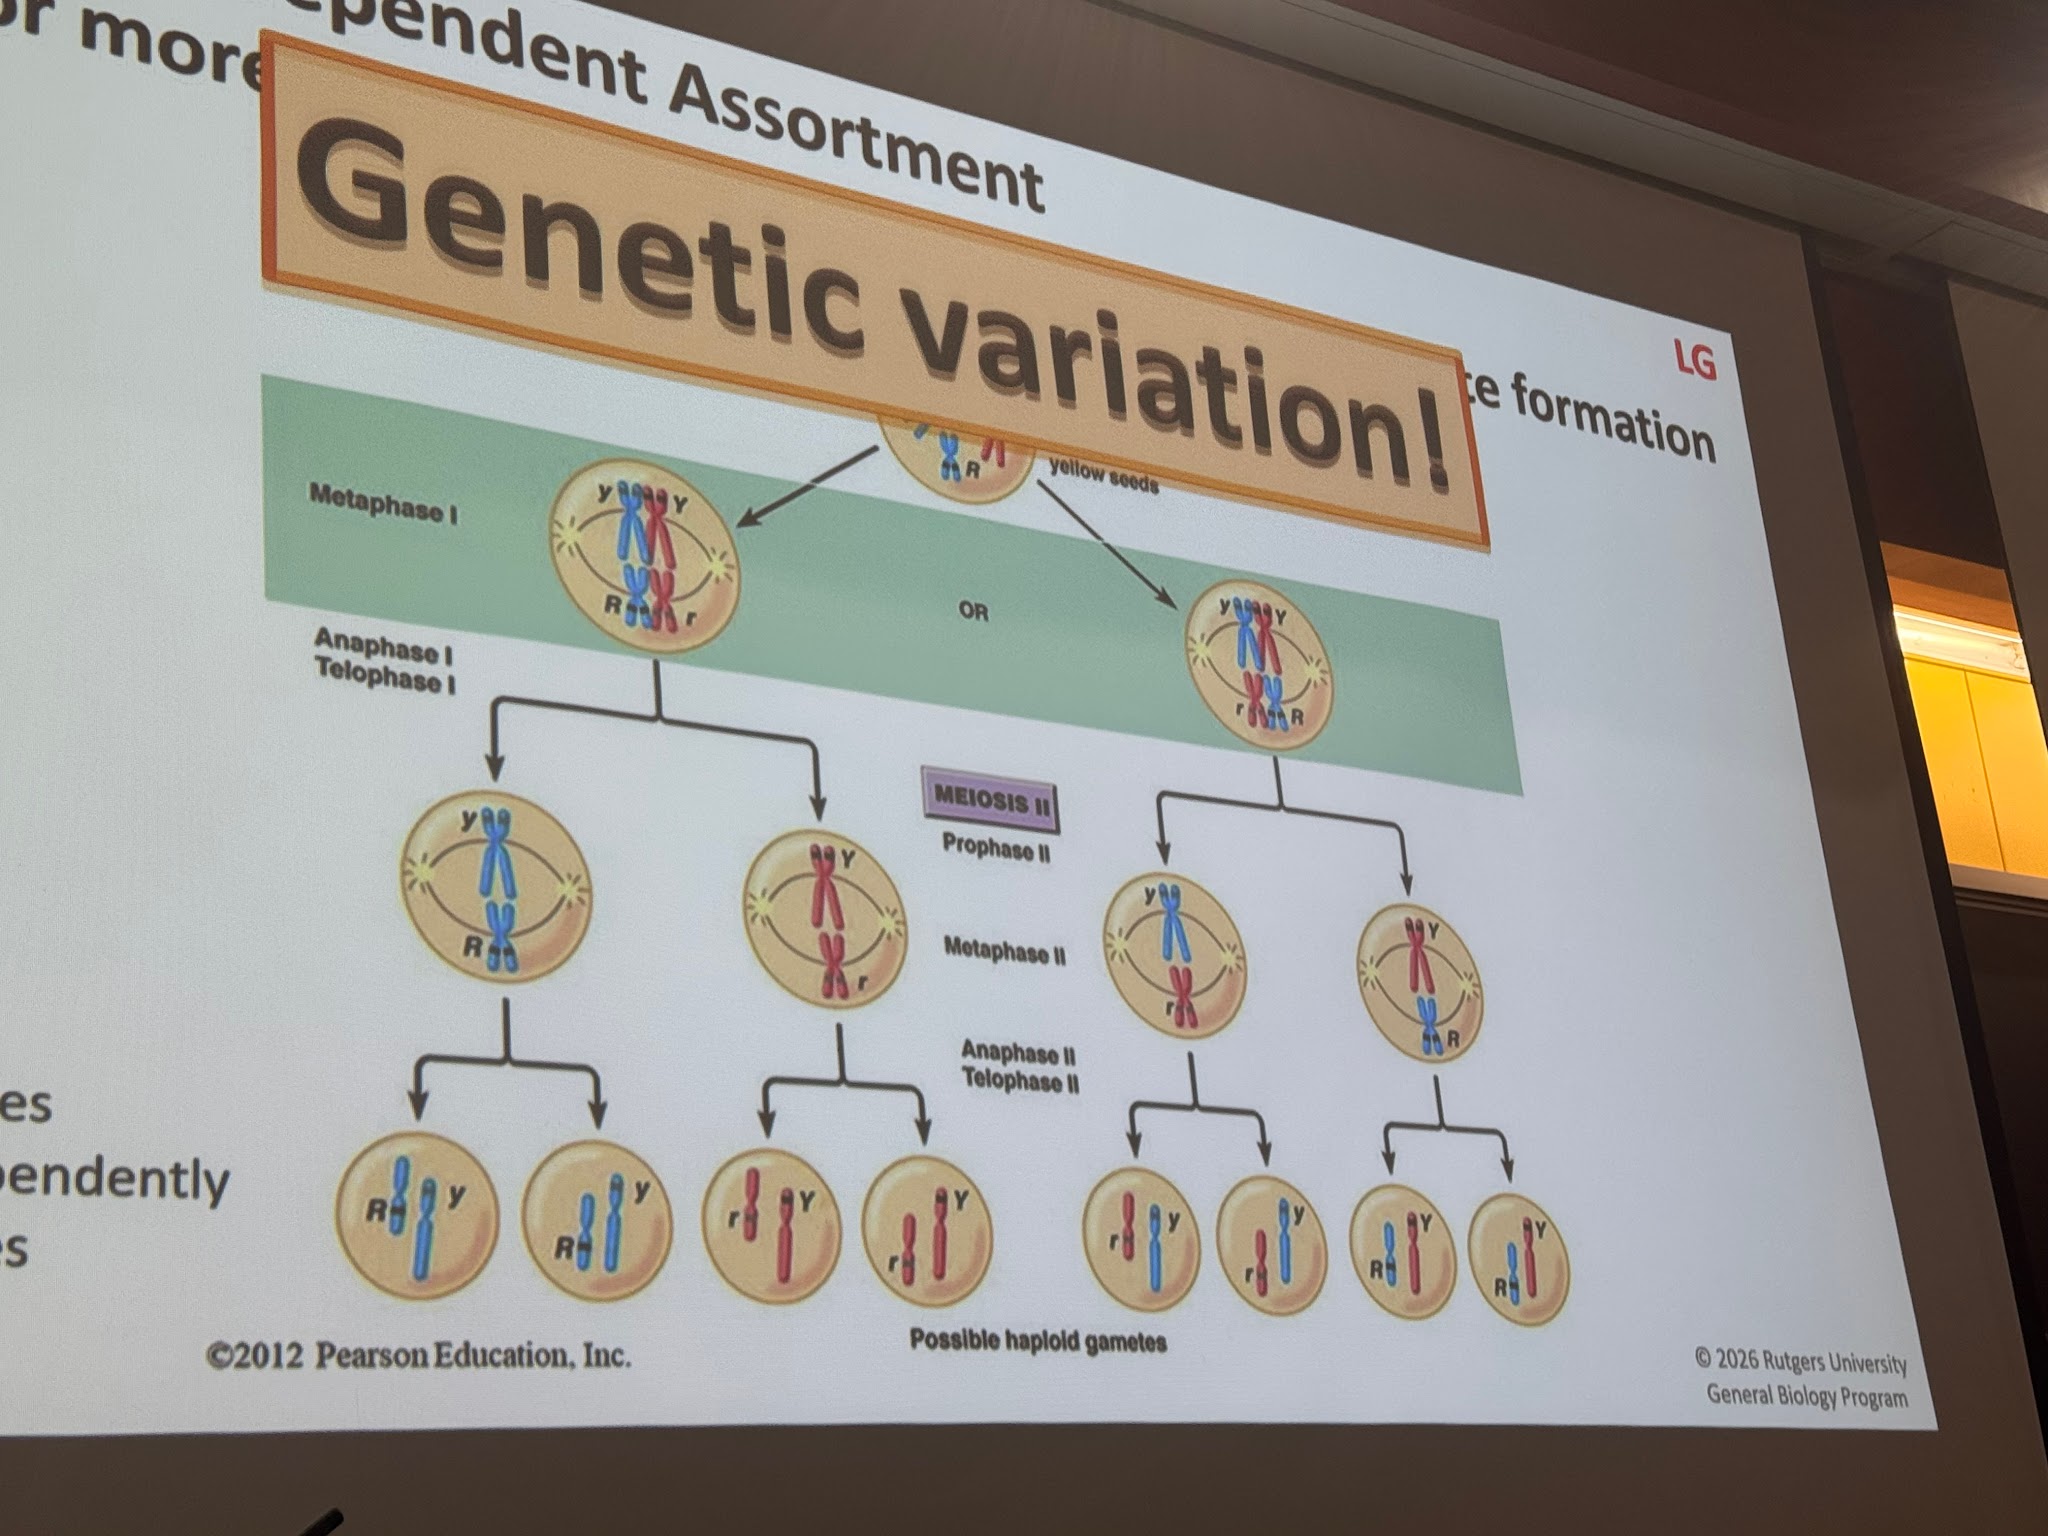
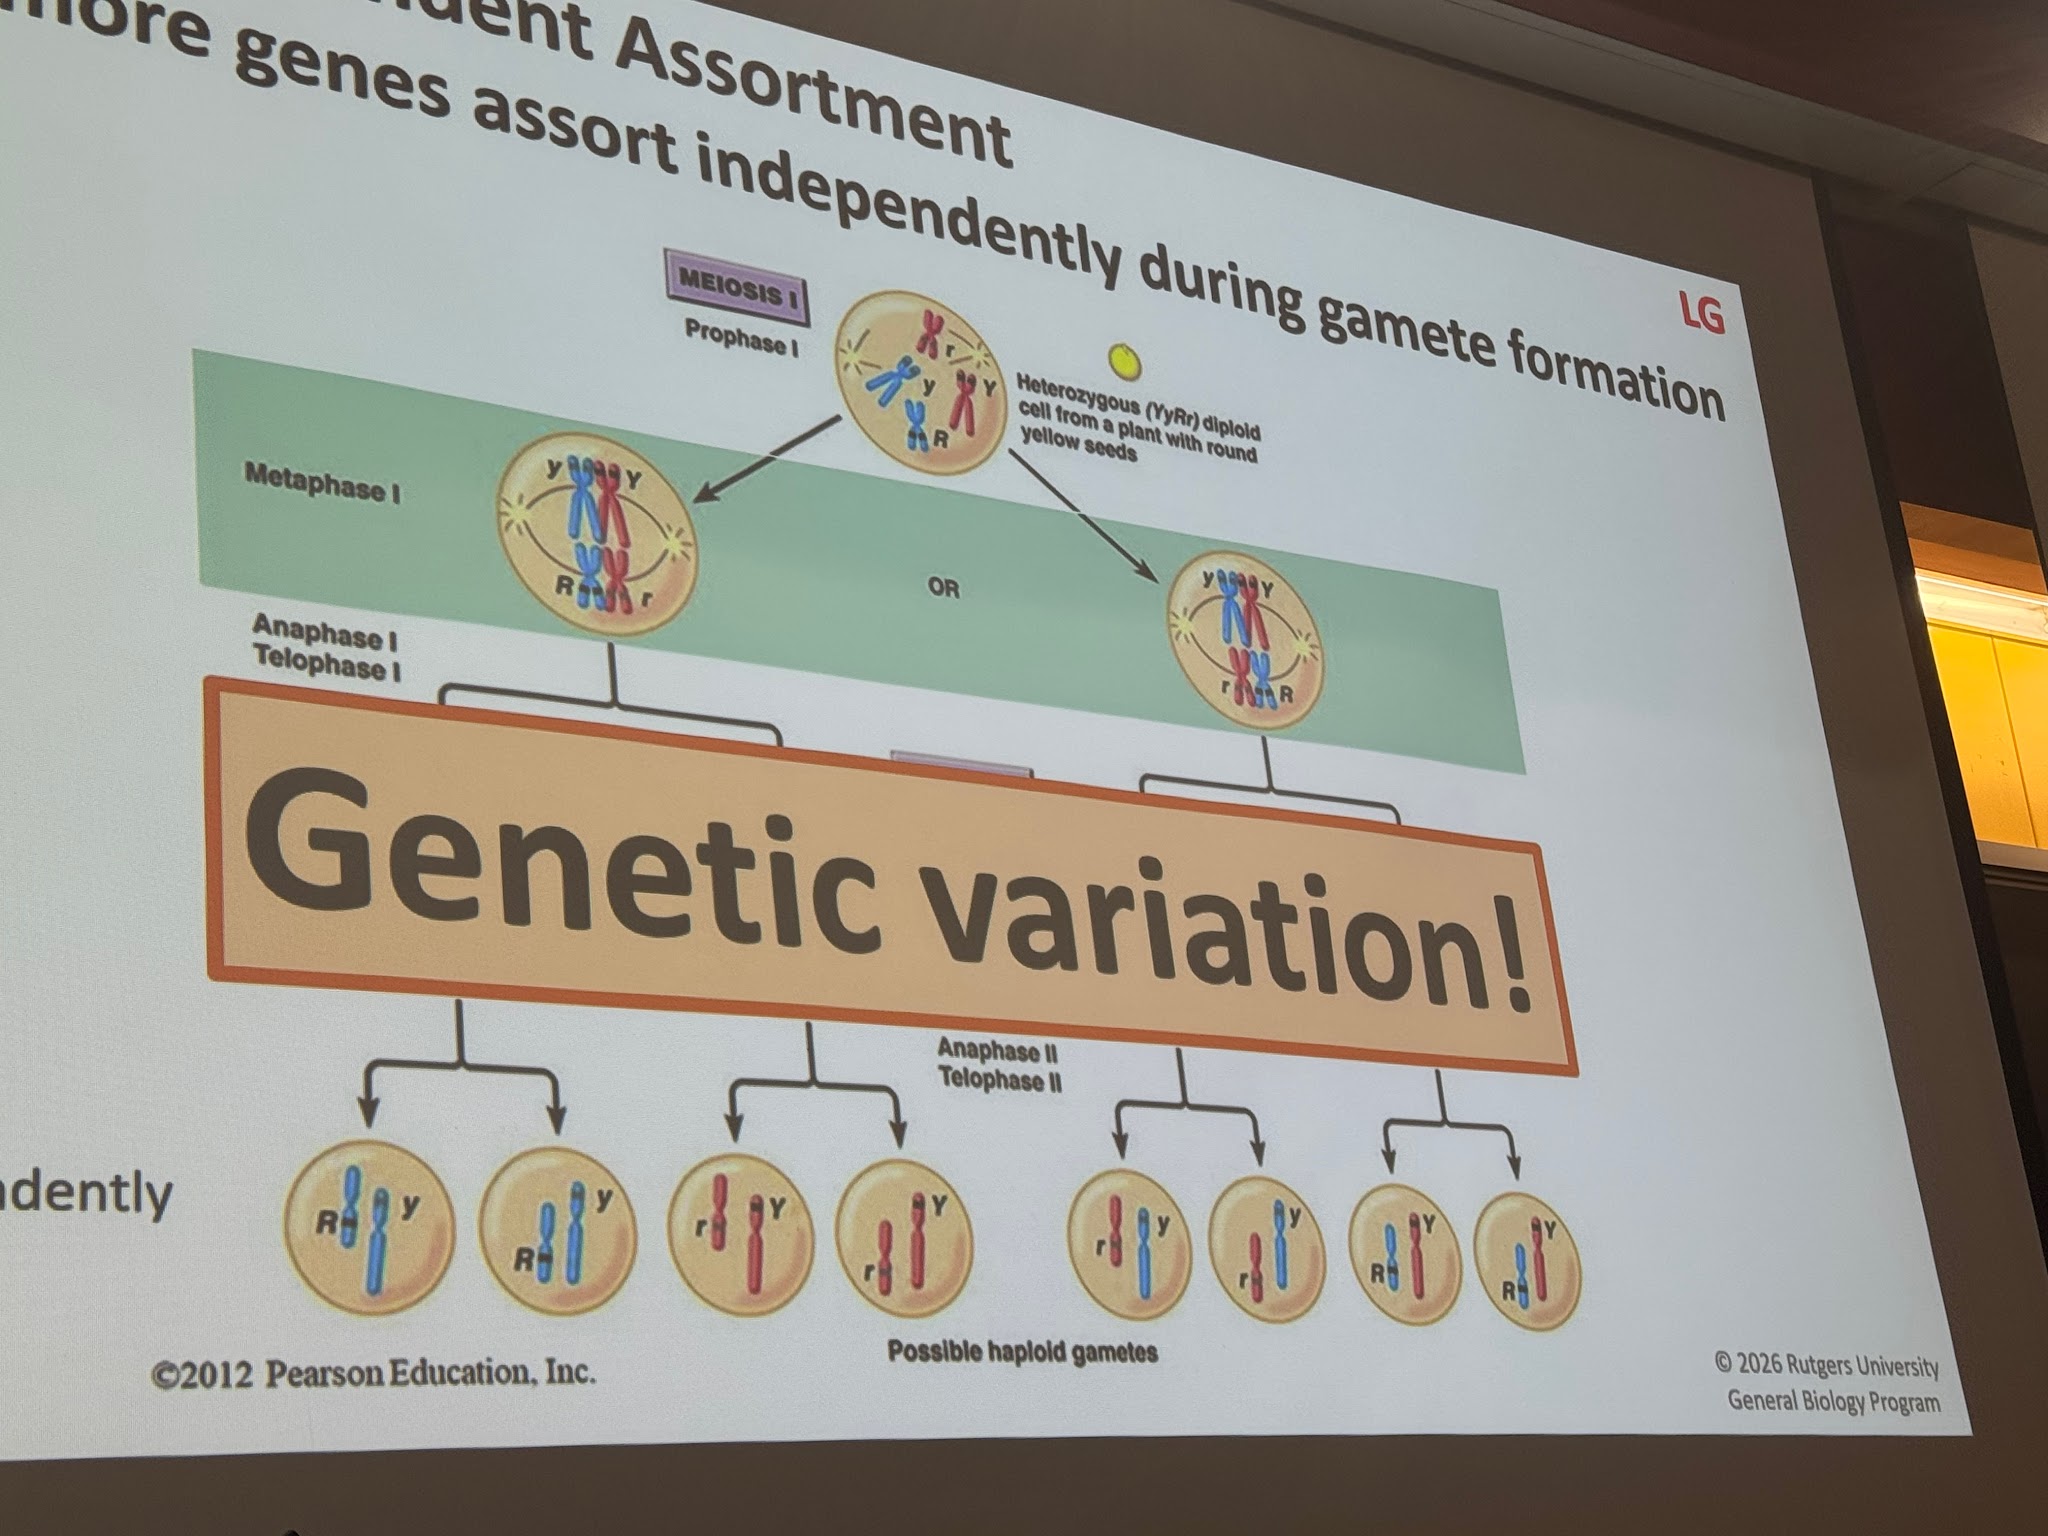
Crossing Over
+
Independent Assortment
=
LOTS of genetic variation
Basis of Mendel's law are in meiosis
Genetic crosses
Mate 2 individuals and observe offspring
Basic steps when doing a cross:
- Determine parent genotypes
- Determine possible gametes for each parent
- Determine possible gametes in the offspring
- calculate the frequency (freq) of each possible genotype
Punnet square
Predicts allele composition of offspring from cross of individuals of known genotype
EX: Parent 1 genotype = Bb
EX: Parent 2 genotype = Bb

Possible gametes for each parent
Possible genotypes is the offspring
Freq of each possible genotype
DETERMINE % OF EACH POSSIBILITY
Monohybrid cross
Cross between parents with different alleles at a single locus
Key points
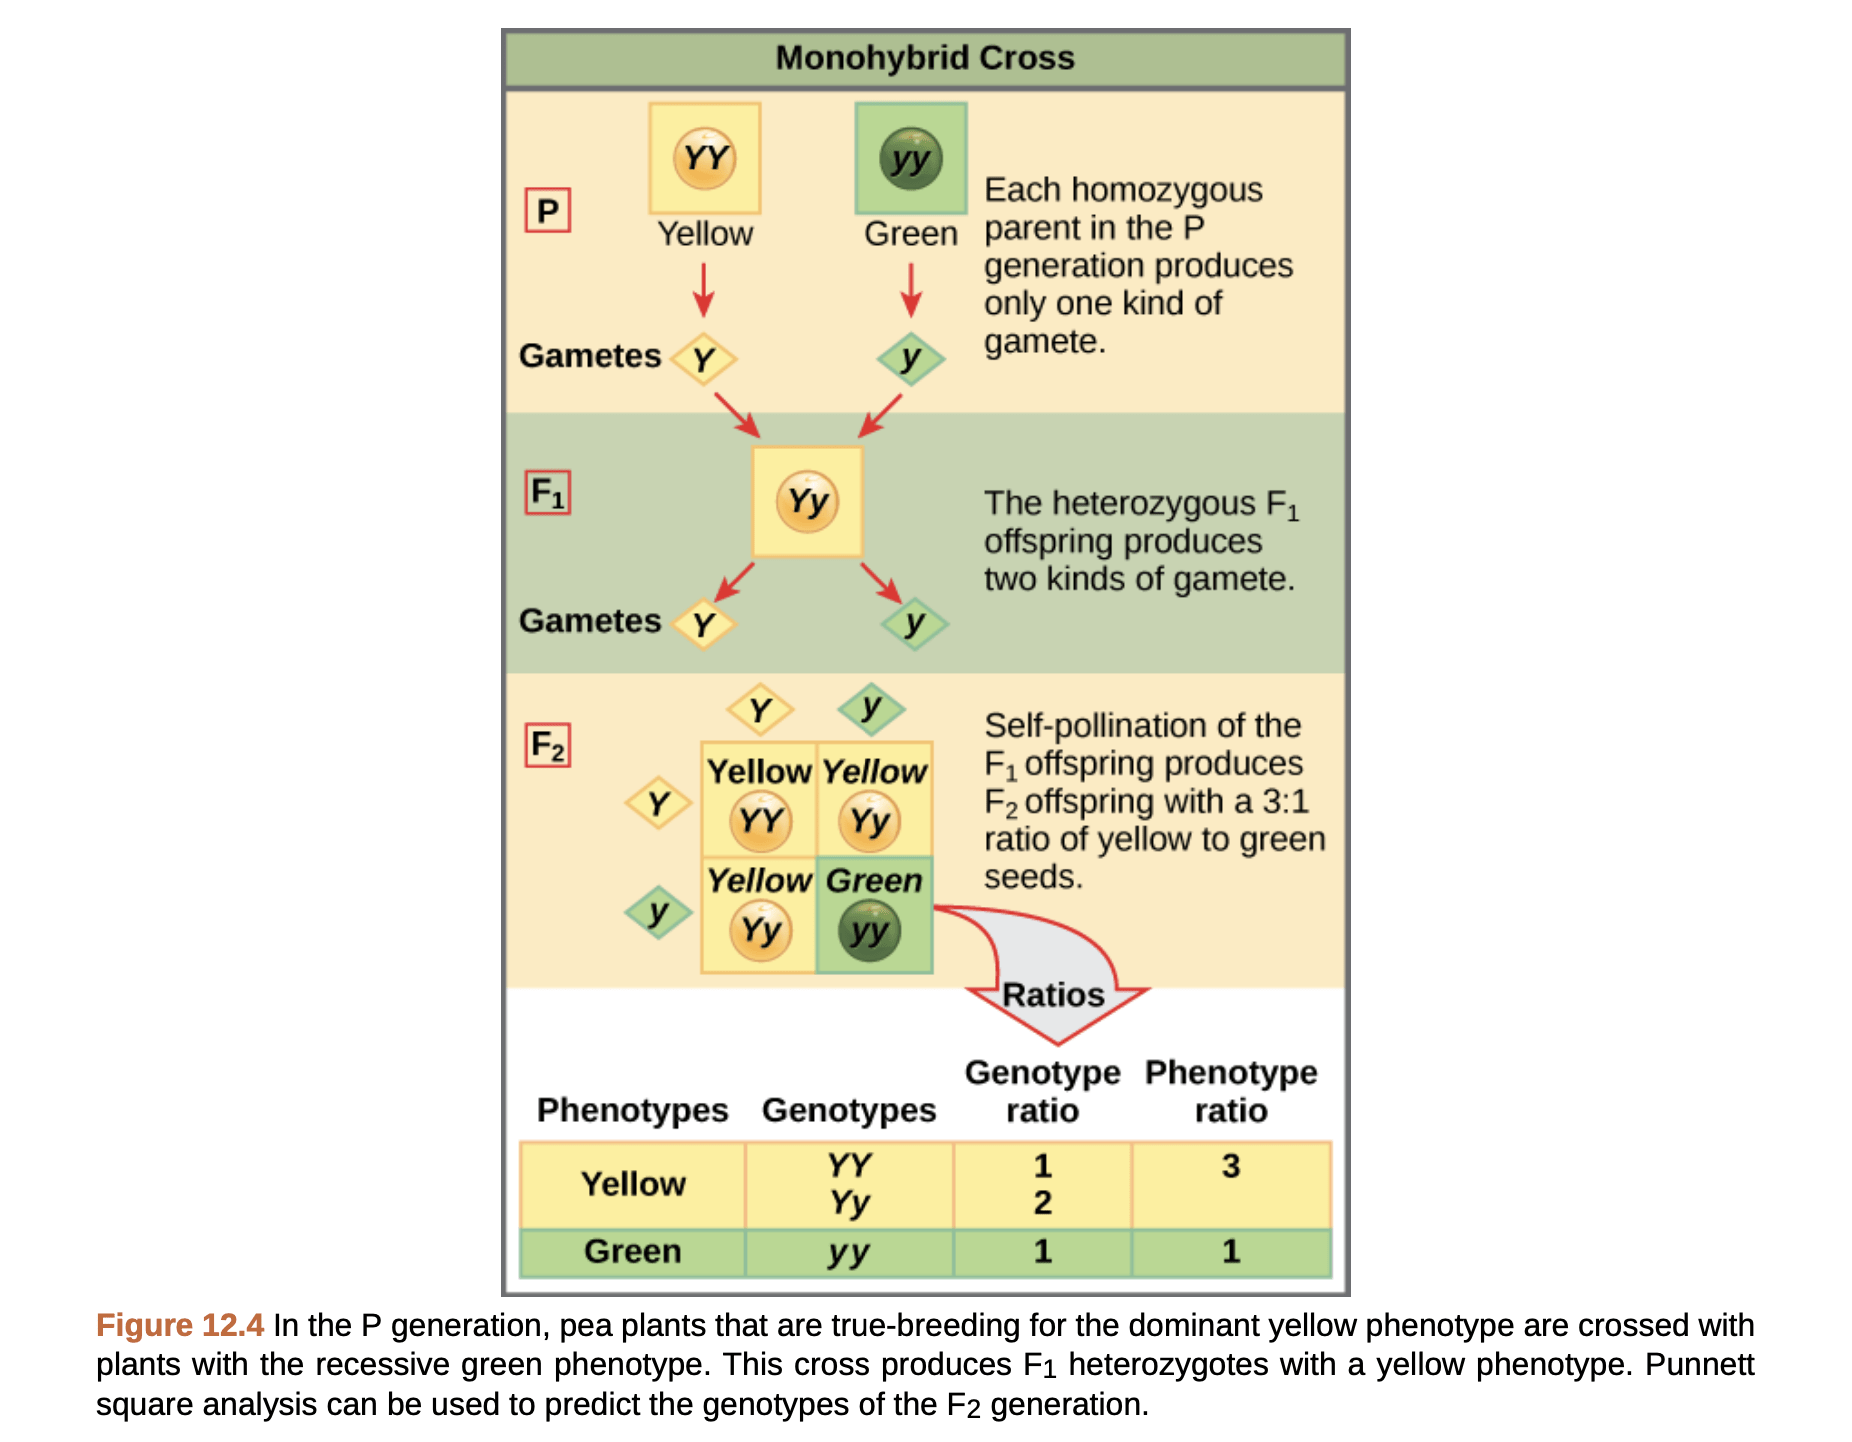
P
|
|---|
F1
|
|---|
F2
Phenotype | Genotype | Genotypic Ratio | Phenotypic Ratio |
|---|---|---|---|
Yellow | YY Yy | 1 2 | 3 |
Green | yy | 1 | 3 |
C. Dihybrid cross
Follows 2 characters
How mendel derived law of independent assortment (2nd law)
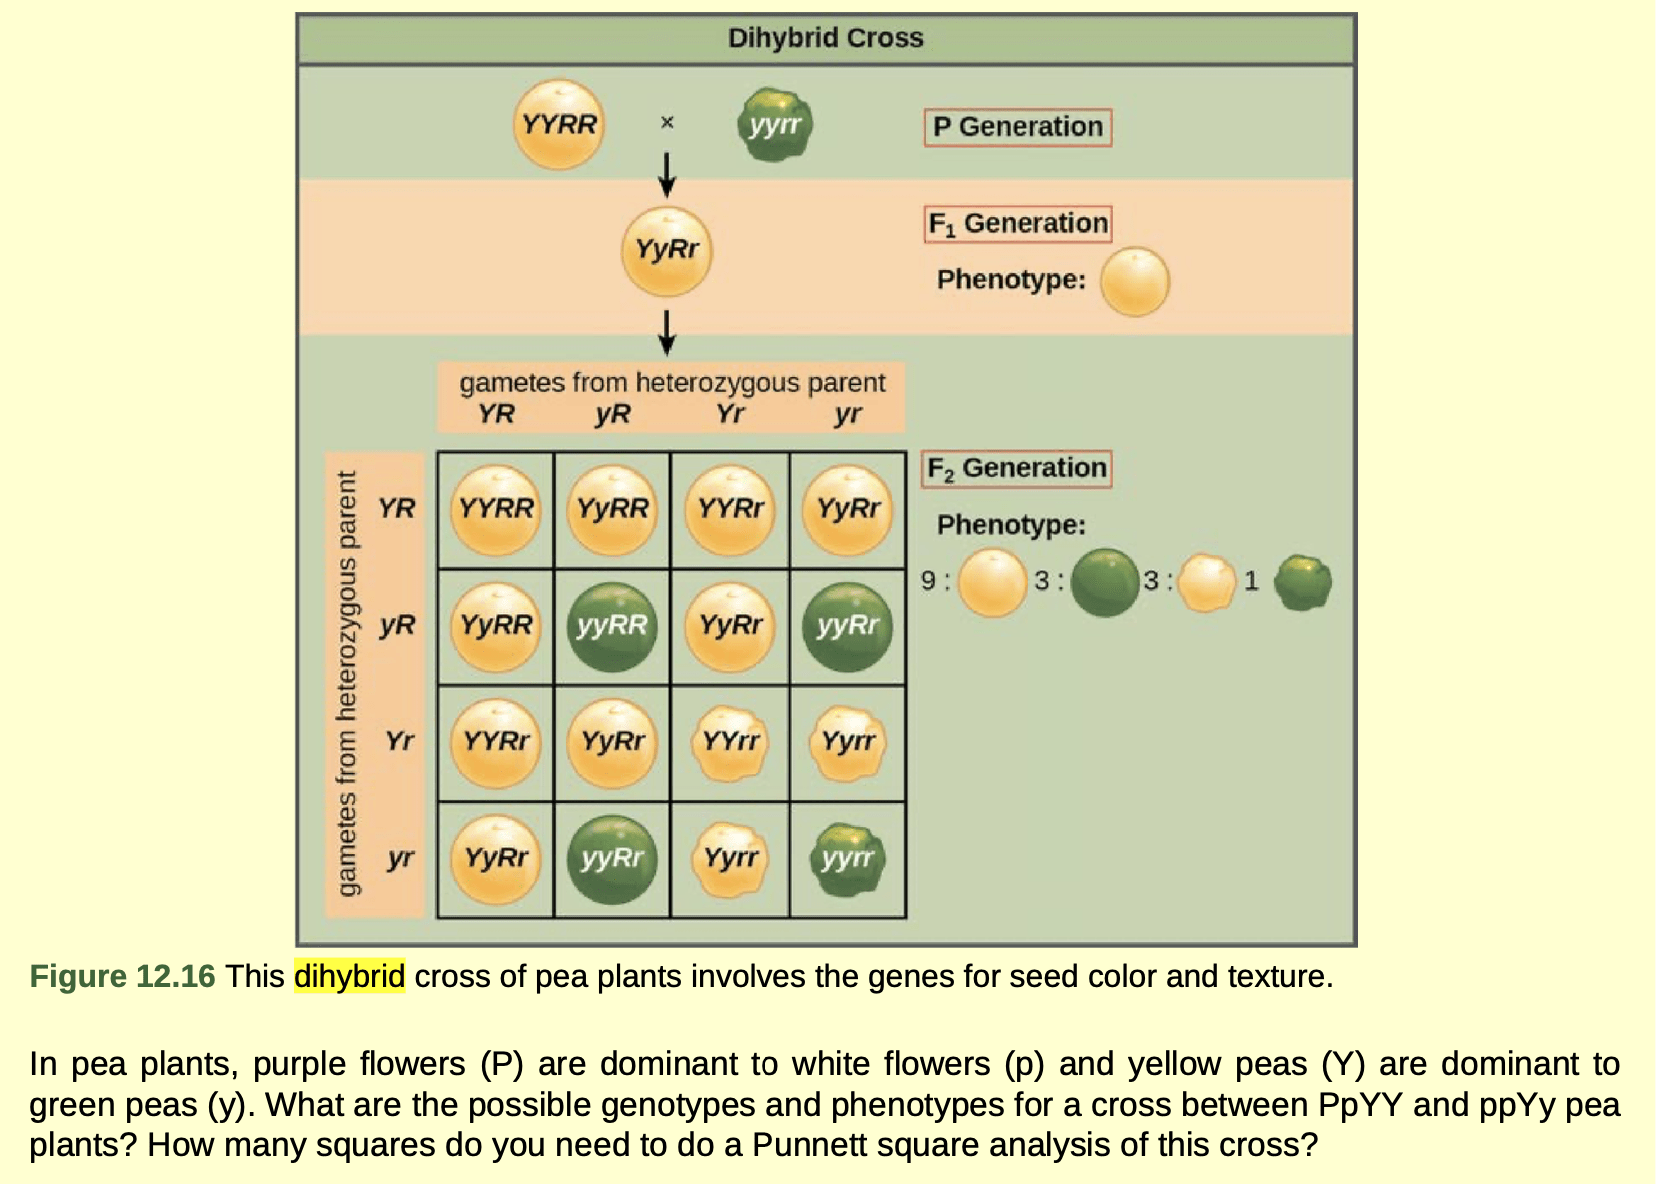
P: True breeding
F1: Dihybrid and dom phenotype
Gametes
F2: 9:3:3:1
Only if alleles are on different pairs of homologs
Imagine you are performing a cross involving seed color in garden pea plants. What F1 offspring would you expect if you cross true-breeding parents with yellow (Y) seeds and green (y) seeds? Yellow seed color is dominant over green.
Step 1: Determine parent genotypes
Step 2 Determine parent gametes
Step 3: possible offspring (F1) genotype
Step 4: Freq of each possible F1 Genotype?
Yy= 100%
What is the phenotype of offspring?
Yellow seeds
Probability in genetics
Solve genetics problems without a punnet square
Prob of an event = expected freq
Certain not to occur -> Prob = 0 = 0%
Certain to occur -> Prob = 100 = 100%
Multiplication rule for independent events
Occurrence of one event does not affect prob that other event will occur
P(this) and P(that)
Multiply separate probabilities
EX of multiplication rule: What is the possibility that two heterozygous parents will have a child that is homozygous recessive?
Parent Genotype? Bb and Bb
Parent Gametes? ½ B and ½ b ½ B and ½ b
Offspring genotype? bb
P(bb) = P(b from mom) and P(b from dad) 25%
Addition rule for mutually exclusive events
13: Chromosomes
I. chromosome theory of inheritance
Background
1880’s - 1902
Chromosomes discovered
Process of mitosis observed
Mendel’s work rediscovered
Process of meiosis observed
All of above is in CTI:
Genes are on chromosomes at specific loci
behavior of chromosomes during mitosis explains how traits are passed
B. Thomas Morgan
Early 1900’s
Experimental organism
Drosophila melanogaster (fruit fly)
Advantages
Inexpensive, easy to maintain
100’s of offspring every 2 weeks
Many identifiable traits
Easy to control matings
Total of 4 pairs of chromosomes
3 pairs are autosomes
1 pair of sex chromosomes
Traits
Wild type
Phenotype most common in natural pops
Mutant phenotypes
Alternatives to wild type
Symbolizing allele
Gene given symbol for 1st mutant observed
Ex. eye color in fruit flies
Red (wild type)
w+
White (mutant) (unusual)
w
The w’s are the alleles for eye color gene
Usually have red eyes (wild type)
Morgan found white-eyes male (mutant)
Experient:
Red-eye female x white-eye male
3. Morgan’s experiment (in LG)
All white eyes = male. Why??? Eye color gene located on X chromosome
II. Sex chromosomes
Introduction
Autosomes (fig. 10.3)
Non sex chromosomes
Homomorphic (same shape)
Sex chromosomes
One pair
Heteromorphic (diff. shape) (x is longer, y is shorter)
During meiosis
Synapse (come together)
Crossing over can occur (Prophase 1)
Major sex determining genes and other types of genes
Sex-linked gene
On a sex chromosome
3. Sex determination in humans
In LG
*all cells have sex chromosomes
B. X-linked genes
Males
Only one X
X-linked alleles
Not homozygous or heterozygous
Hemizygous
Every allele on X is expressed
Regardless if dom or rec
Females
2 copies of X
During embryonic development
One X in each cell inactivated by DNA methylation (CH3)
Random process
Barr body
The inactive X chromosome
Stains darkly, condensed
Along inside of nuclear envelope
If female is heterozygous (XAXa) *Alleles in superscripts
Some cells, XA inactivated
Other cells, Xa inactivated
Ex. in LG
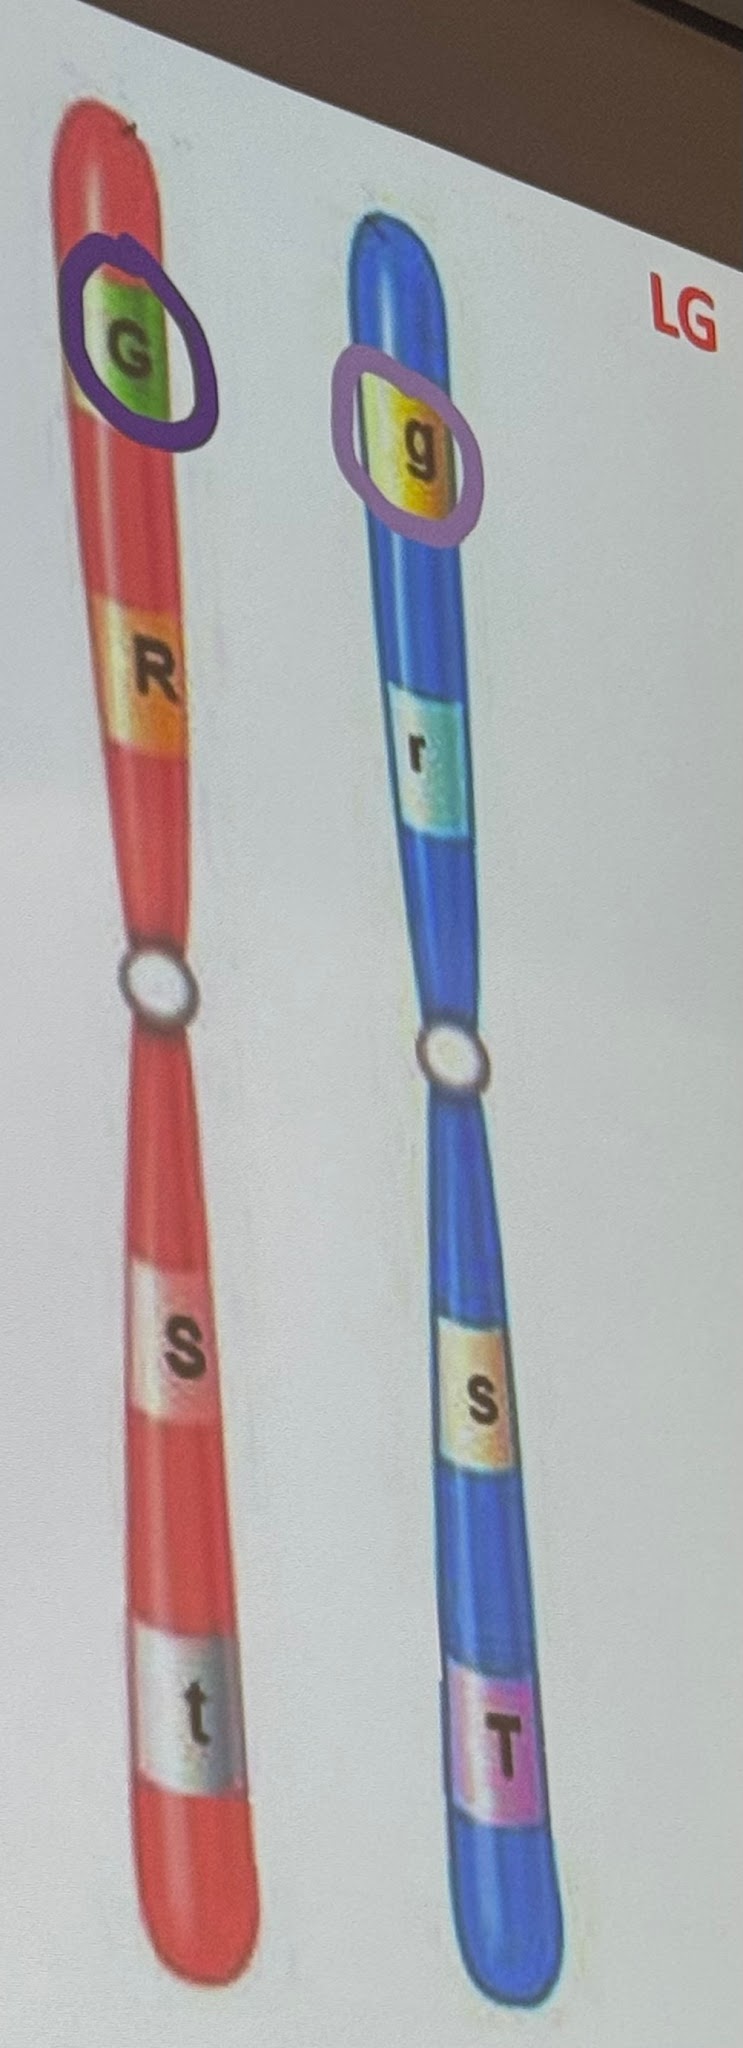
III. Linkage (In LG)
Unlinked genes
Located on diff chromosomes
Assort independently
B. Linked genes
On same chromosome
Ex. Humans
~20,000 genes on 23 homologous pairs
Many genes on each chromosome
Linkage
Tendency for group of genes on same chromosome to be inherited together
Violates law of independent assortment (Mendel’s law)
14: DNA
DNA is the genetic material
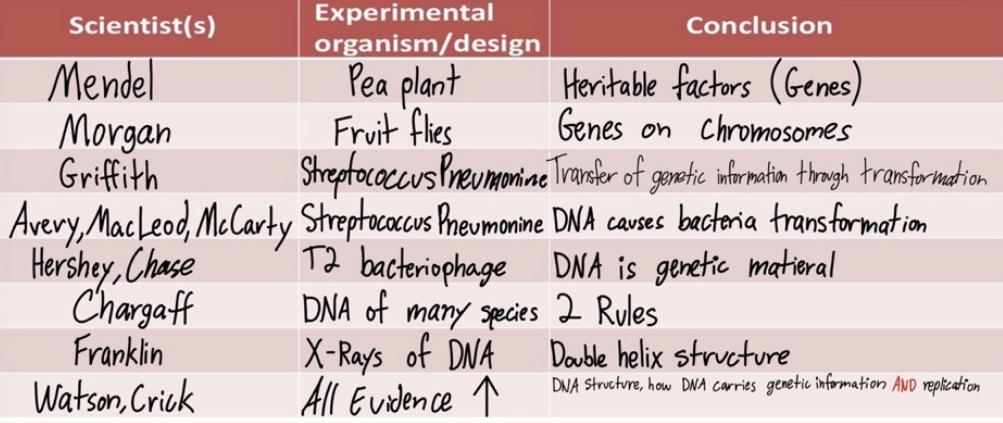
Chromosomes have 2 things
DNA: 4 nucleotide
Proteins: 20 amino acids
So where do GENES come from??????
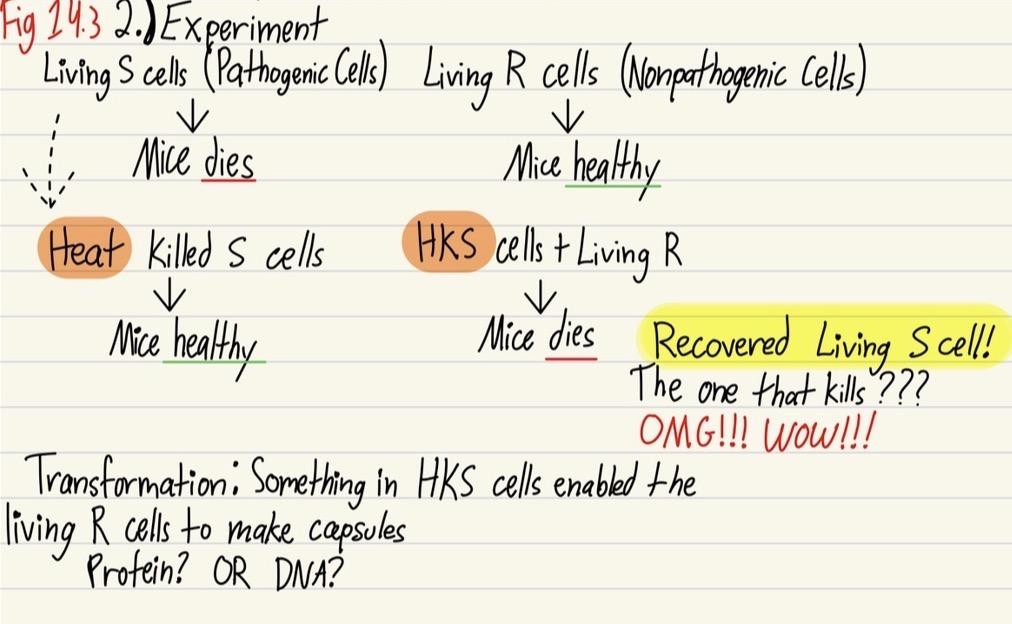
A. Griffith (1928)
1.) Streptococcus pneumoniae
Two strains
a. Smooth (S) strain
Colonies: Smooth, shiny (cell lumps)
Capsule: → Protects from immune cells
Virulent: Mice DIE
b. Rough (R) strain
Colonies: Rough
Capsule: Immune cell engulf and destroy R cells
Avirulent: Mice LIVE!
B. Avery, MacLeod, and McCarty (1944)
Lysed cells (broken apart) ↓
Separated into
a. Polysaccharides
b. Lipids
c. Proteins
d. Nucleic Acids
Tested each for transforming ability
Only DNA could transform
Everyone else said there could be protein contamination or only for prok. not euk.
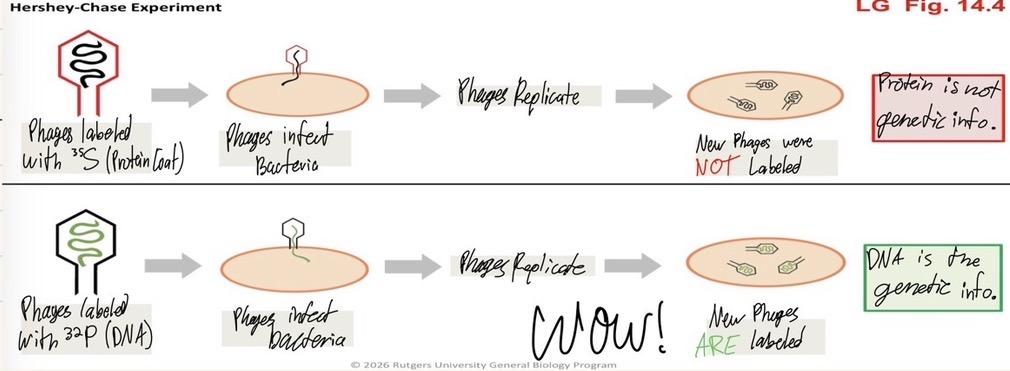
C. Hershey/Chase (1952)
T2 bacteriophage (phage) (eats bacterium)
a. Virus
b. Infects bacteria and then replicates
c. DNA core with protein coat
Purpose
Is protein or DNA the hereditary material??
↓ ↓
Sulfur (S) Phosphorus (P)
II. DNA Structure
A. Nucleotide structure
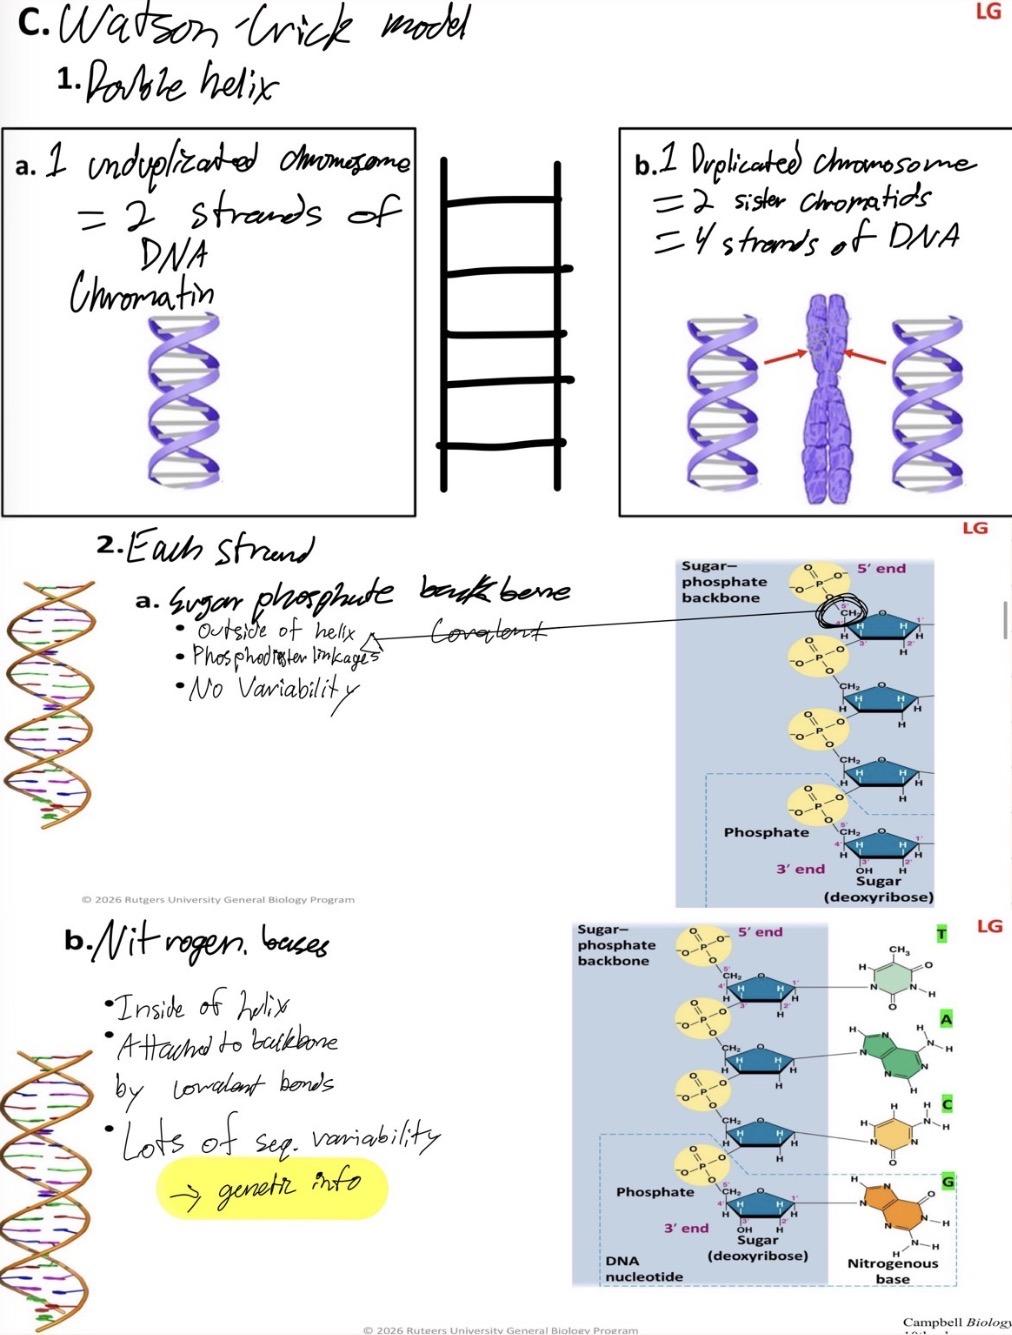
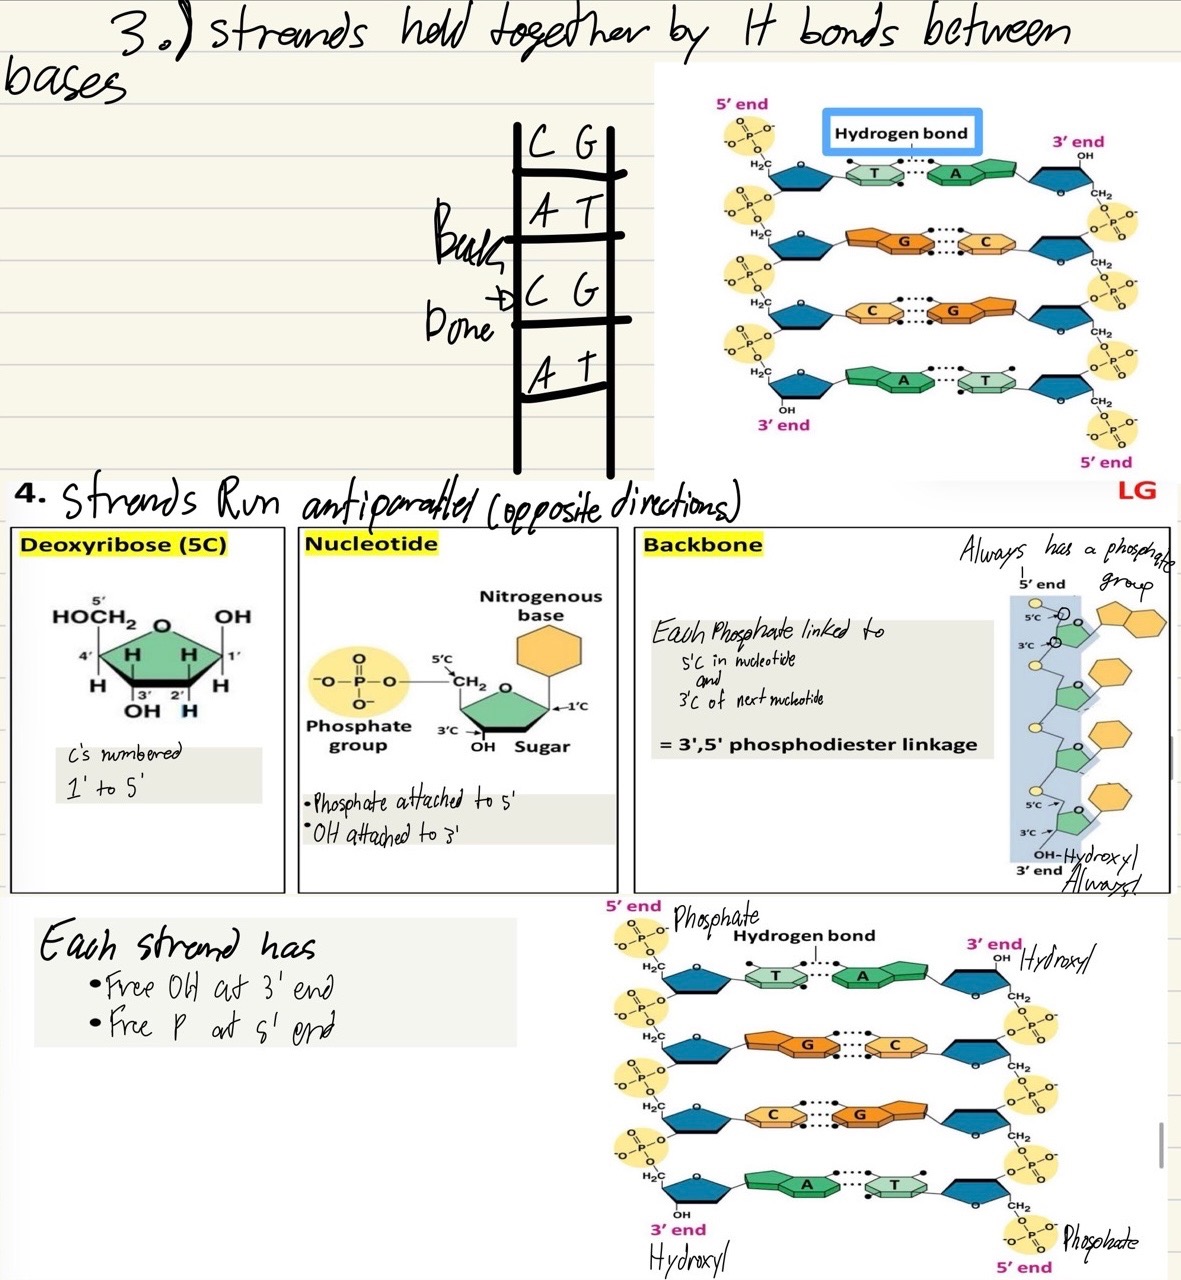
1) Each contains
Phosphate group
Sugar deoxyribose
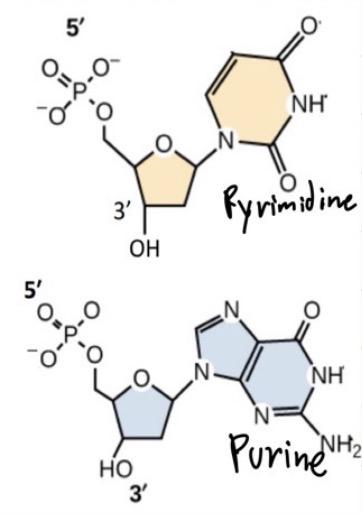
Nitrogenous base
2.) Bases
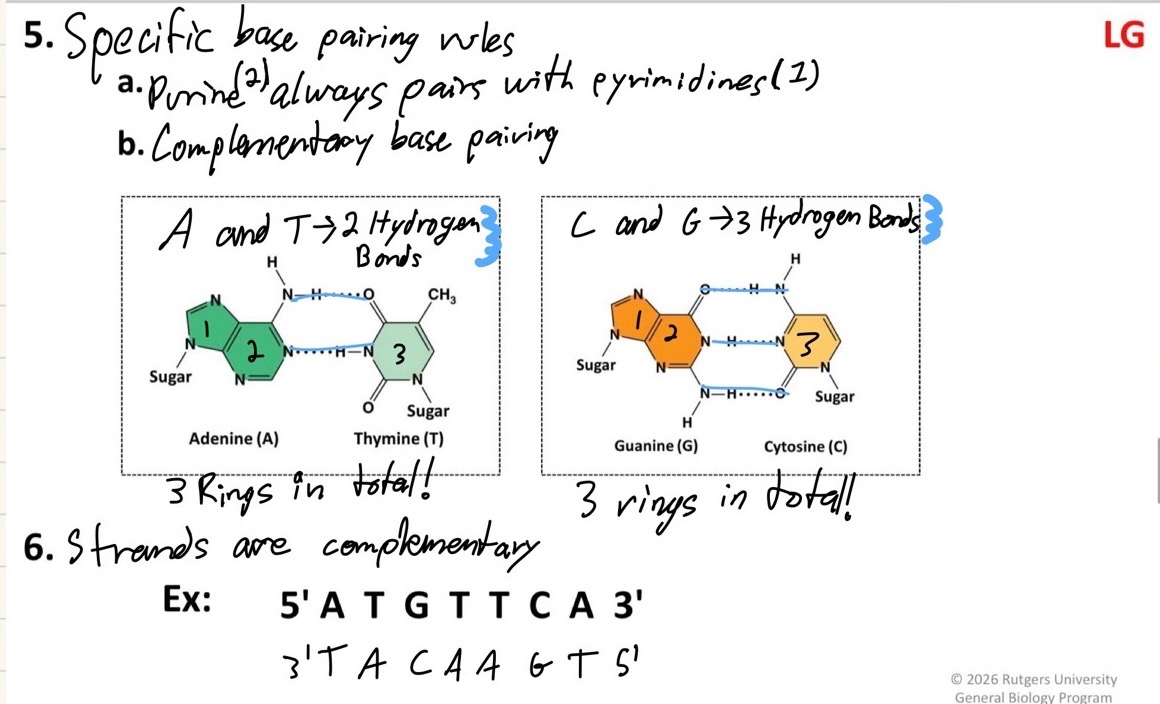
Purine
- 2 Rings
- Adenine and Guanine
Pyrimidine
- 1 Ring
- Cytosine and Thymine
B. Determining DNA structure
1.) Edwin Chargaff (1949)
Amounts of each base in many organisms
2 Rules
a. Total purines = Total pyrimidines
A + G = C + T
b. Amount of A = Amount of T (1:1)
Amount of C = Amount of G (1:1)
2.) Rosalind Franklin (1951–1953)
X-Ray diffraction → key features of DNA 3d structure
Helical
Bases on inside
Width is constant
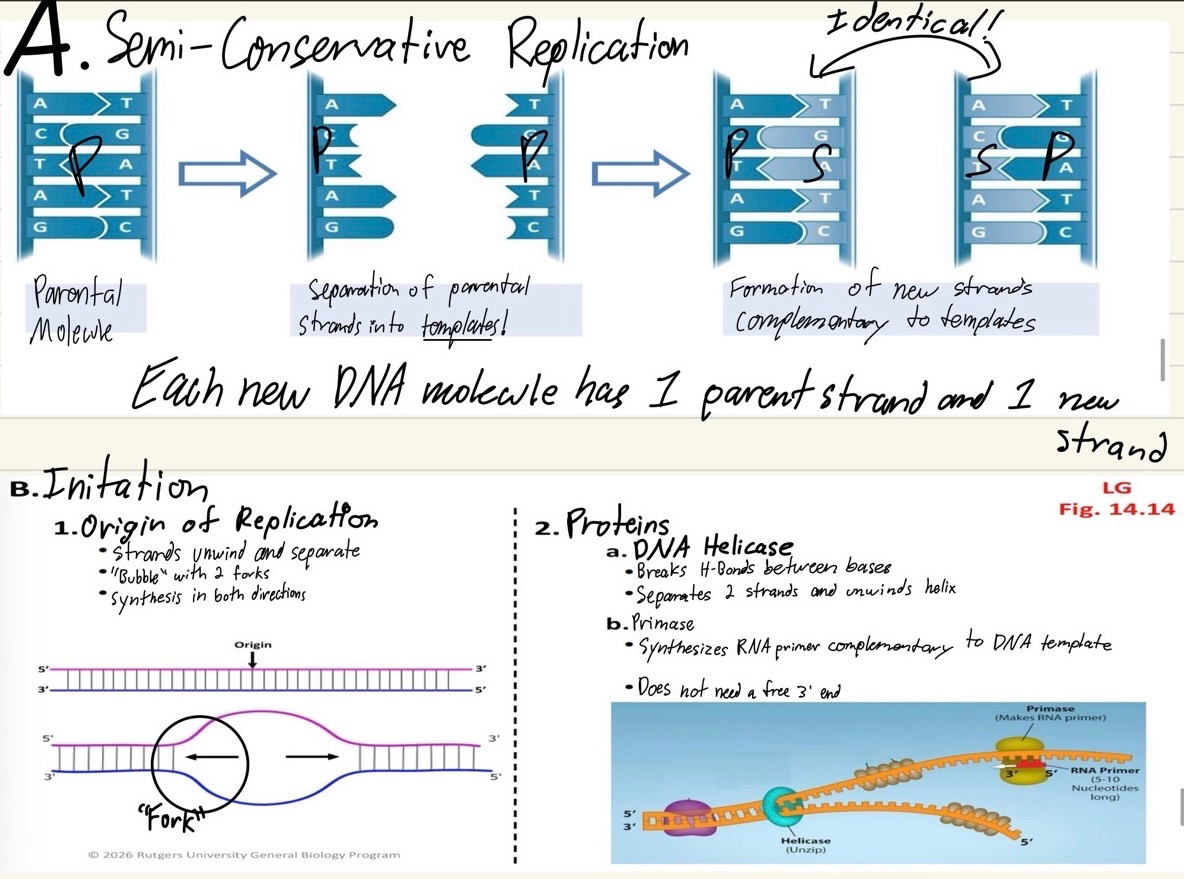
III. DNA Replication
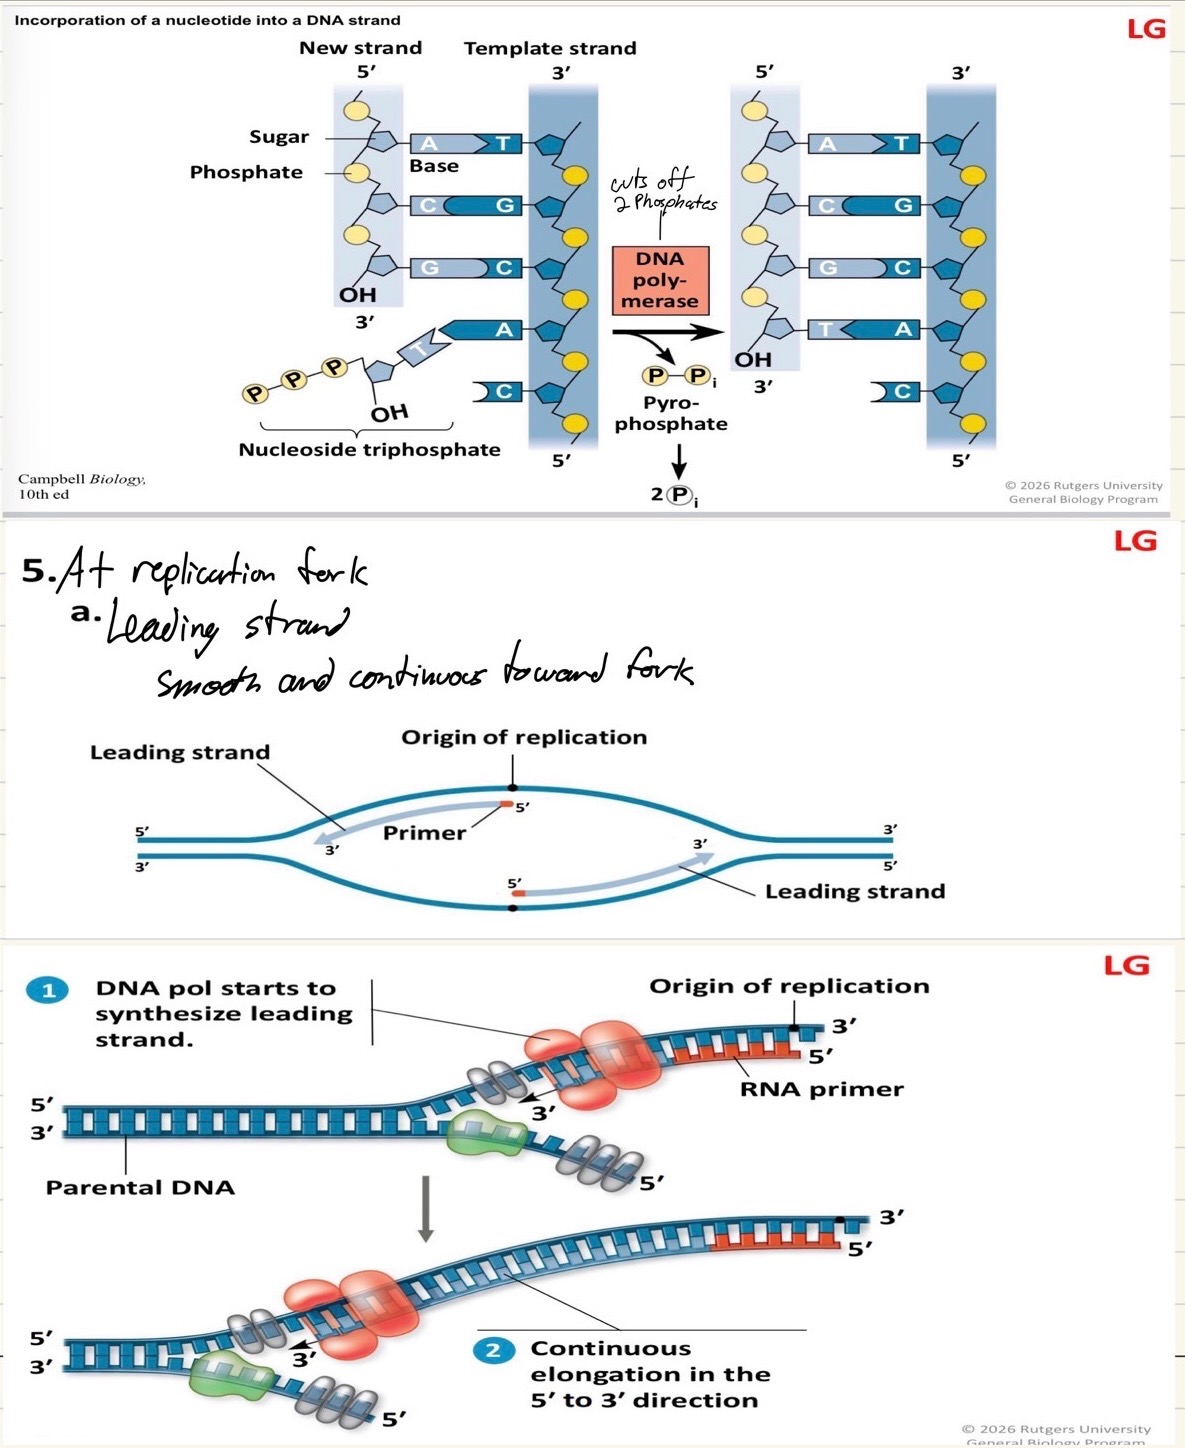
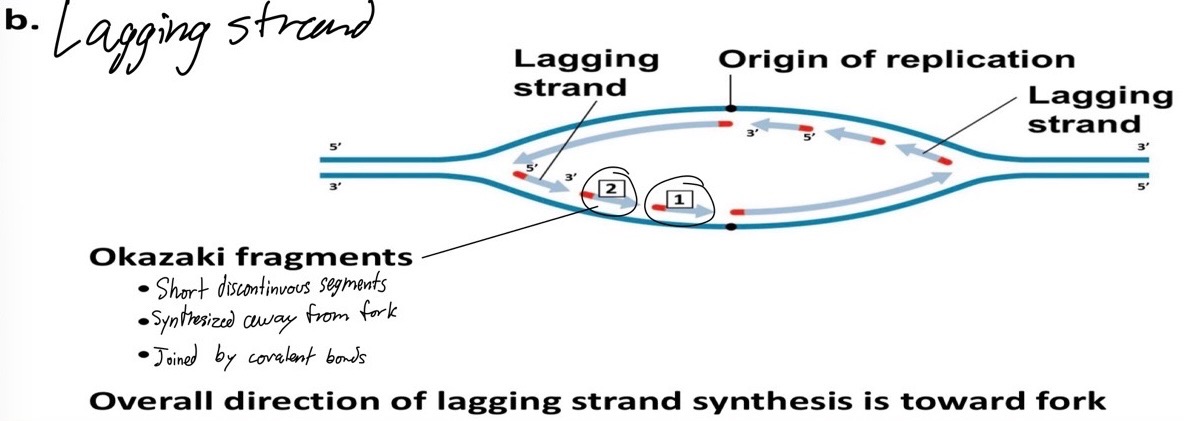
C. Elongation
Template read 3’ to 5’
Subunits are nucleoside triphosphate
(sugar + base) + 3 phosphate groups
Elongation is 5’ to 3’
DNA polymerases: Catalyze phosphodiester bond formation
a. Complementary
b. Can only add to 3’ end of existing strand
15: Gene Expression
I. Relationship between genes and proteins
Review
Genes
On chromosomes
DNA
Info for making polypeptides NOT protein, but eventually yes
A. Central Dogma – Crick, 1958 (Watson/Crick)
Unidirectional flow of genetic information
DNA → transcription → RNA → translation → Polypeptide
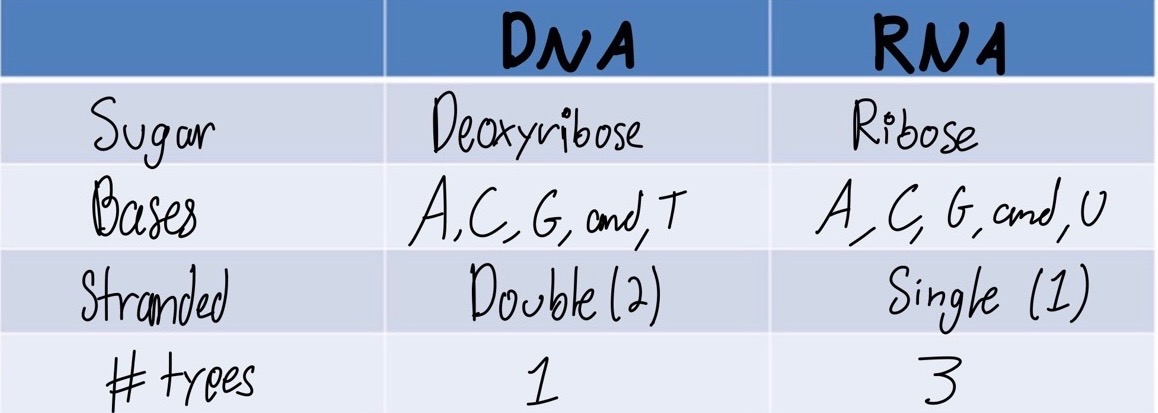
2.) Single stranded (ss)
3.) Types
mRNA (messenger)
Encodes entire polypeptide (Instruction sheet for aa)
rRNA (ribosomal)
Structural part of ribosome
tRNA (transfer)
Brings aa’s to ribosome during translation
CC DNA and RNA
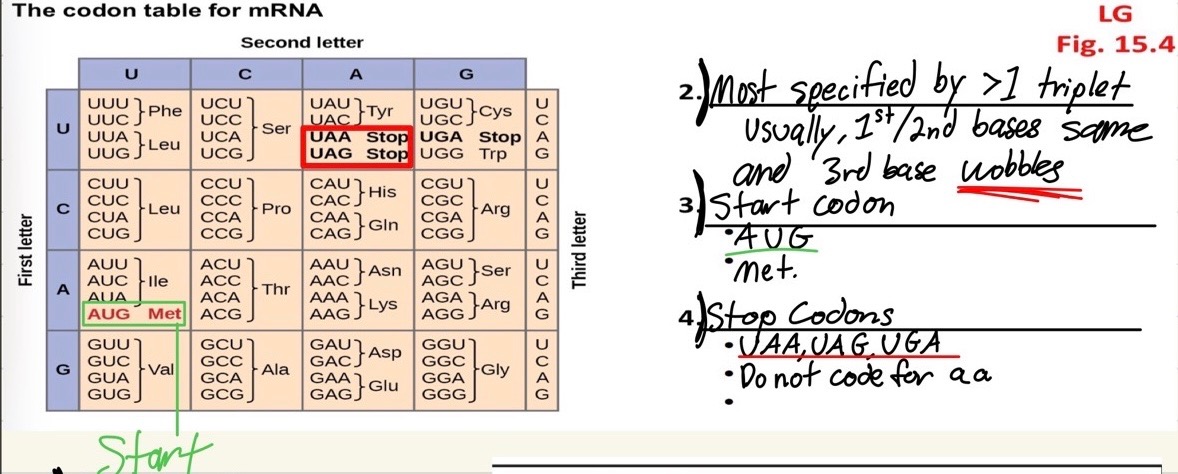
C. Genetic Code
mRNA = “language”
Codons = “words”
1.) Codon
mRNA sequence
Triplet (3 bases) A, C, G, or U (NOT “T”)
Codes for 1 aa
64 different combinations
4 × 4 × 4 = 64 possible
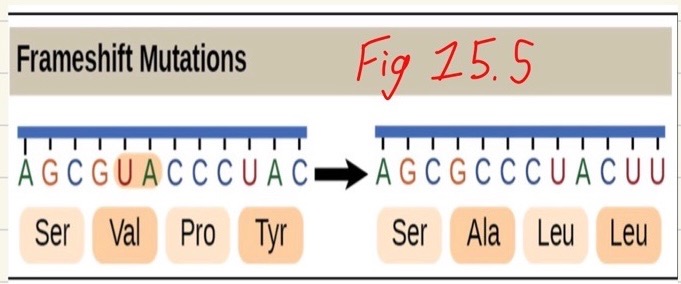
5.) Reading frame
Correct grouping of codons
(the red dog ate the bug)
→ the red oga tet heb ug
6.) Universal
– Prok, euk, and viruses → Not on tree of life
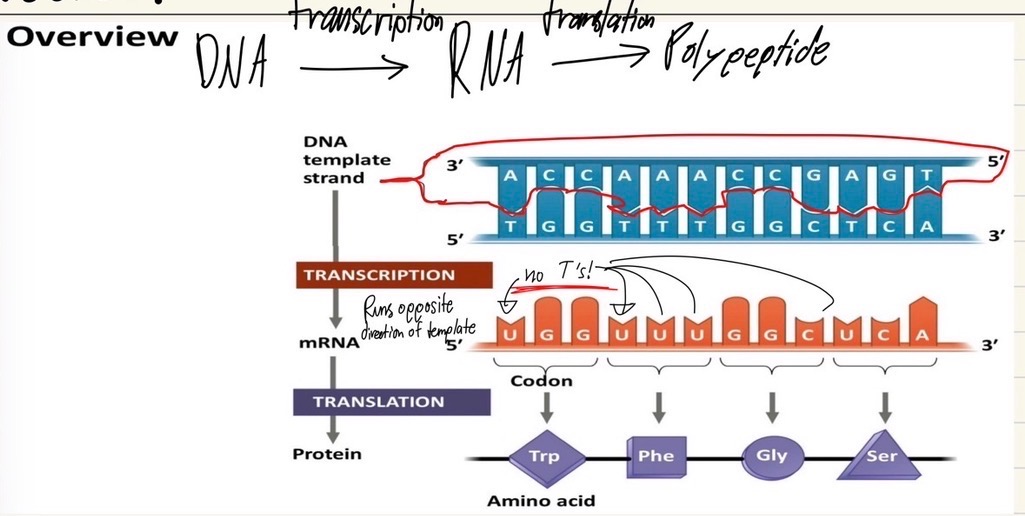
II. Transcription: DNA to RNA
• Synthesizes RNA that is complementary to DNA
• 3 Stages
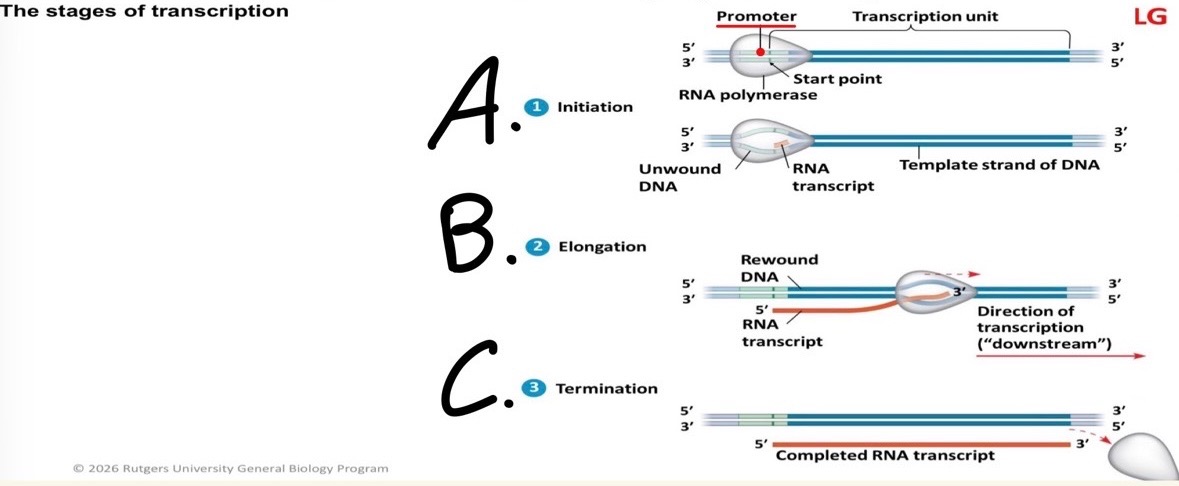
A. Initiation
DNA
Only template transcribed (read 3’ to 5’)
Transcription unit: DNA sequence that is transcribed
Promoter
Specific DNA seq at 3’ end (upstream) occurs downstream
Starts
RNA polymerase
Does not need a primer
Binds to promoter, unwinds helix (DNA), begins transcription
B. Elongation – RNA Polymerase
Reads DNA template 3’ to 5’
Synthesizes 5’ to 3’
Adds nucleoside triphosphate
Energy from hydrolysis of 2 Pi
Lots of energy in phosphate bonds
When broken, they release energy
C. Termination
Specific DNA sequences signal RNA polymerase to stop
RNA transcript released from template
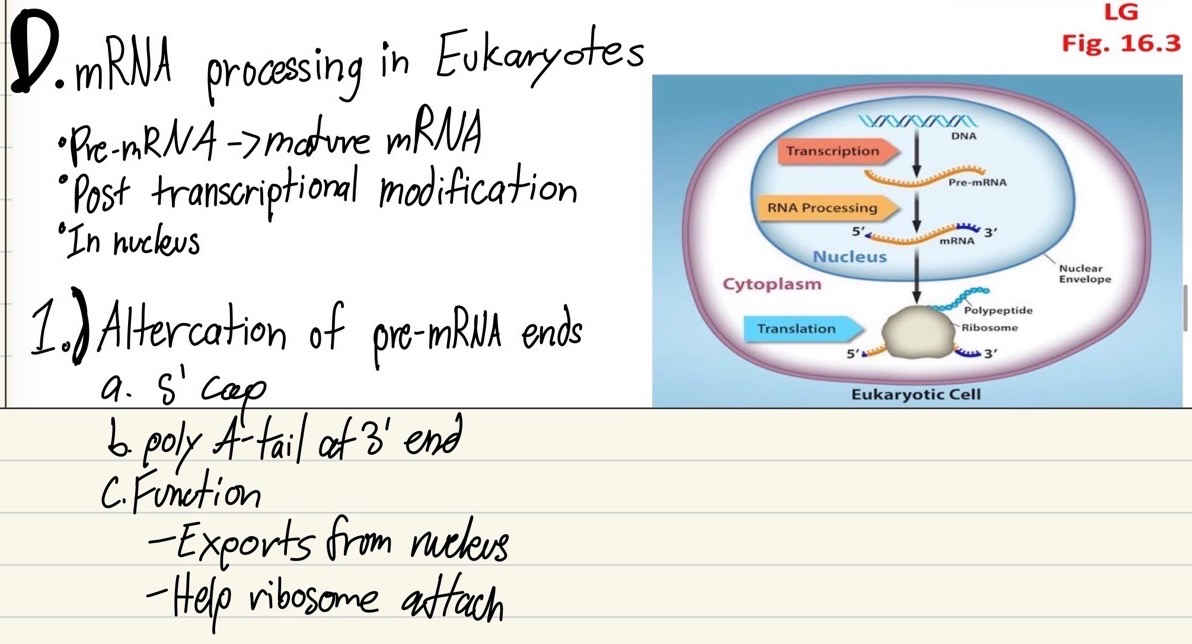
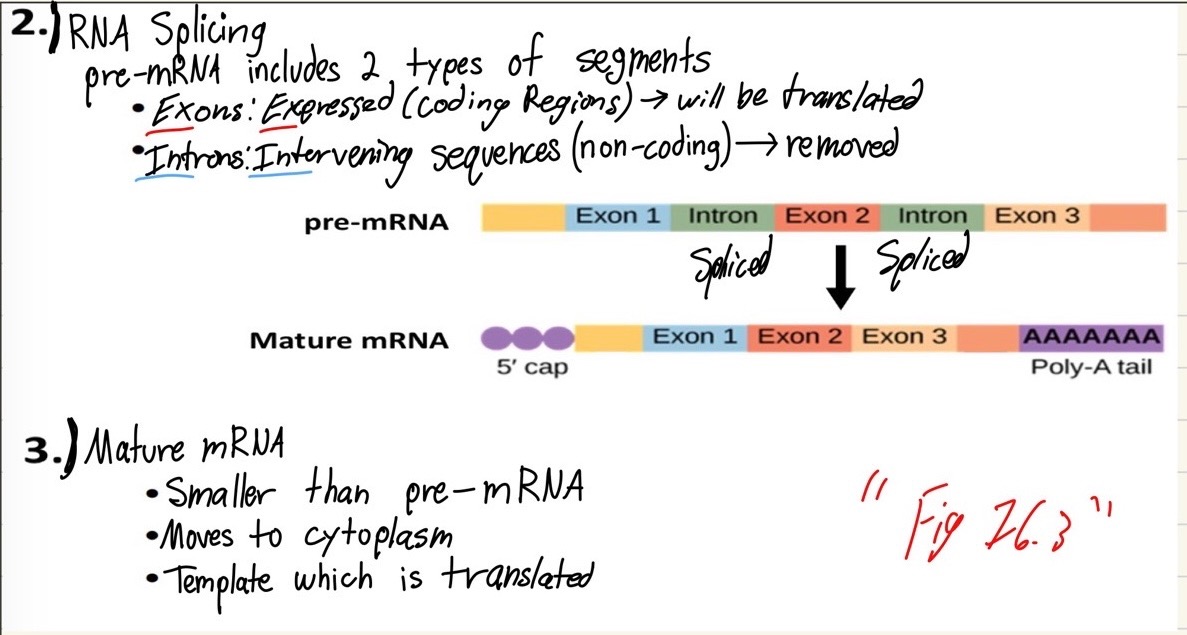
III. Translation: RNA to Polypeptide
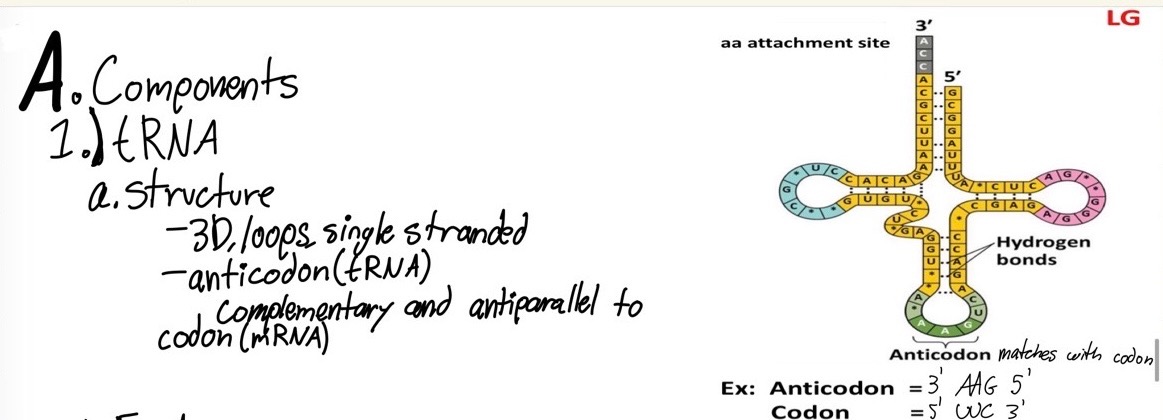
b) function
3’ end binds to specific amino acid (determined by anticodon)
Different tRNAs
Different anticodons bind different amino acids
Bring specific amino acids to the ribosome
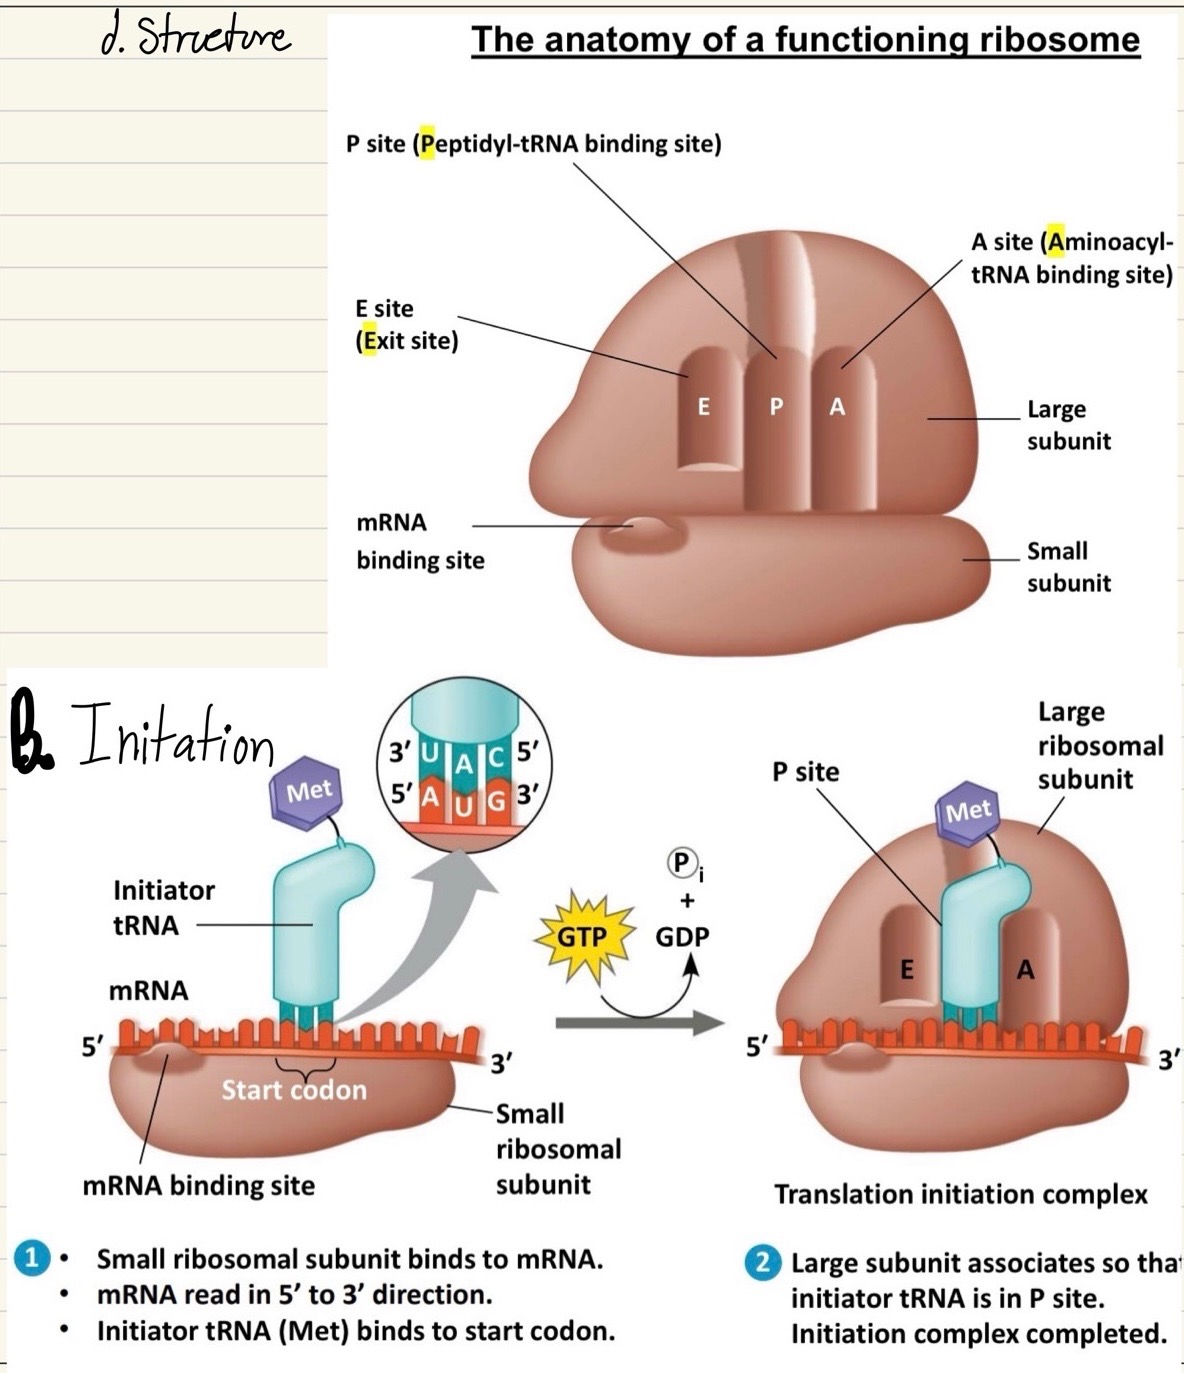
2.) Ribosomes
Compromised of…
Protein
rRNA
Location: Cytoplasm
Surface of RER
Function
Bind to mRNA
rRNA is a ribozyme (NOT ribosome)
Catalyzes peptide bonds
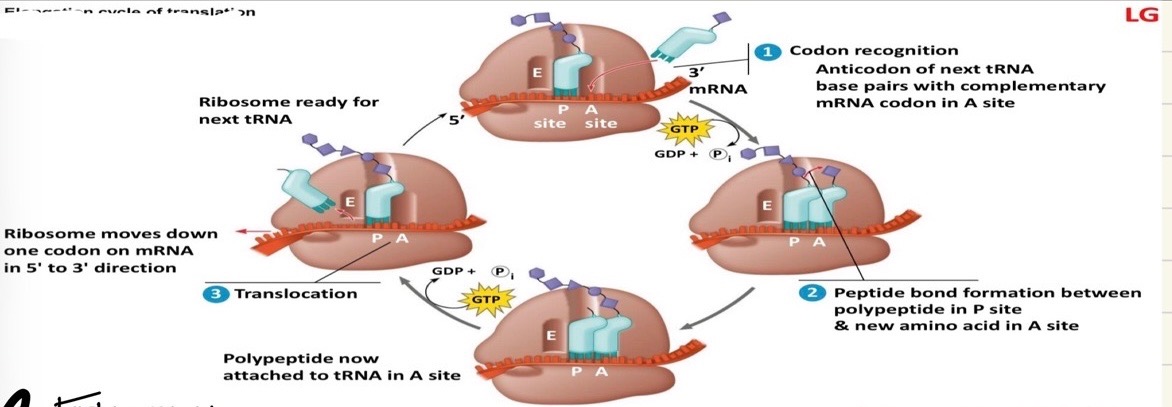
C. Elongation
Series of repeated cycles
Each adds single amino acid to growing polypeptide chain
1.) Large Subunit (ribozyme)
Catalyzes peptide bond formation
2.) Translocation
Ribosome moves down one codon on mRNA in 5’ to 3’ direction
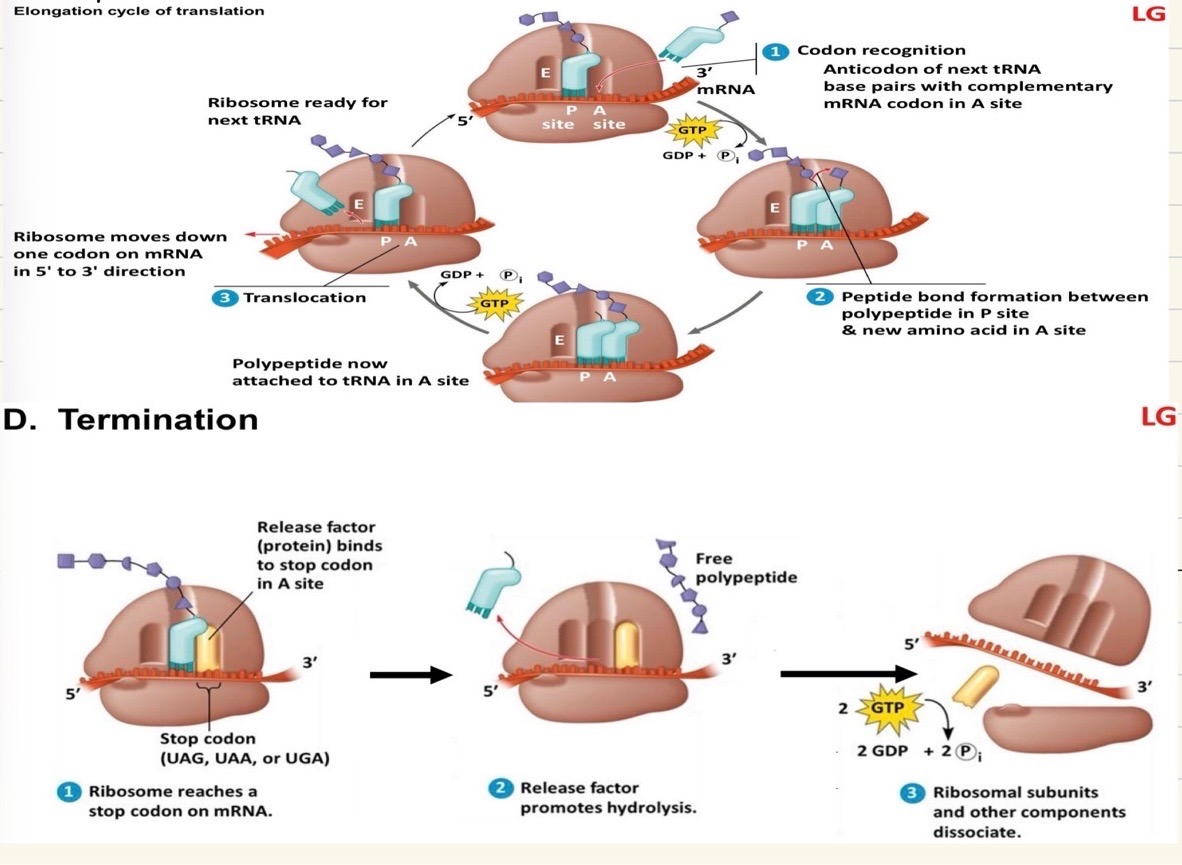
17: Gene Regulation
Types of Genes
1. Constitutive
“Housekeeping”
Constantly transcribed → RNA always being created
Proteins always needed
Example: enzymes for respiration
2. Regulated
Transcribed only at certain times or in certain cells
I. Prokaryotic Gene Regulation
Transcriptional level
Information in DNA → information in RNA
Operon
Set of genes controlled as a unit
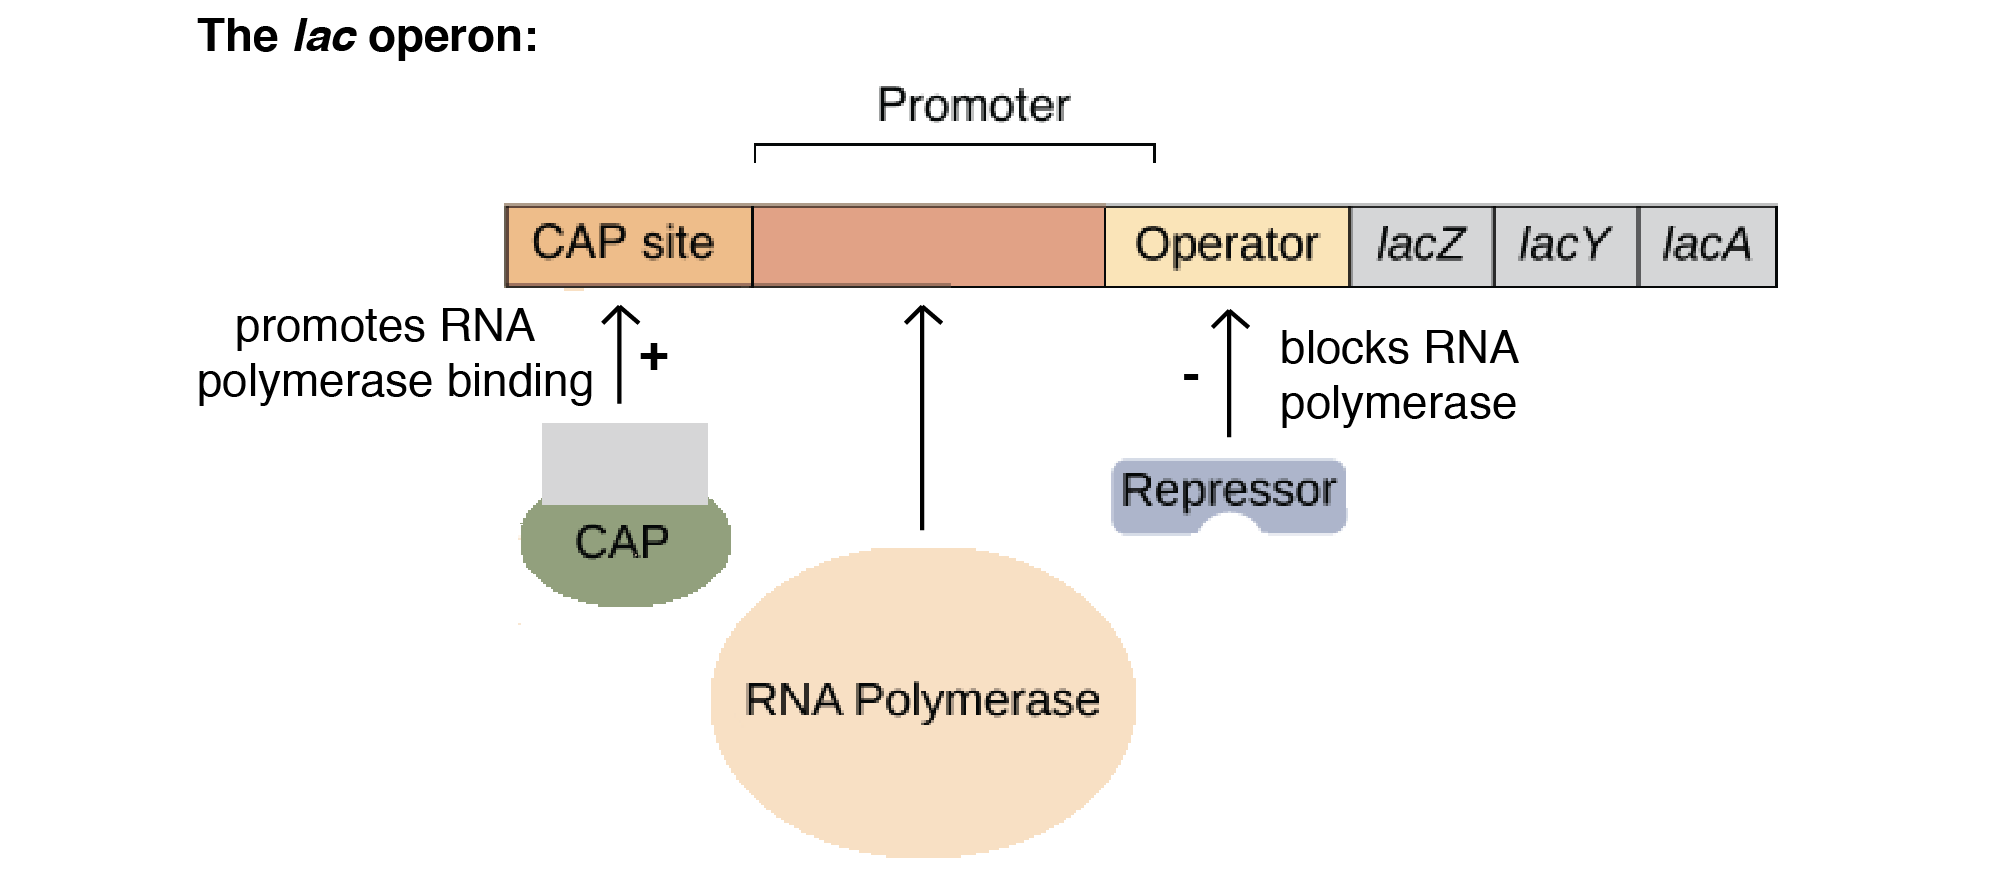
A. lac Operon
Lactose metabolism in Escherichia coli
E. coli live in the human large intestine
Adjust to changes in chemical environment
If host drinks milk, E. coli digests lactose
1. Components
a. Promoter
DNA sequence
Not transcribed
RNA polymerase binds
b. Operator
DNA sequence
Not transcribed
Binding site for repressor
“On-off” switch
c. 3 Structural Genes (transcribed)
lacZ: β-galactosidase (β-gal)
Lactose → glucose + galactose
lacY: Permease
Transmembrane carrier
Transports lactose into cell
lacA: Transacetylase
Next to each other
Share single promoter
All on or all off
Overview
Transcription
Single continuous mRNA molecule
Each gene has its own start/stop codon
Translation
Produces 3 separate proteins
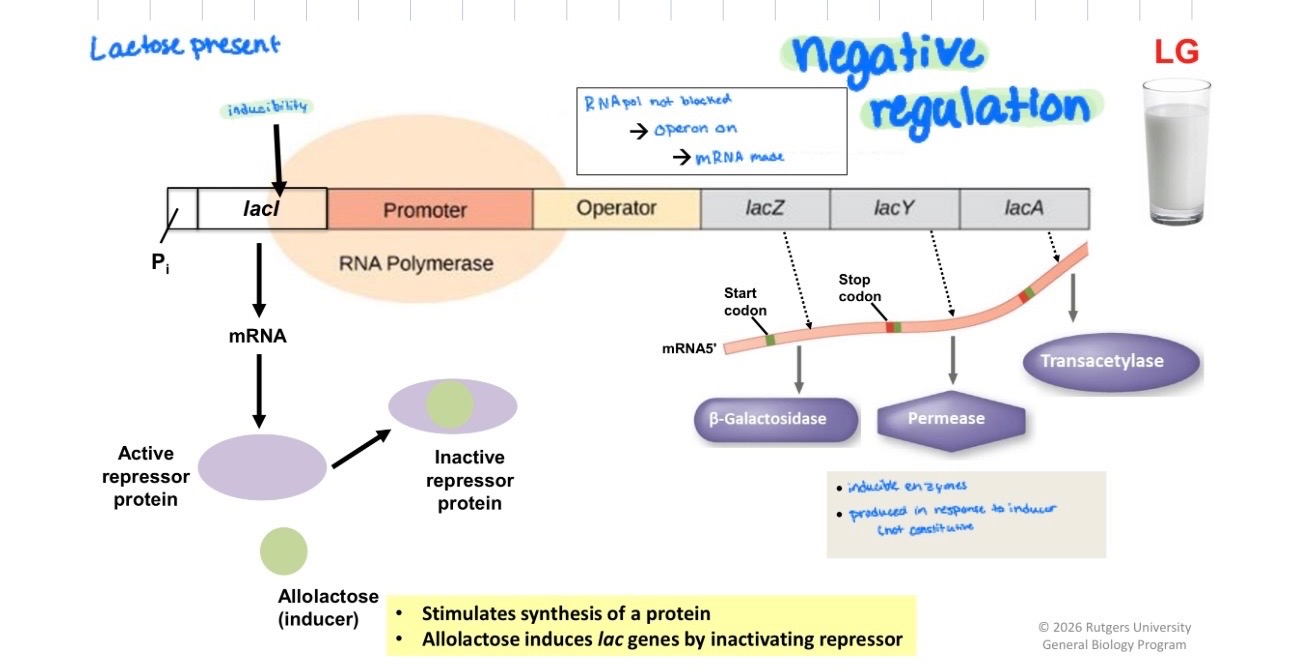
2. Proteins that regulate lac operon (Negative Regulation)
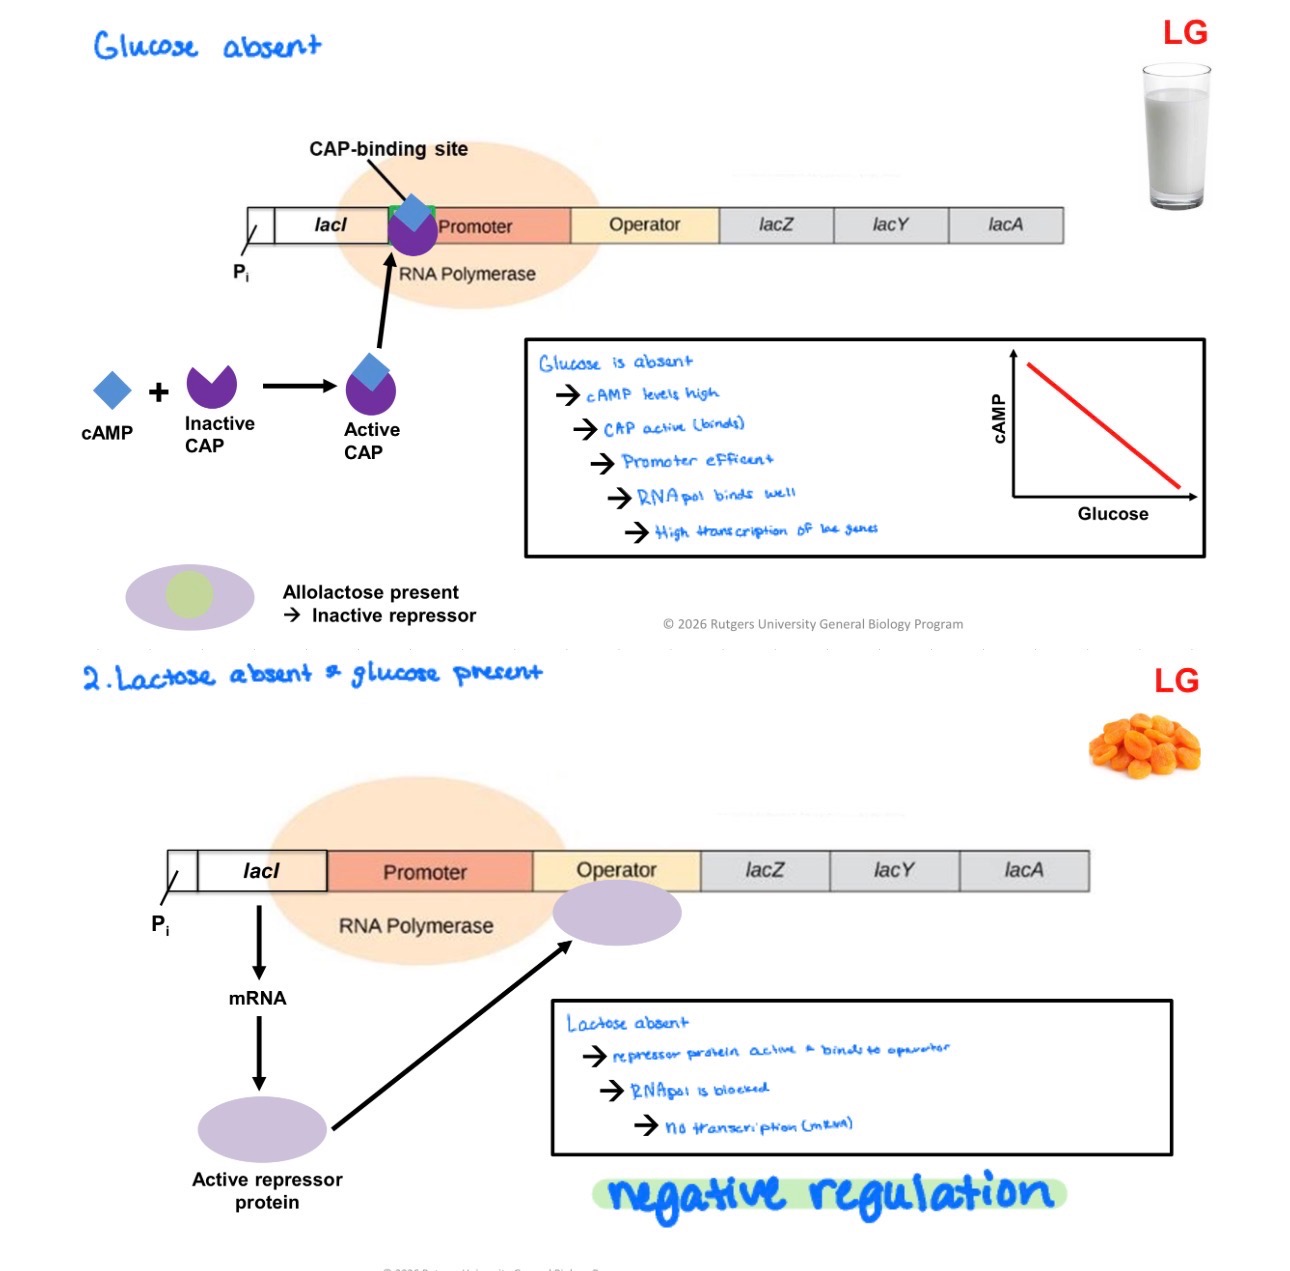
a. Repressor
Coded for by lac repressor gene
-> Not part of lac operon
-> Pi = promoter
-> Constitutive
Binding site on operator:
When repressor fails to bind:
Operon is ON (transcription occurs)
When repressor binds:
Operon is OFF (no transcription)
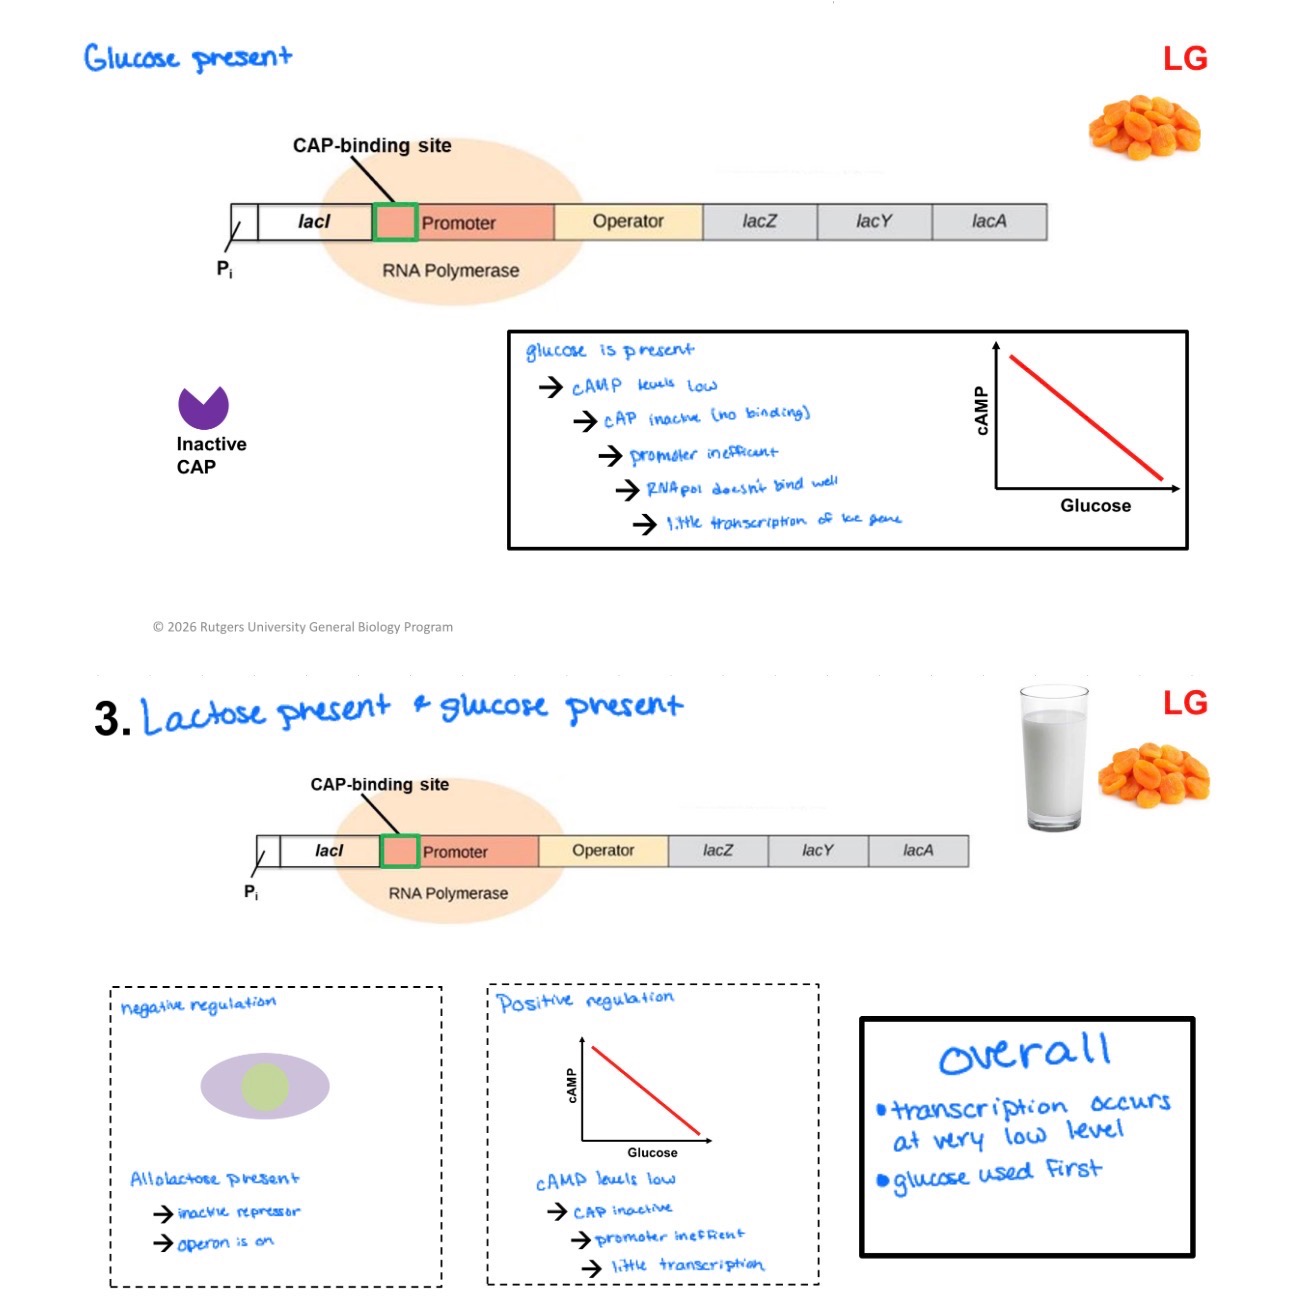
b. Catabolite Activator Protein (CAP)
Two forms
Unbound: inactive
Bound to cAMP: active
Promoter
Inefficient (low affinity for RNA polymerase)
CAP-binding site present
cAMP levels
High when glucose is scarce
Low when glucose is abundant
Inactive CAP (no cAMP)
Does not bind
Promoter has low affinity for RNA polymerase
Transcription reduced
Positive Regulation (Active CAP)
CAP binds
Bends DNA helix
Increases promoter’s affinity for RNA polymerase
Transcription enhanced
B. Chemical Environments
1. Lactose present & glucose absent
Lactose enters cell
→ Allolactose (isomer)Allolactose binds to allosteric site on repressor
→ Repressor changes shape
→ Inactivated
→ Cannot bind
II. Eukaryotic Gene Regulation
Multicellular eukaryotes
Many different types of cells
Differential gene expression
Expression of different genes by cells with same genome
→ Cell specialization
→ Different tissue types
Gene Regulation in Eukaryotes
Occurs at multiple levels:
Chromatin structure
Transcription
RNA processing
Protein processing
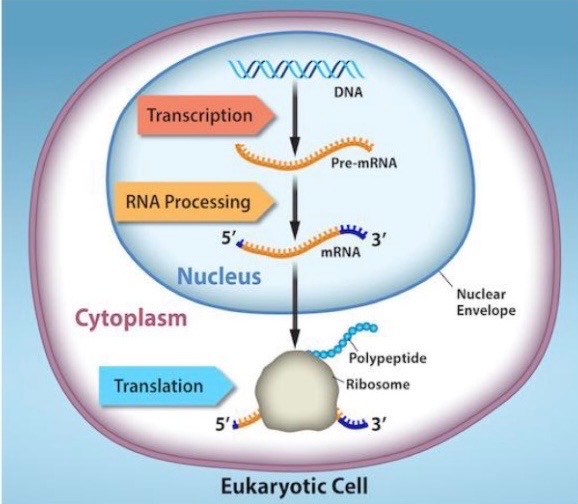
A. Regulation of Chromatin Structure
1. Euchromatin
Loosely packed
→ Transcription occursActive genes
2. Heterochromatin
Highly condensed
→ No transcriptionDNA methylation
Example: Barr body
B. Regulation of Transcription Initiation
1. Promoter
RNA polymerase binds & begins transcription
2. Control elements
Non-coding DNA
Binding sites for transcription factors (TFs)
3. Transcription factors (TFs)
Proteins
Increase or decrease RNA polymerase binding
C. RNA Processing
Post-transcriptional regulation
Includes:
5’ cap & 3’ poly-A tail
Splicing of pre-mRNA
D. Protein Processing
1. Post-translation regulation
2. Polypeptide → functional protein
3. Chemical modifications
Glycosylation
Phosphorylation
4. ER & Golgi
18: DNA Technology
DNA Technology
techniques for sequencing and manipulating DNA
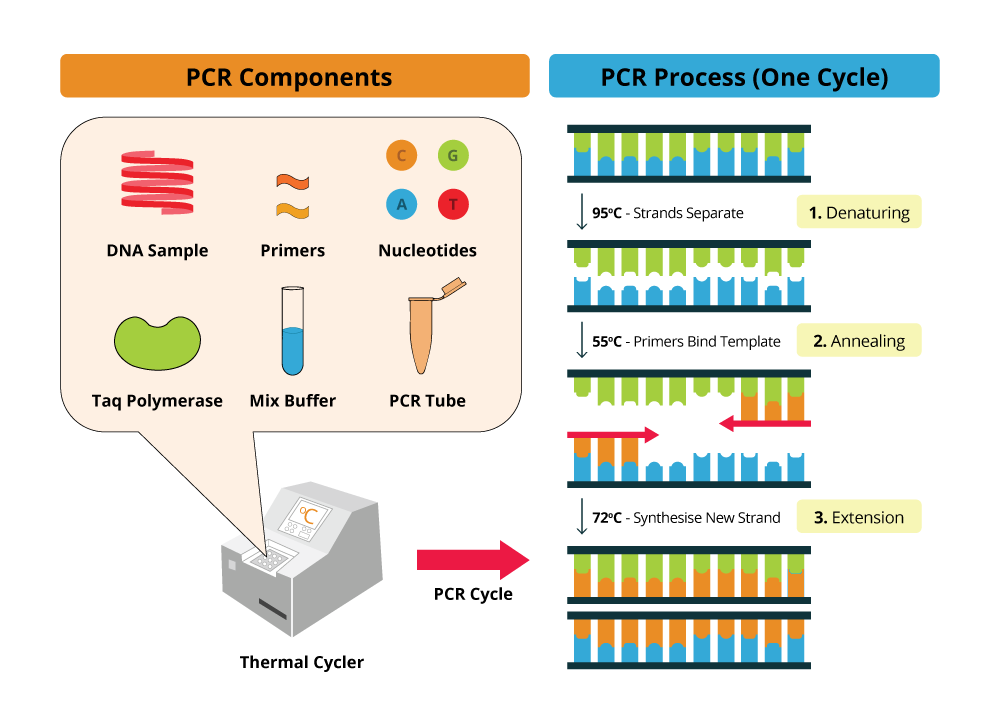
Polymerase chain reaction (PCR)
Introduction
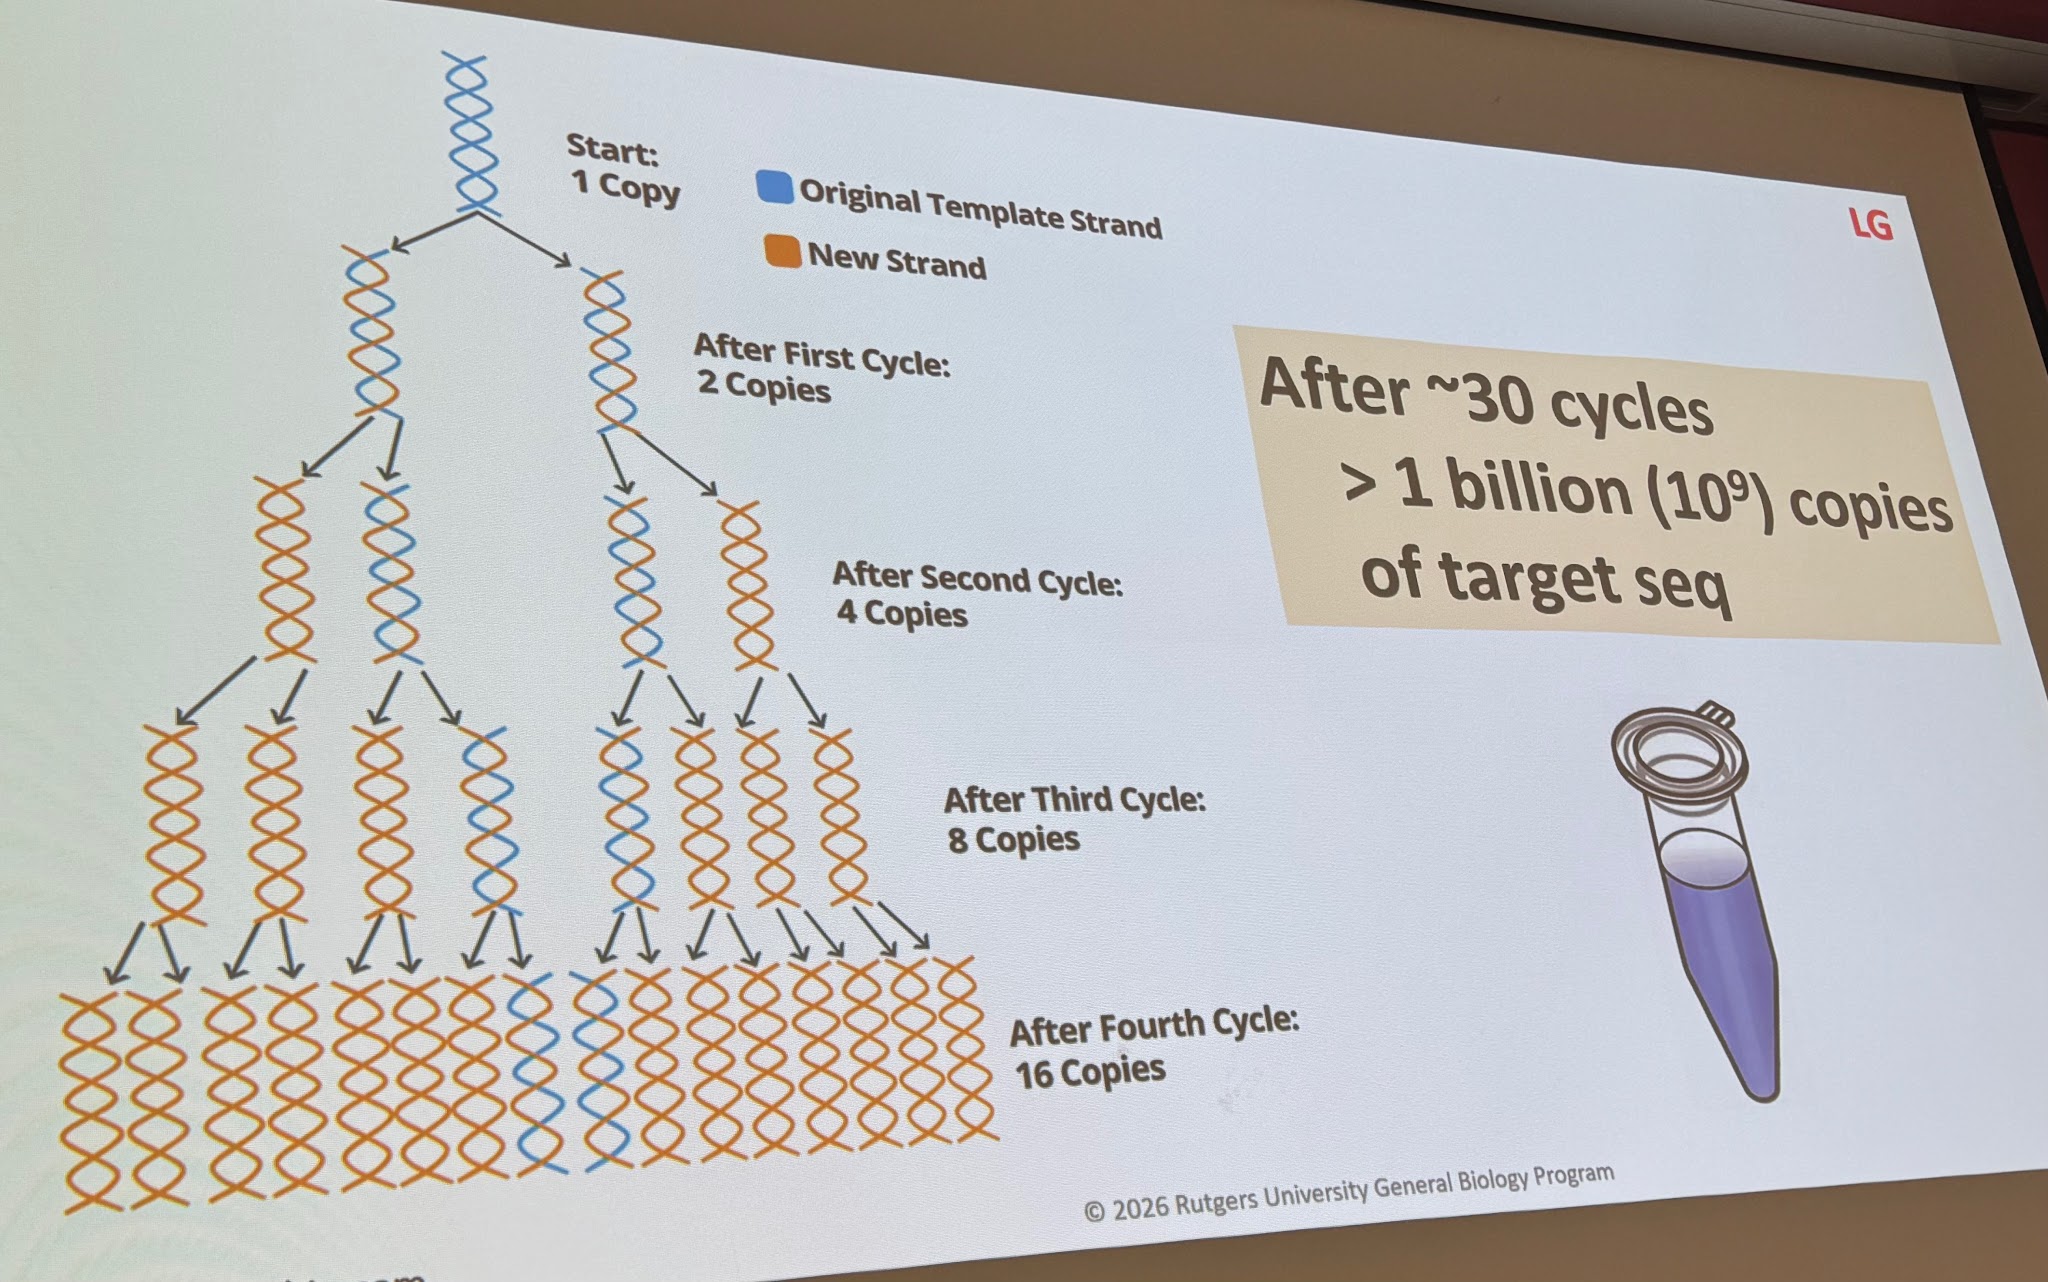
Purpose: produce many copies of DNA seq in short time
Based on: DNA replication
3-step cycle repeated many times
Each cycle:
Denaturation
Annealing
Extension
4. Thermal cycler
automatically controls and alternates temperatures
programmed periods of time and number of cycles
5.
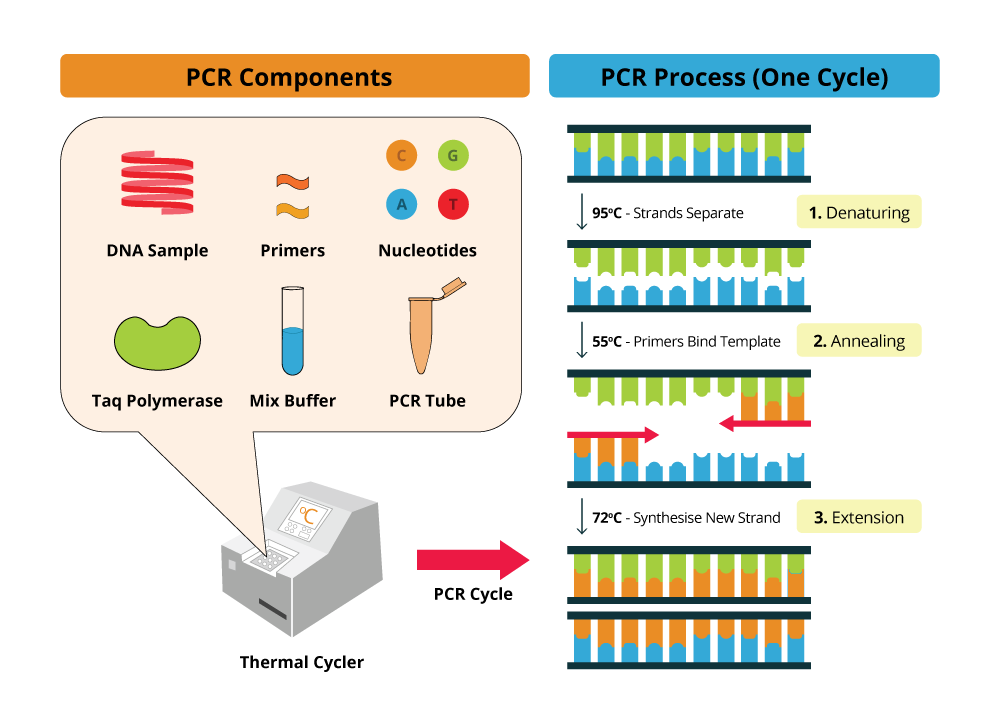
template DNA sample containing DNA seq to be amplified
primers
synthetic sequence of single stranded DNA
short (around 15-20 bases)
dNTPs: A, C, G, T
Taq polymerase
B. Process of PCR
Step 1: Denaturation
Temp > 90 degrees C
Backbone
Sugar-phosphate
covalent bonds
-> strong and remain intact
- bases
H bonds
-> weak and break
-> double stranded dna separates into two single strands
Step 2: Annealing
temp
40 degrees - 65 degrees C
primers
1 for each single stranded DNA
-> Anneal (bind) at 3’ end of target strand
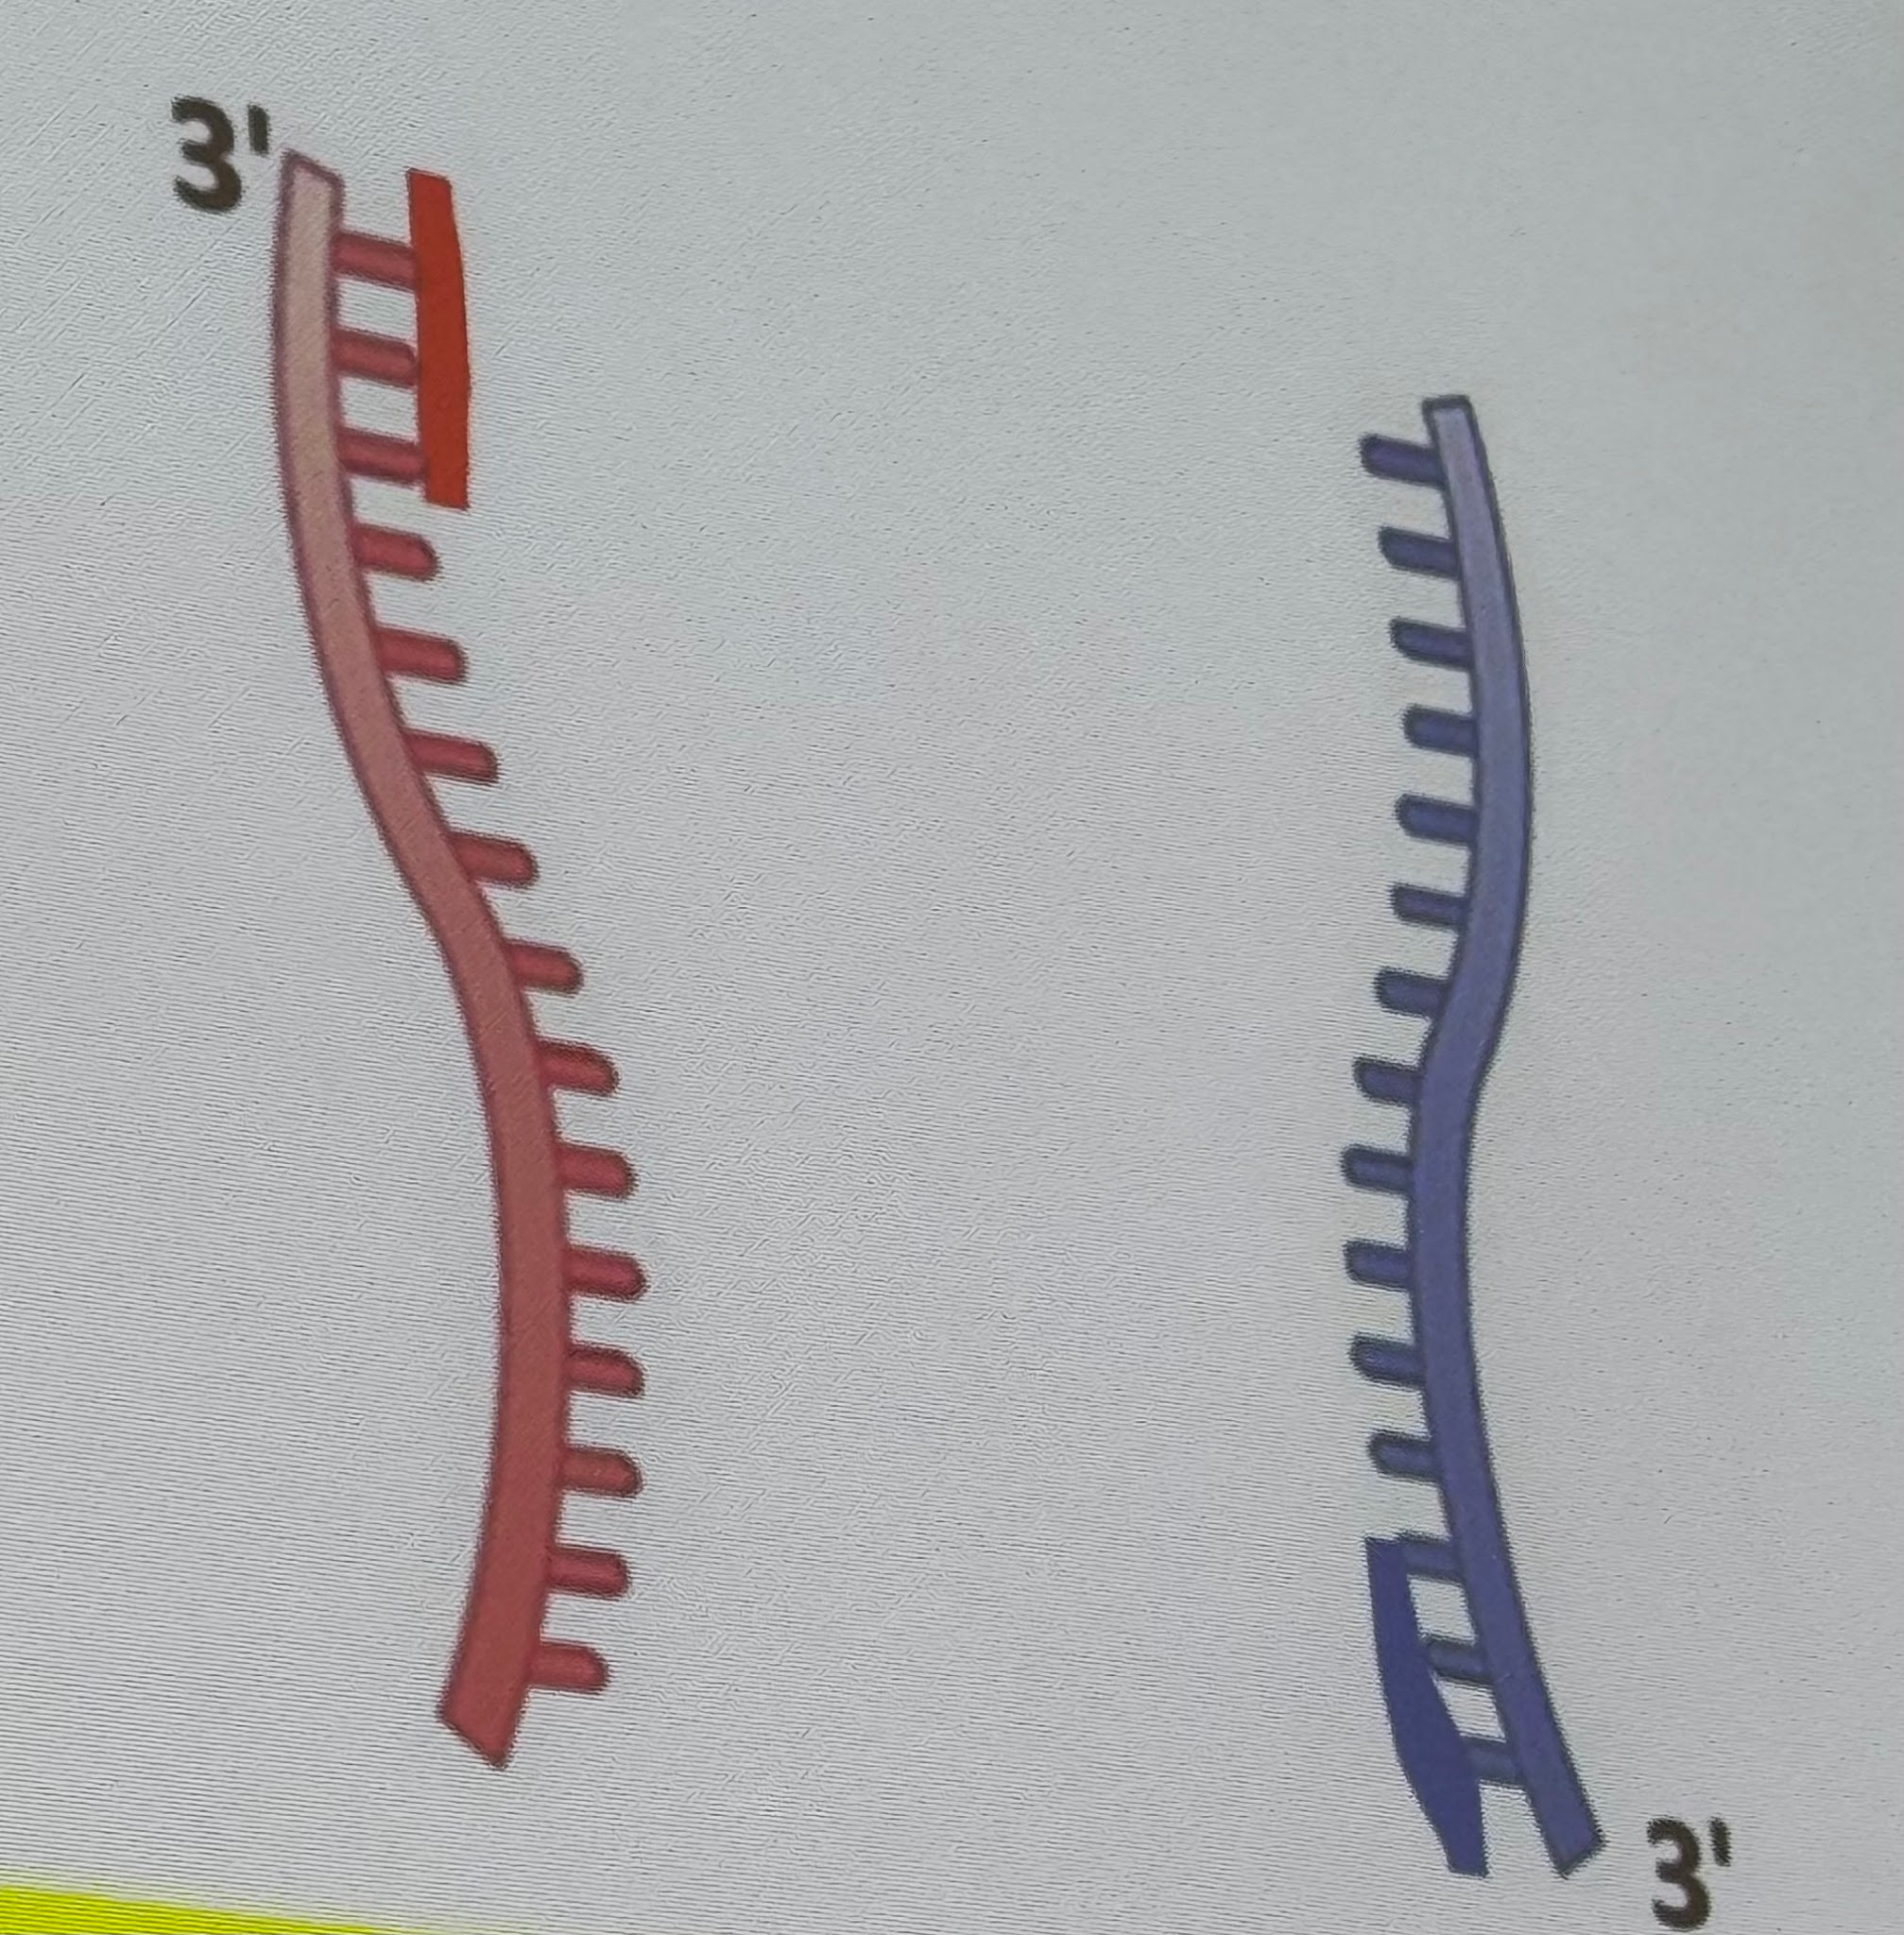
Step 3: Extension (Elongation)
Temp increases to around 72 degrees C
Taq DNA polymerase
Thermus Aquaticus
Bacterium in hot springs
Enzymes stable at high temperatures
Begins at primers
Synthesizes DNA 5’ to 3’
30-40 cycles
C. Gel electrophoresis
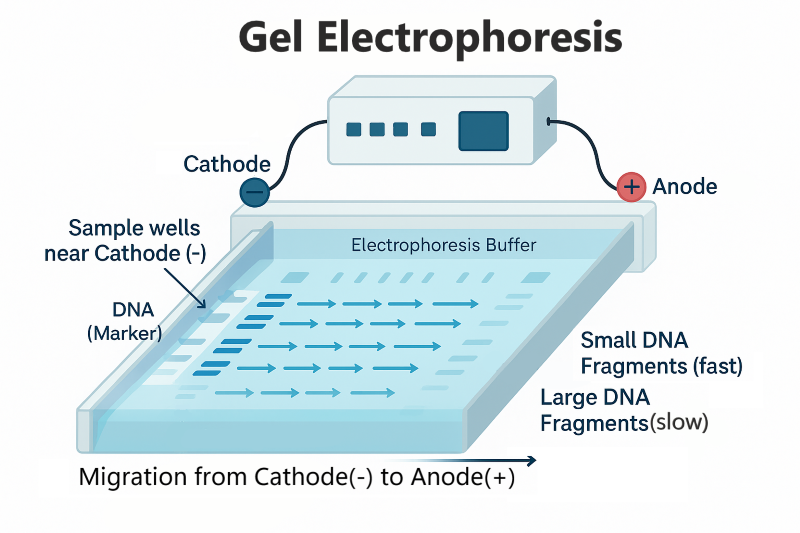
Agarose gel (polysaccharide):
Molecular sieve
Nucleic acids separate on basis of size
Method
Sample of PCR mixture loaded into gel
Electric current
DNA (-charge) migrates toward + electrode
Smaller fragments move faster
Visualize bands, remove fragment from gel and use in other techniques
D. Uses of PCR
Amplify small amounts of DNA
Fingerprints, blood at crime scene
Single embryonic cell
Extinct species
II. DNA sequencing
Purpose: Determine nucleotide seq of DNA
Based on: Semi-conservative replication (DNA lecture)
A. Dideoxy chain termination sequencing
Sequencing machine
Ingredients
dsDNA fragment -> Denatured by heat into single strands
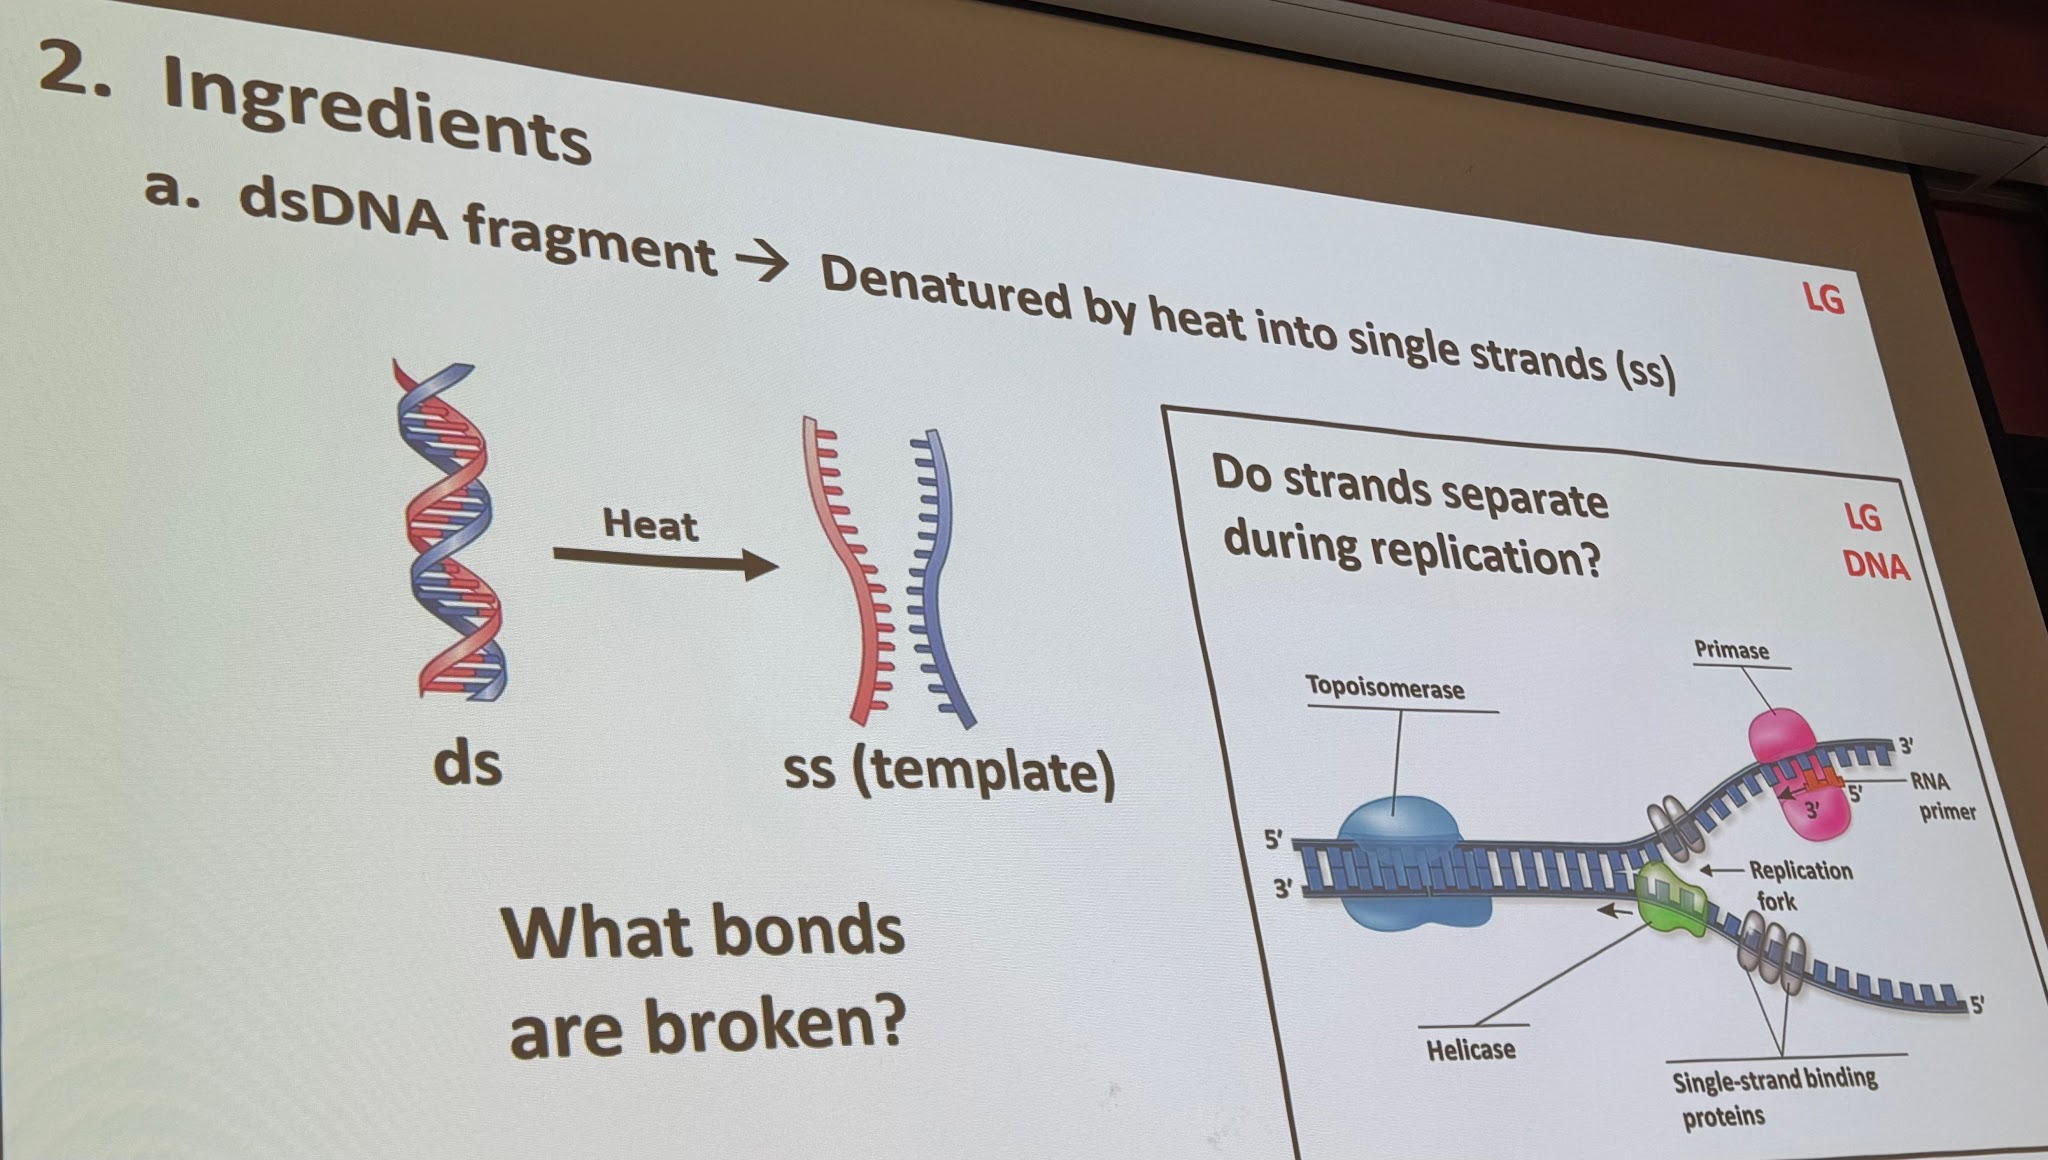
Primer (DNA)
- Short stretch of nucleotides
- Designed to base pair with 3’ end of template
DNA polymerase
- Adds nucleotides to growing strand (5’ to 3’)
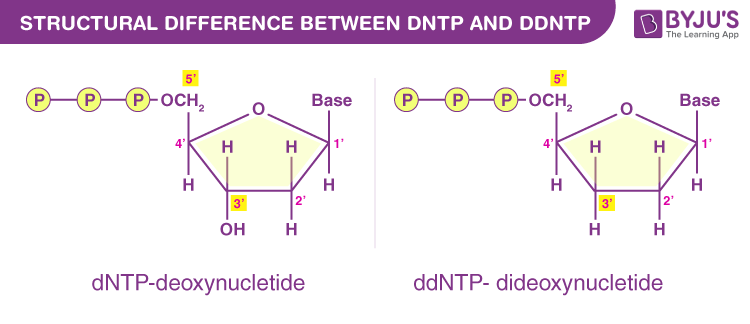
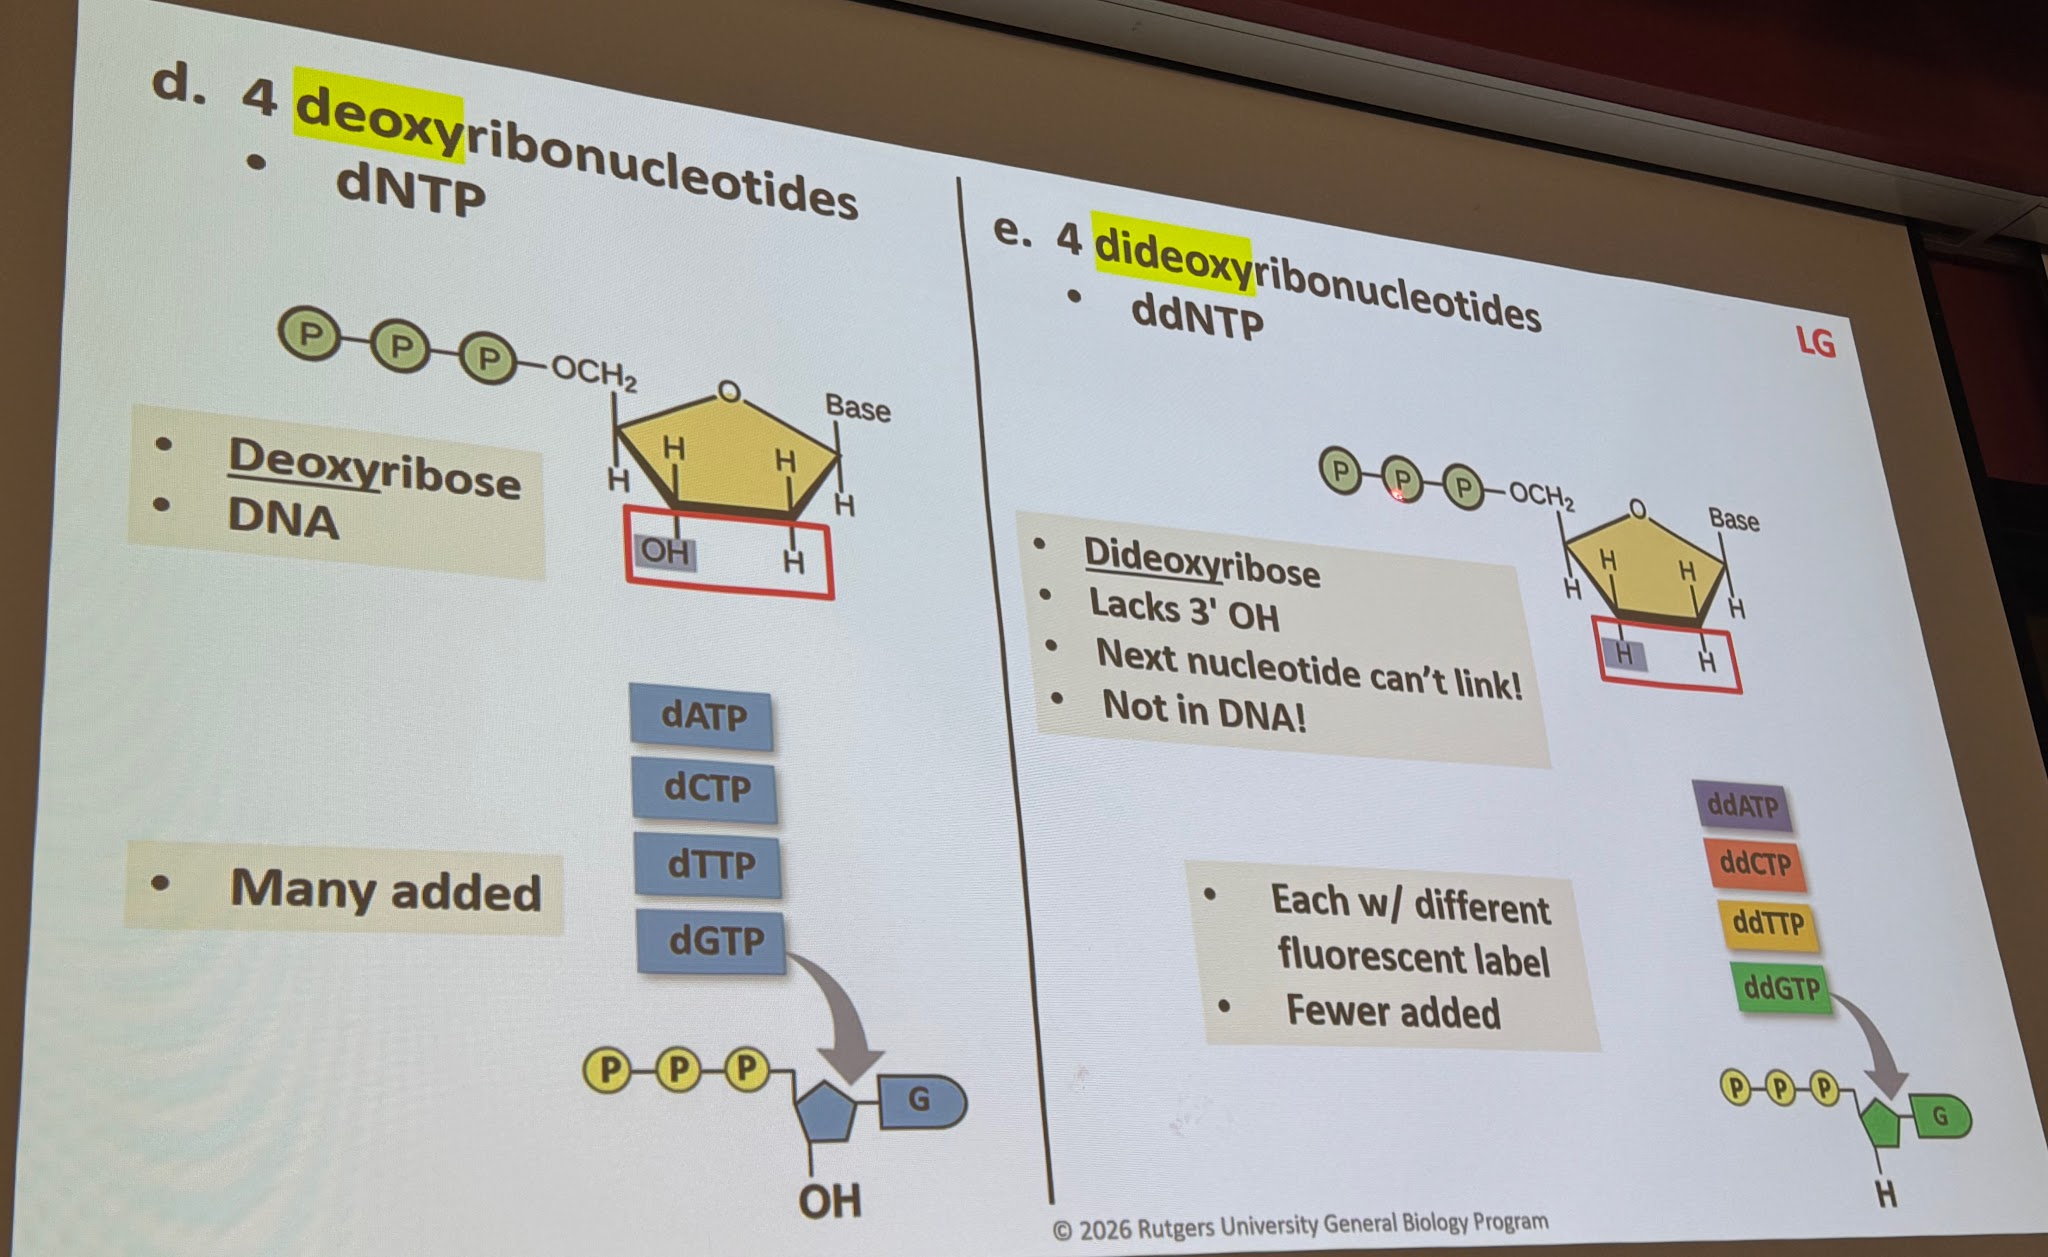
- Needs 3’ OH
Deoxyribonucleotides
- dNTP
4 Dideoxyribonucleotides
3. Process: Synthesis
Begins at 3’ end of primer
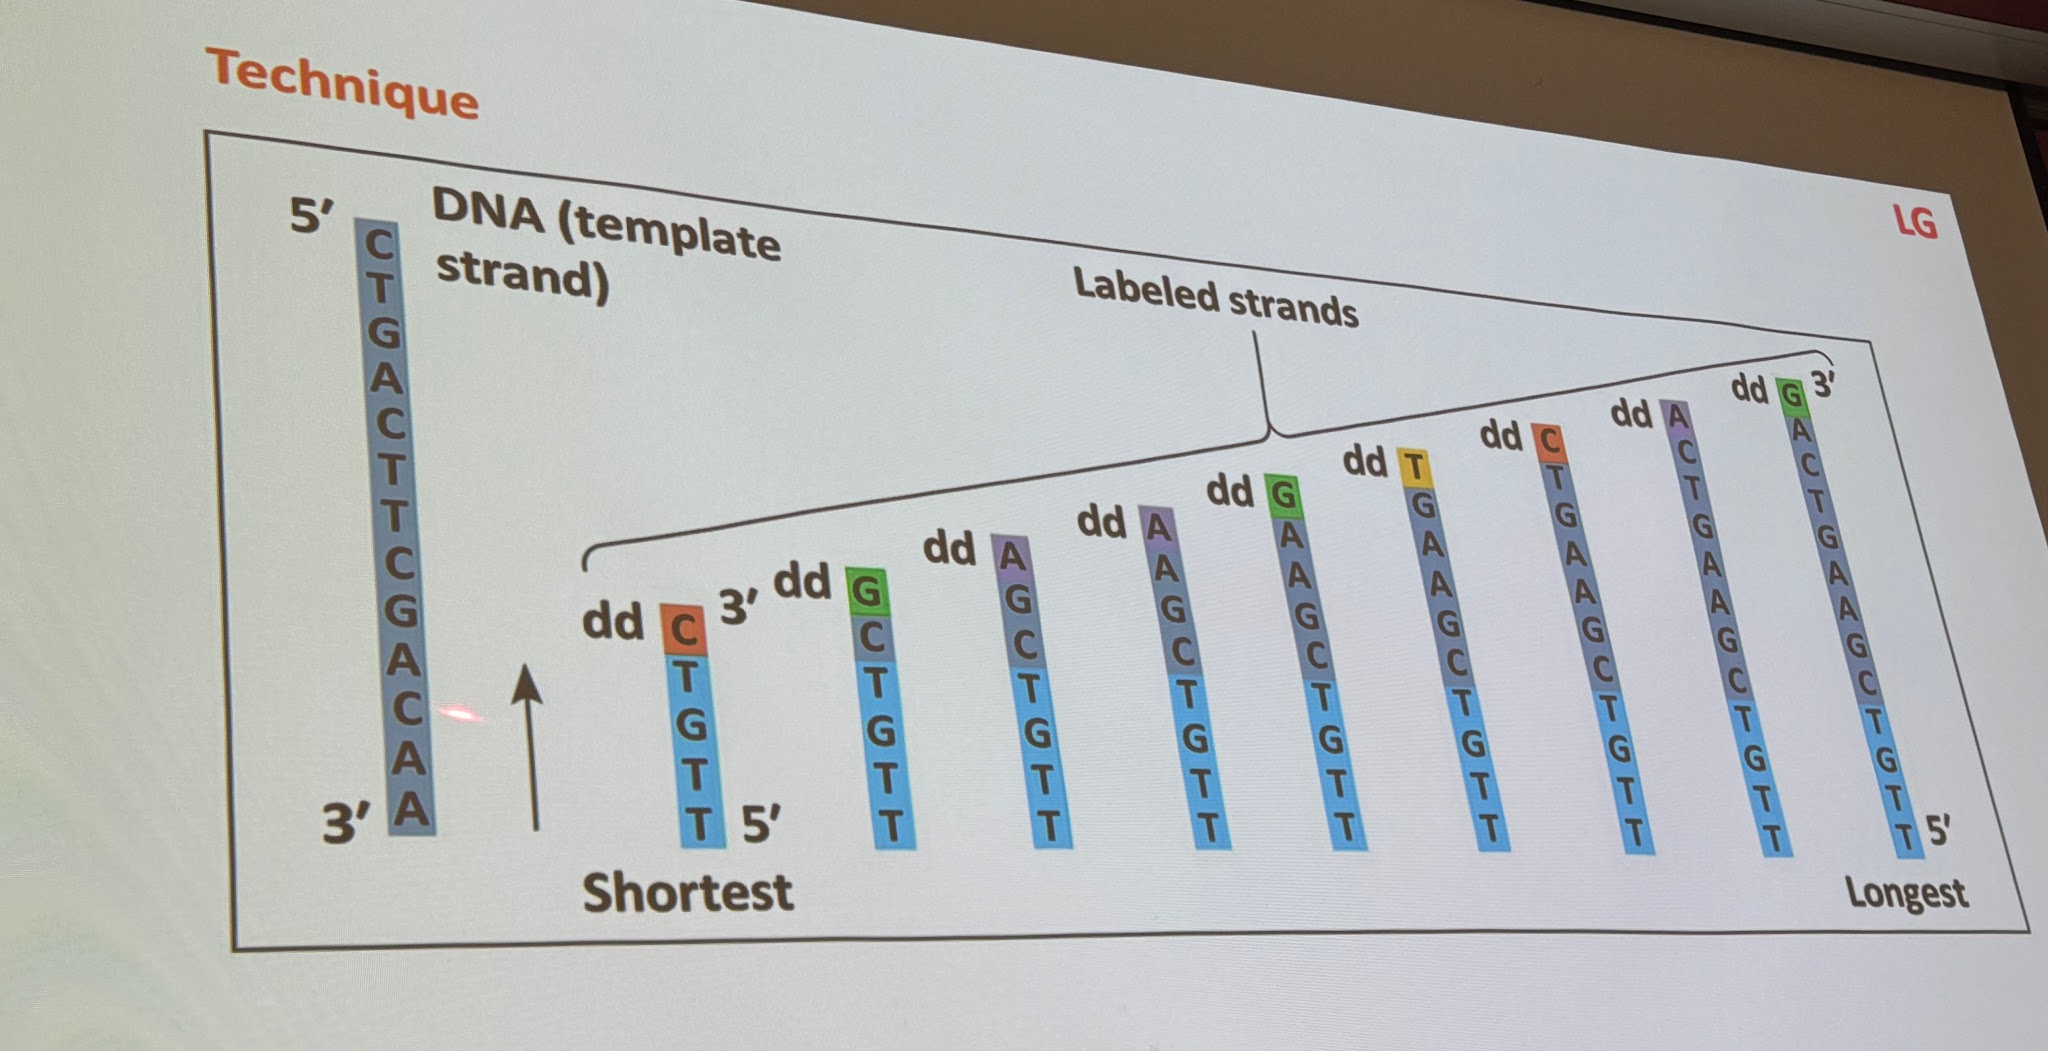
If dNTPs added -> Elongation continues
Until a ddNTP inserted (at random)
-> Elongation stops
(b/c no free 3’ OH)
Set of labeled fragments
- Various lengths
- Color of label represents last nucleotide in fragment
5. Process: Separation of DNA fragments
Polyacrylamide gel
Polymer (molecular sieve)
Shorter fragments move faster
Seq not important
Fluorescent detector
- senses color of each tag
6. Result: Spectrogram
Seq of entire DNA fragment
B. Uses of sequencing
Medicine
Identify genes and determine risk of genetic disease
Forensics
Identification
Paternity testing
Evolutionary biology
- Determine evolutionary relationships
III. Applications of DNA technology
Species diversity
Bar-coding (UPC)
Sequencing from standard part of genome
Ex: Animals - Mitochondrial gene
Barcodes compared
Ex: two samples of algae  Same species!!! |
|---|
Bio Lab (01:119:117)
PCR
Gene therapy
1. Background
- Use of gene to treat or prevent disorders caused by a single defective gene
- Insert normal allele into somatic cells
- Risky
- Currently, mostly in clinical trials
- Recent FDA approval for: 1 type of blindness and 2 blood disorders
2. Methods
In vivo
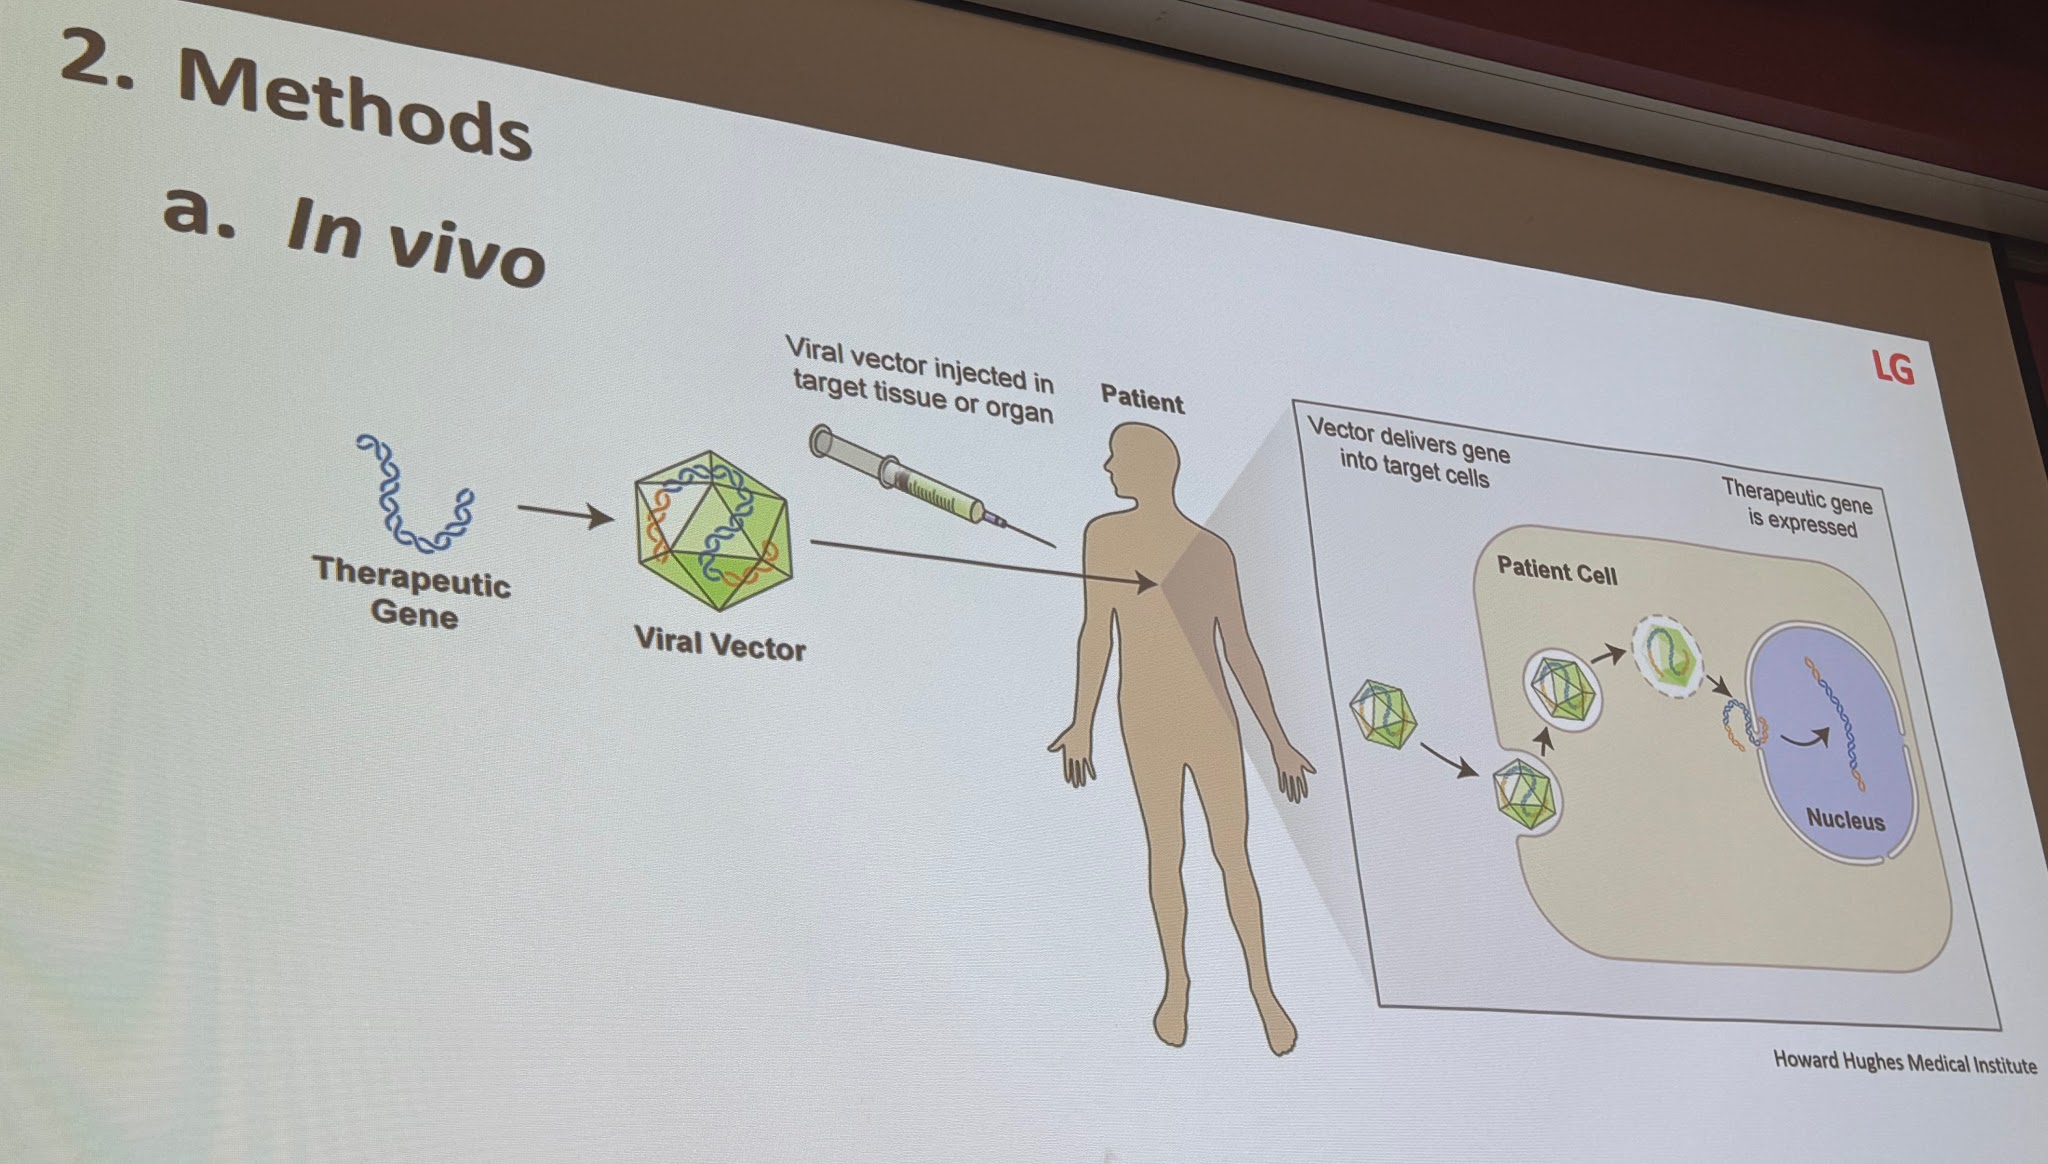
Modified so doesn't cause disease
Delivers therapeutic gene
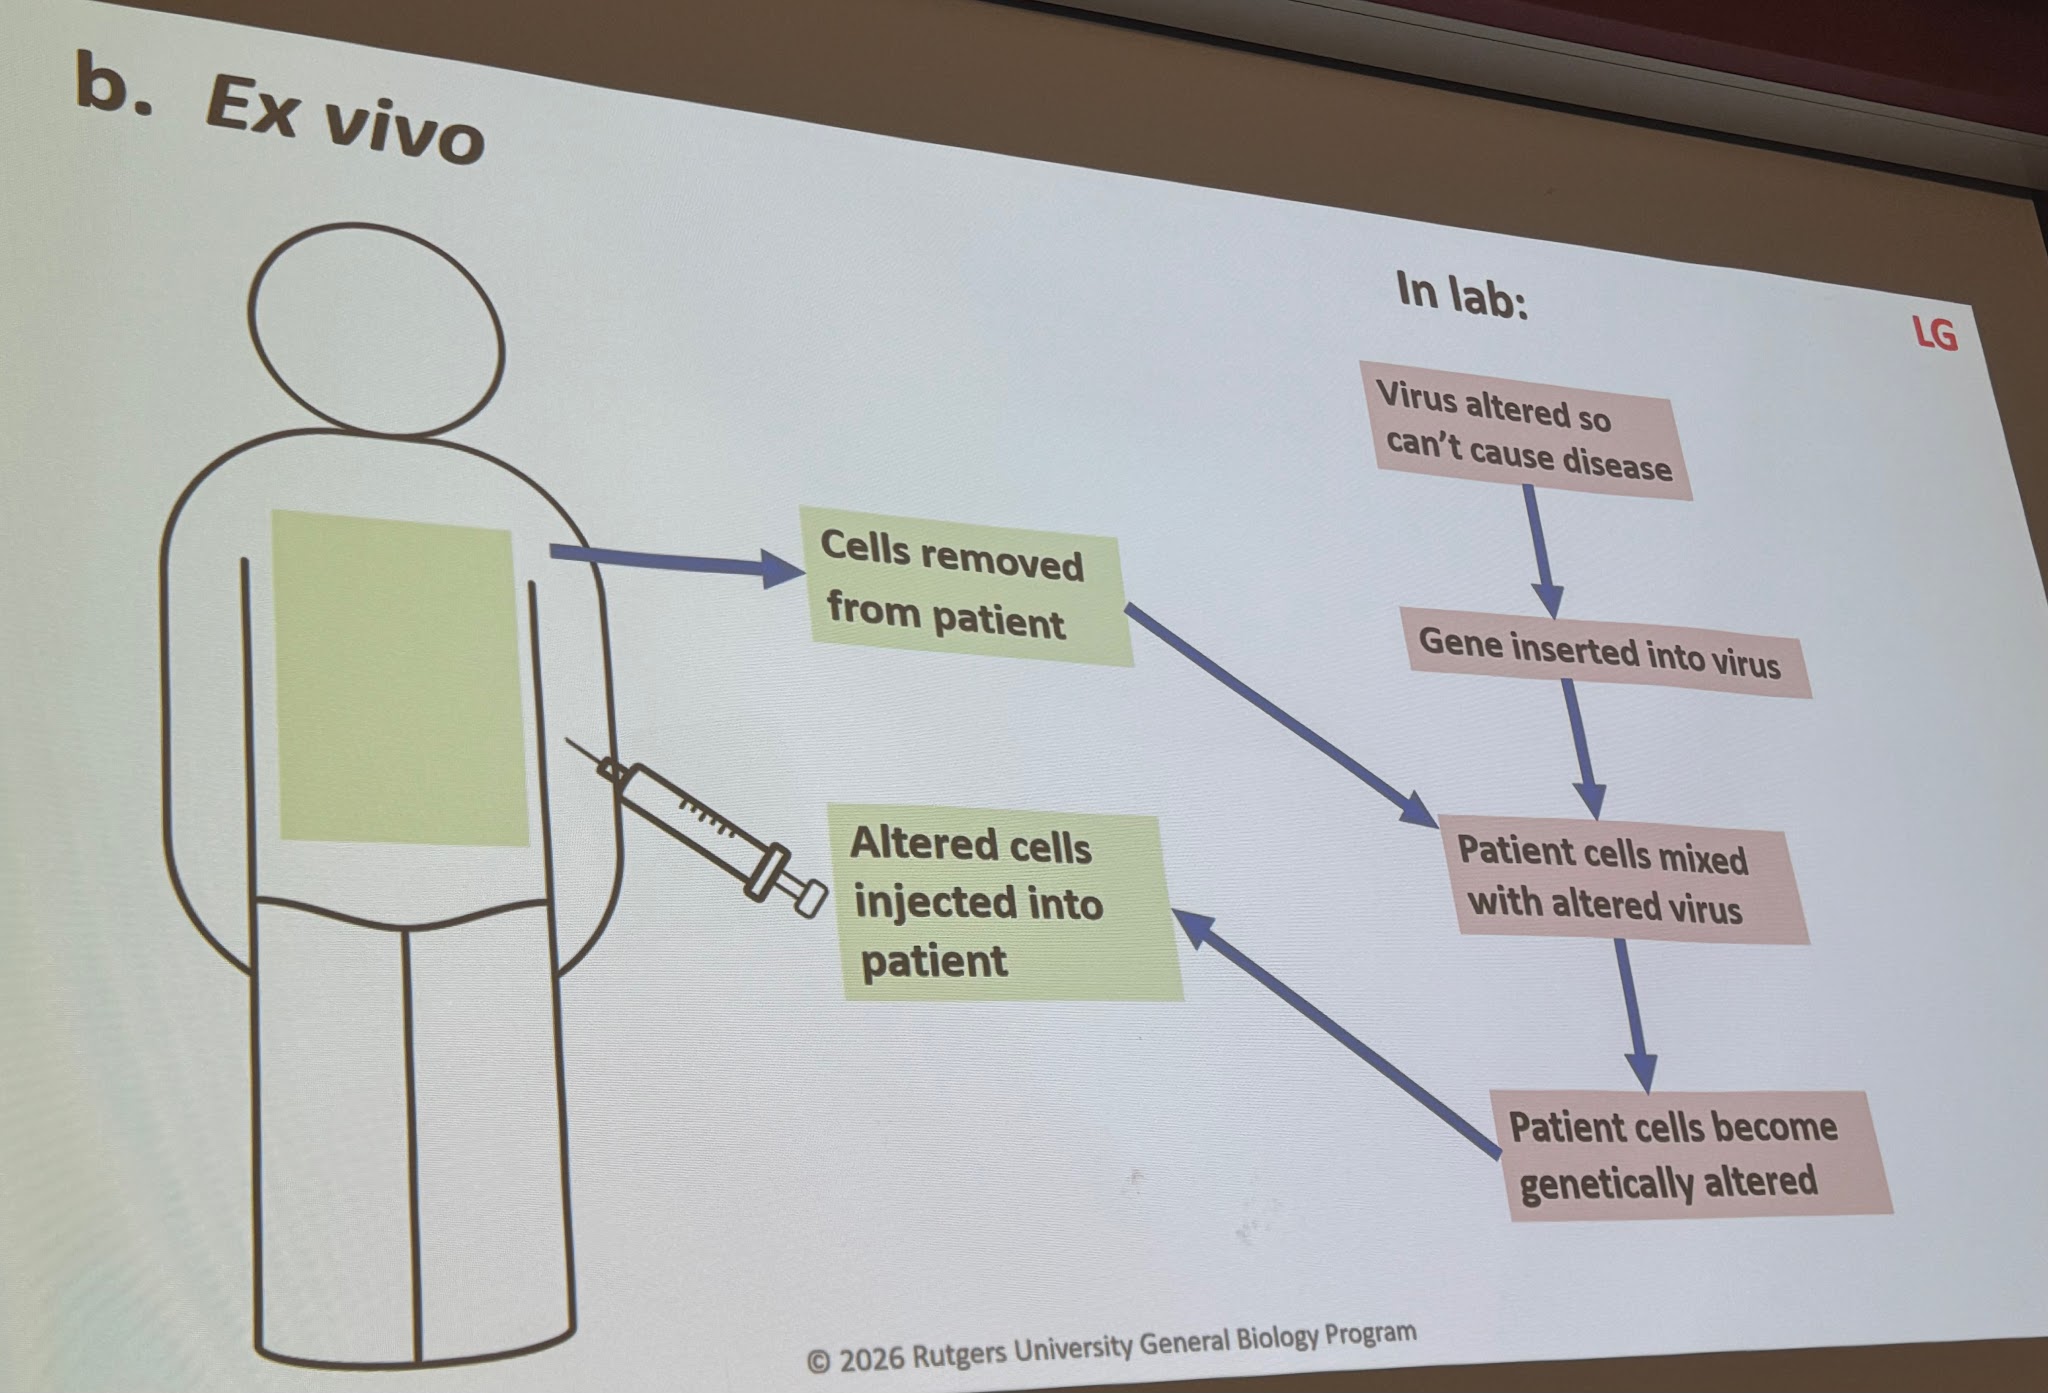
Ex vivo
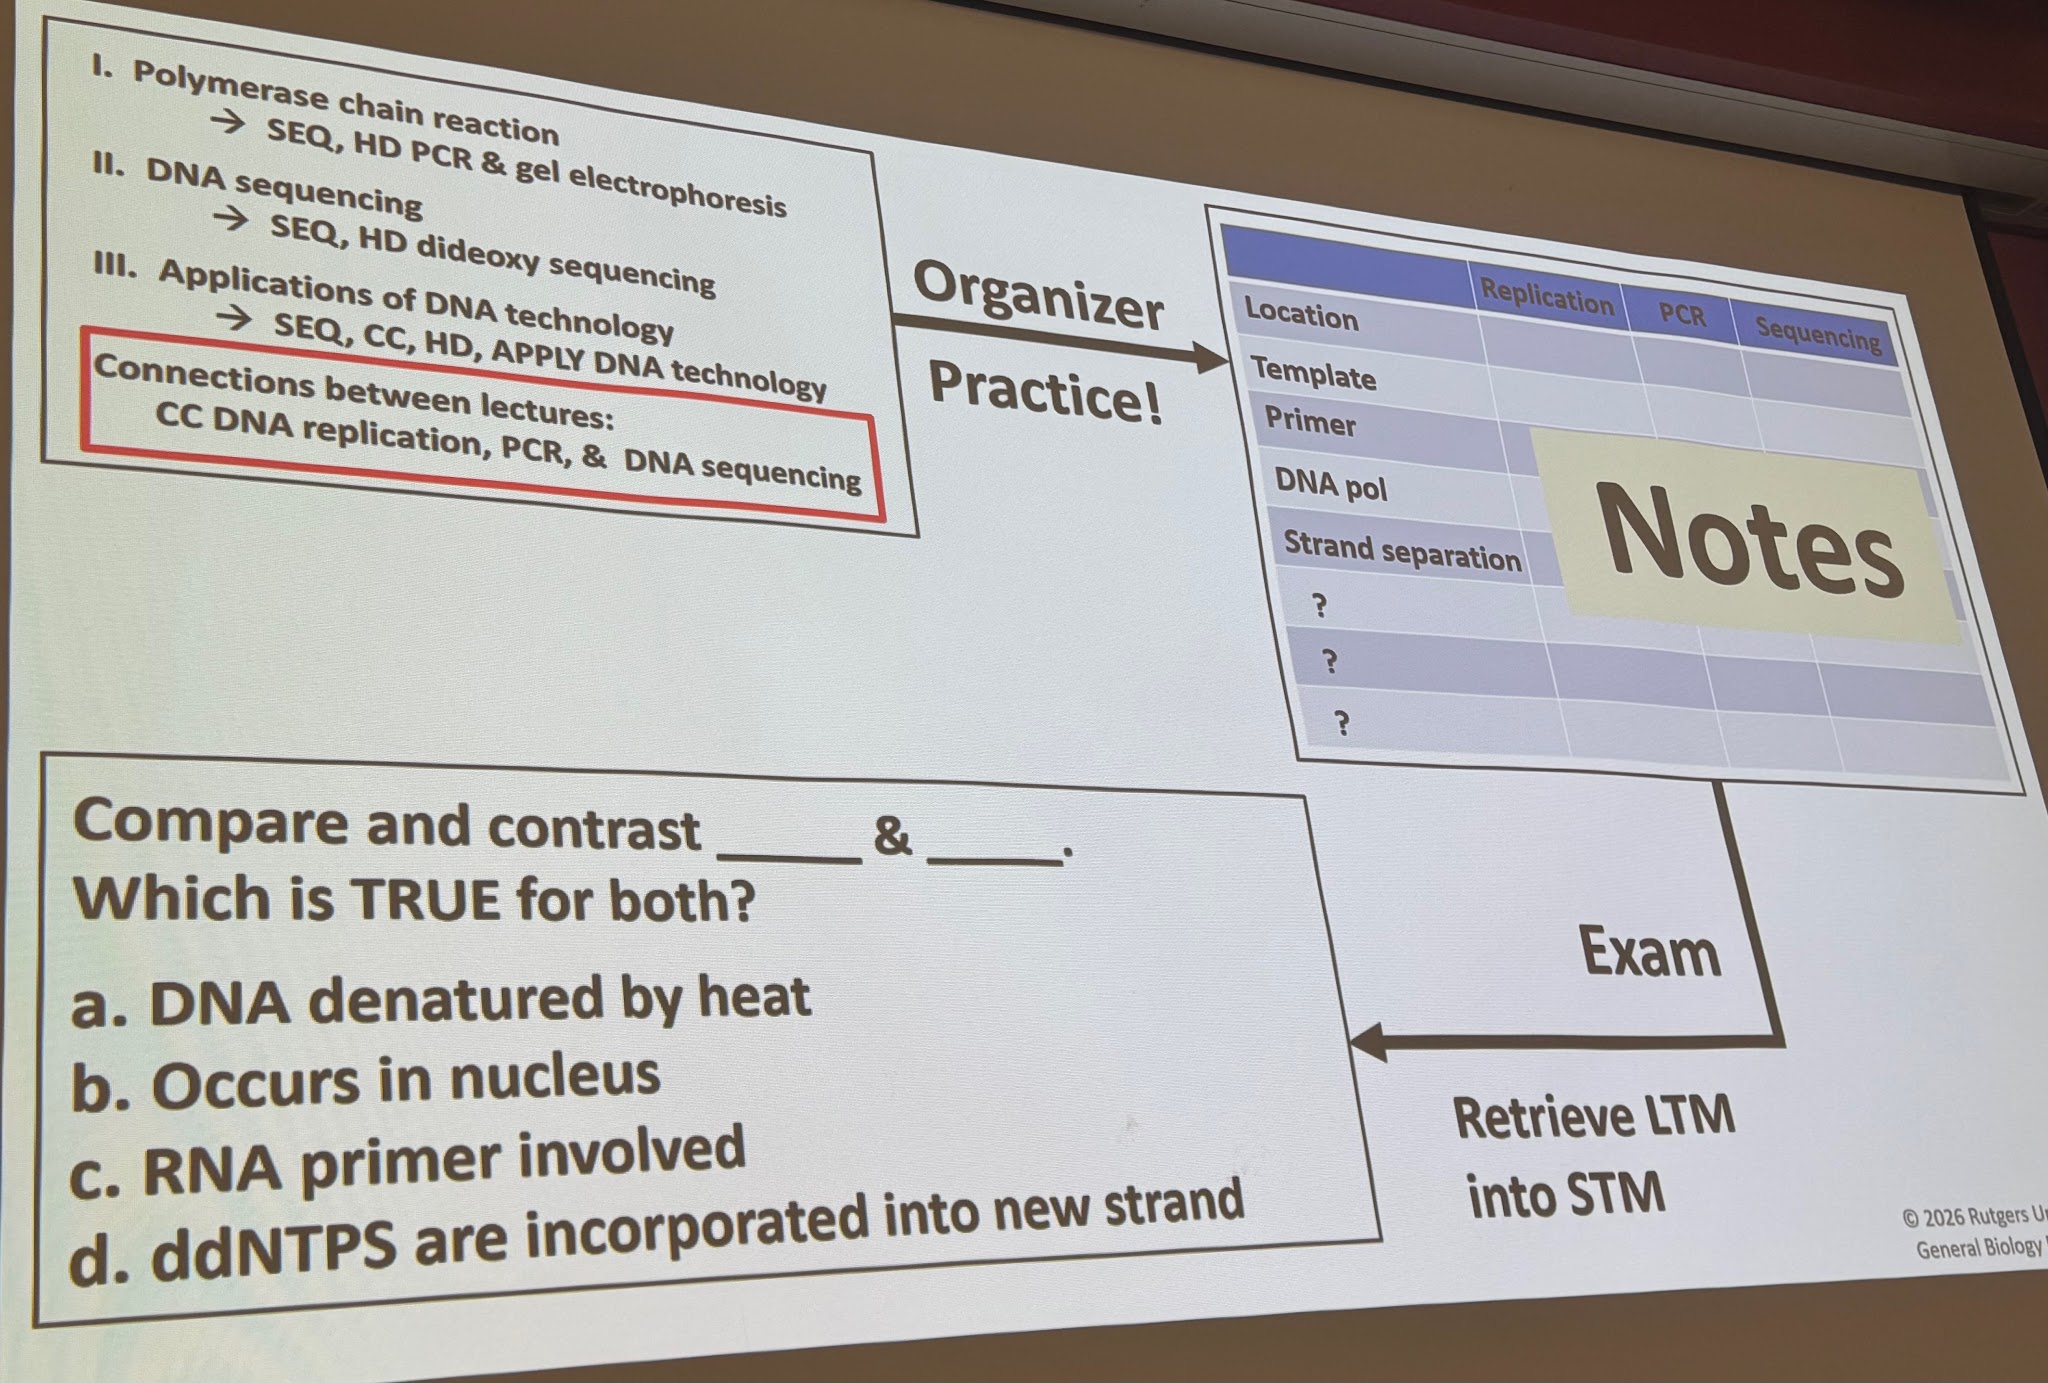
🔴 EXAM 2 (lectures 10-18)
✅ 19: Human Genetics
I. Study of Human Genetic Variation
A. Introduction
1. Difficult to study
Few offspring
Long generation time
Cannot do experimental mating
2. How to study
a. Large extended families
Analyze previous matings
Medical: genetic disorders
b. DNA sequencing
→ genetic basis of similarities & differences
B. Pedigree Analysis
Family tree
Inheritance patterns over several generations
Predict inheritance of phenotypic traits controlled by genotype at a single locus
Genetic counseling
Example: Widow’s Peak
Autosomal dominant
W ≠ w
F2 genotypes?
Genotypes of sisters’ parents?
Genotypes of others
II. Mendelian Inheritance Patterns
A. Autosomal Recessive Condition
(not on sex chromosomes)
1. Introduction
a. Recessive allele
Codes for malfunctioning protein or no protein at all
b. Heterozygote (Aa)
Dominant allele codes for enough protein → normal phenotype
Carrier for recessive allele
c. Homozygous recessive (aa)
Has condition
Most born to parents who are carriers
d.
Many human genetic conditions inherited as single-locus autosomal recessive traits
2. Human conditions due to autosomal recessive genes
a. Albinism
Albino = lacking skin pigmentation
b. Cystic fibrosis
i. Normal allele
Codes for transmembrane protein
→ transport of Cl⁻
ii. Recessive allele
Protein defective or missing
iii. Homozygous recessive
Thick, sticky mucus
Builds up in many organs
c. Sickle-cell disease
i. Hemoglobin (Hgb)
4 polypeptide chains: 2 alpha & 2 beta
Single amino acid substitution in beta chains
→ glutamic acid → valine
ii. Abnormal RBCs
Destroyed → anemia
Clump → block capillaries → tissue damage & pain
iii. Heterozygotes
Normal allele → normal Hgb
Abnormal allele → abnormal Hgb
Resistance to malaria → evolutionary advantage
B. Autosomal Dominant Conditions
(much rarer)
1. Achondroplasia
Form of dwarfism
Allele is dominant
Phenotype of heterozygous genotype = dwarf
Genotype of individuals who are NOT dwarfs = dd
2. Lethal Alleles
a. If recessive:
Heritable
Homozygous recessive → death
b. If dominant:
Death often before reproductive age
Late-onset diseases
→ no symptoms until reproductive age
Example: Huntington Disease
Death of brain cells
Overall deterioration → death
Adult onset (> age 40)
Child with HD parent has 50% chance of inheriting
Genetic test for allele
III. Non-Mendelian Inheritance Patterns
A. Changes to chromosome number (chr)
1. Introduction
a. Disomy
Normal 2n state
2 copies of each chromosome (homologous pairs)
Mistakes can happen during meiosis
b. Nondisjunction
Homologous chromosomes
Sister chromatids
C. Aneuploidy
Abnormal number of particular chromosome (+ or −)
Trisomy
3 copies of one chromosome
2 copies of all others
→ 2n + 1
Monosomy
Missing one chromosome of a pair
→ 2n − 1Monosomics for all autosomes die in utero
1. Down syndrome
Langdon Down
Trisomy 21
Nondisjunction in mother (↑ with age)
Characteristics:
Short stature
Physical & mental impairment
Heart malformations, respiratory disease & leukemia
2. Aneuploidy of sex chromosomes
a. Turner syndrome (45, X0)
Female
Underdeveloped ovaries (sterile)
No Barr bodies
b. Klinefelter syndrome (47, XXY)
Male
Underdeveloped testes (sterile)
Have Barr bodies
c. XYY syndrome (47, XYY)
Male
Usually fertile
Don’t transmit extra Y
B. Changes to chromosome structure
Caused by error in meiosis or damaging agents
Four types:
a. Deletion
Removes a chromosomal segment
b. Duplication
Repeats a segment
c. Inversion
Reverses a segment within a chromosome
d. Translocation
Moves a segment from one chromosome to a nonhomologous chromosome
3. Cri du chat
Deletion on chromosome 5
Characteristics:
Intellectually disabled
Speech disabilities
Small head
Cry sounds like a distressed cat
IV. Genetic Testing
Earlier diagnosis of genetic disorder
→ greater chance for preventing or alleviating effects
A. Fetal testing
Before birth
1. Amniocentesis
14th–16th week
~20 mL fluid
Contains live fetal cells
2. Chorionic Villus Sampling (CVS)
8th–10th week
a. Chorionic villus tissue
Placenta
Derived from fetus
→ fetal genotype
b. Tissue sample
Many cells
Rapidly dividing
B. Newborn screenings
Example: Phenylketonuria (PKU)
Normal:
Phenylalanine metabolized to tyrosine
PKU:
Autosomal recessive disorder
✅ 20: Intro to Evolution
Evolution
Decent with modification
Charles Darwin
Pre-Darwinian ideas
Life is constant
Species (spp) are unchanging
1. Aristotle (384 - 322 BCE)
2. Judeo-Christian cultures
Natural theology
Discover God's plan by studying nature
Carolus Linnaeus (1707 - 1778)
Naming & classifying organisms
Early 1800’s: Idea of ‘no change’ starts to be questioned
George Cuvier (1769 - 1832)
Paleontologist
Rock layers in Paris
Species appeared & disappeared
Species in deeper layers different from modern species
Catastrophism
Each layer resulted from a catastrophe
-> Destroyed many species
-> New species migrated in
2. James Hutton
Geologist
Gradualism
Geologic change from gradual mechanisms
Ex: Valleys formed by rivers
3. Charles Lyell
Geologist
Refined gradualism -> uniformitarianism
Processes today are same as in past & at same rate
Earth is > 6,000 years old
C. Jean Baptiste de Lamarck
Studied fossils & observed lines of decent
Two principles
Use and disuse
Body parts that are used -> change
= Acquired characteristics
Parts not used -> deteriorate
Ex: Giraffes
Inheritance of acquired characteristics
Ex: Giraffe has short neck
-> Stretches & gets long neck
-> offspring have long neck
|
|---|
Darwin's work & ideas
Background
Voyage on HMS Beagle (1831 - 1836)
Ships naturalist
Observations
Read
After voyage
Naturalist, published trip accounts, wrote books
Developed theory of natural selection, but did not publish it
1858
Alfred Russell Wallace
Theory of natural selection!
CD & ARW presented Linnaean Society
1859
“On the Origin of Species by Natural Selection”
Better support & earlier notes than ARW
B. Observations and connections
1. Variation
|
|---|
(Individuals best adapted to the environment, most likely to survive and reproduce) -> Accumulation of favorable traits in the population occurring over generations |
2. Overproduction
i. Thomas Malthus (Economist)
ii. In nature
|
|---|
|
Not all survive to reproduce
C. Evolution by natural selection
Natural selection is mechanism
“Survival of the fittest”
Fitness
Ability to survive and have viable offspring
Better adapted organisms more likely to survive & reproduce
As result, population changes over time
= Evolution
Favorable traits
-> Increase in frequency (freq) over generations
Less favorable traits
-> become scarce or disappear
Populations evolve
Individuals do not evolve
Example of natural selection
Grasshopper lays eggs
Yellow and green grasshoppers hatch
Predator (bird) eats the grasshoppers that are easy to see (the yellow ones)
Green grasshopper are left to reproduce
Evidence for evolution
Artificial selection (= Selective breeding)
Humans
Desirable traits
Species changes from wild ancestors
Ex: Agriculture
Ex: Dog lineage
Direct observation
Ex: Antibiotic resistance in bacteria
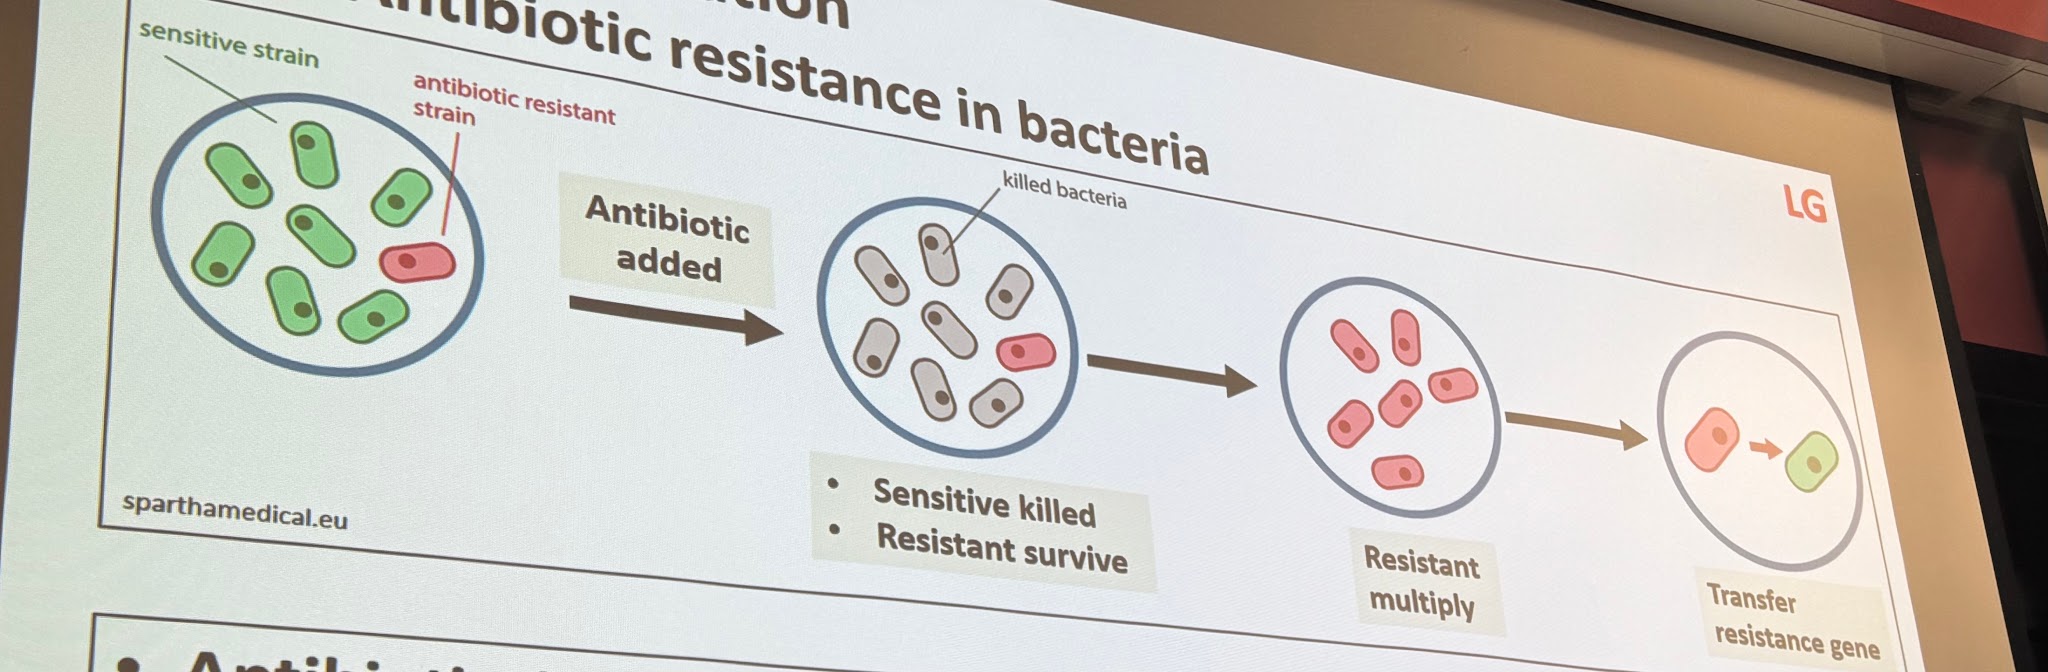
|
|---|
Homology
similarities due to common ancestry
Phylogenetics: study of evolutionary relationships

Decent with modification Share common ancestor (CA) -> Then adapted/changed |
|---|
Homologous structures
Ex: Mammalian forelimbs
Different appearance and function
Same patterns of bones, muscles, and nerves
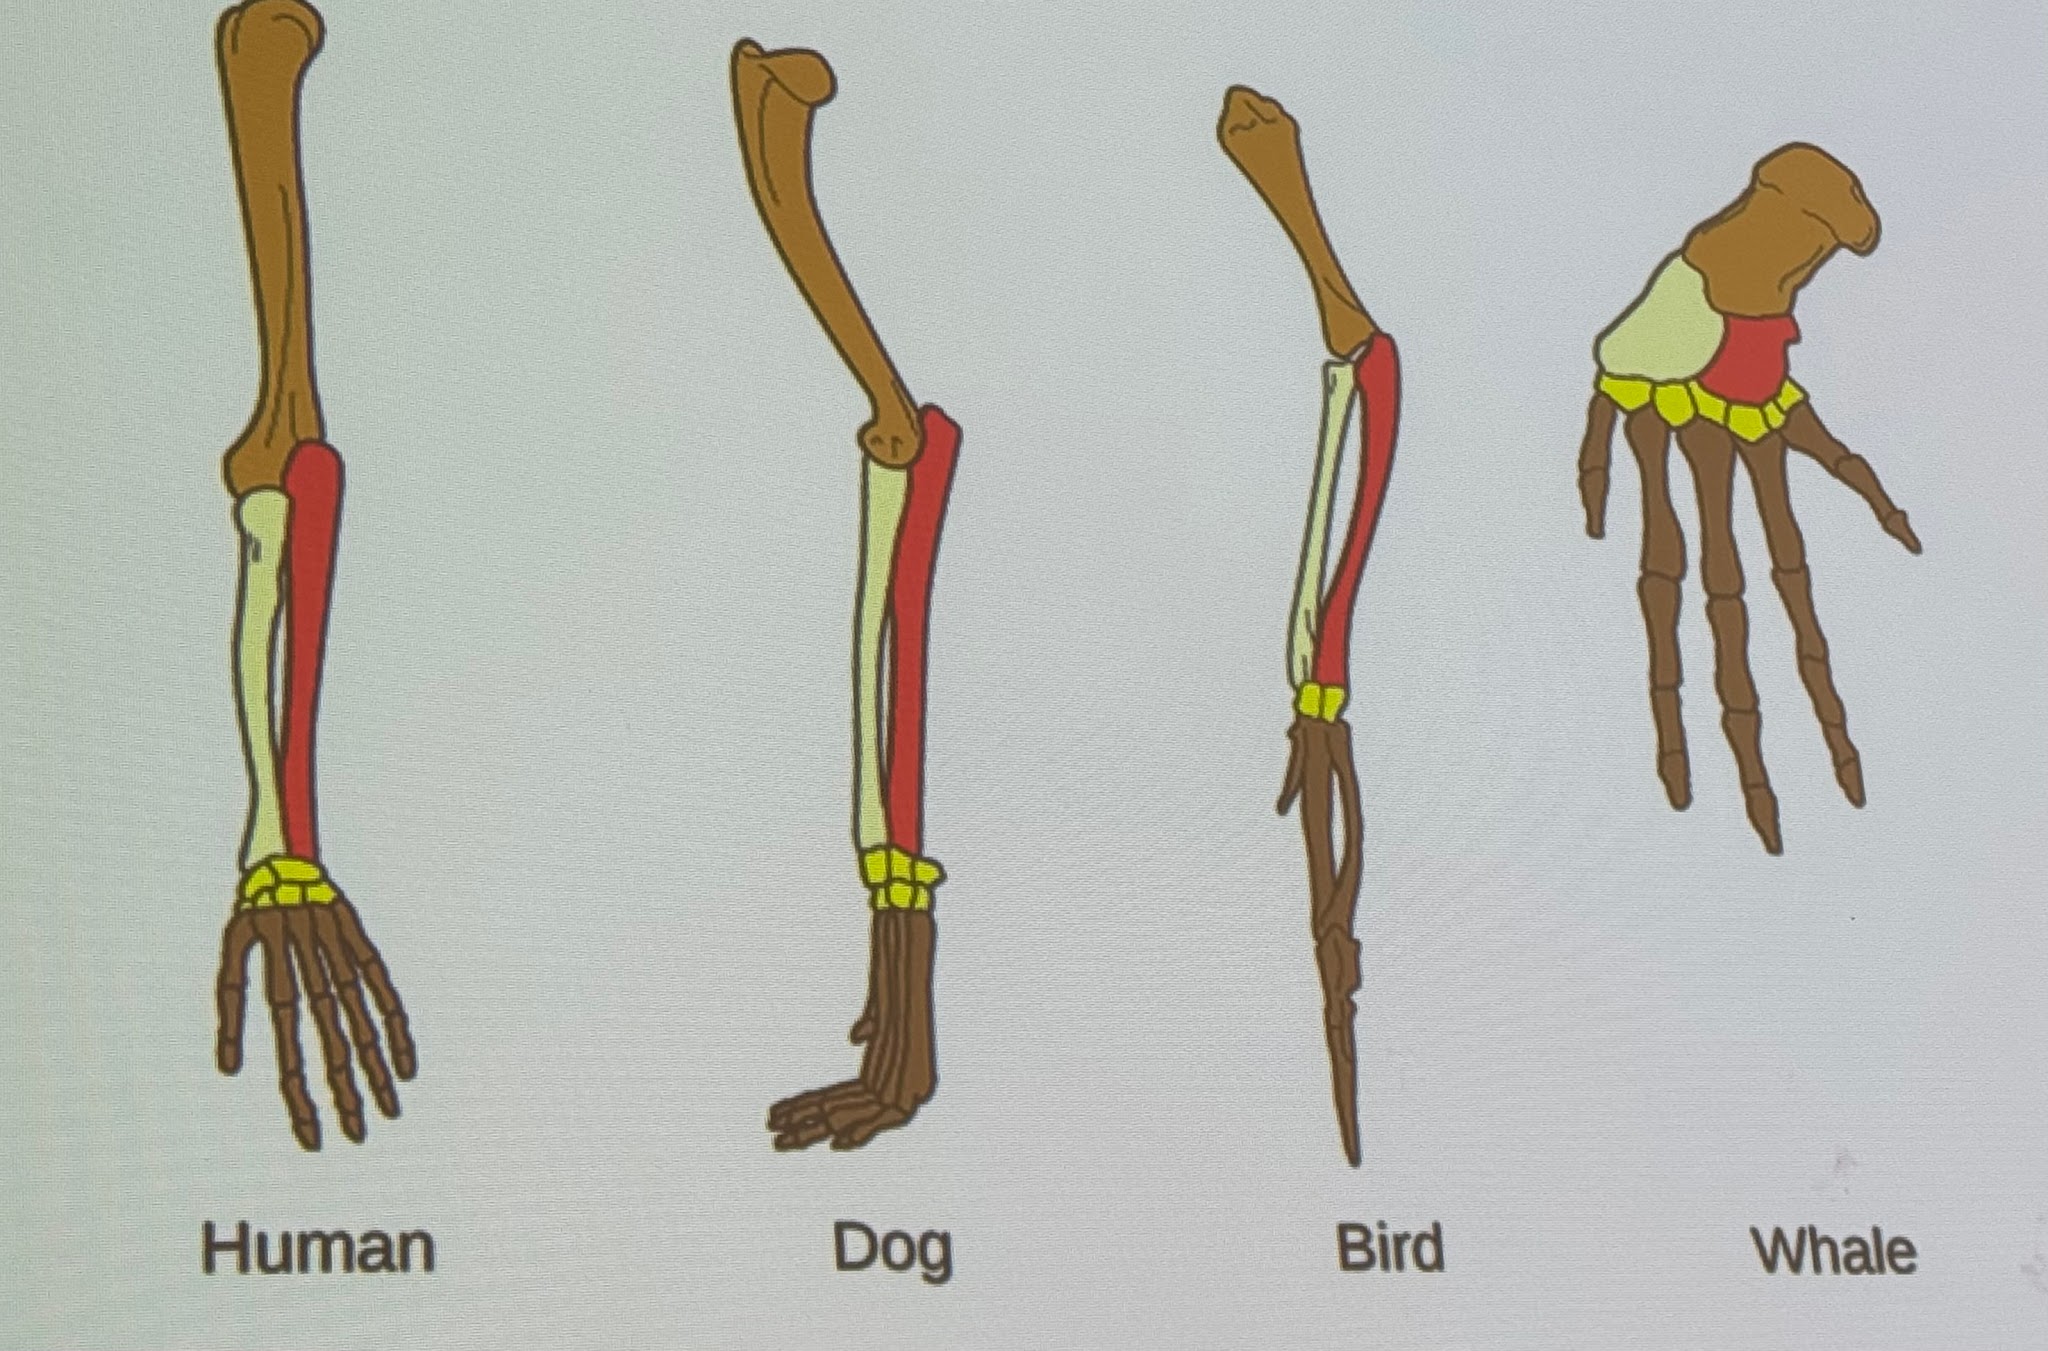
CA has this pattern -> Adaptation/change |
|---|
Embryonic development
Similarities in early development of different animals species because they share CA
Vestigial organs
Undersized and not functional
Evolved from CA in which structures were functional
Ex:
Hind limbs bones in whales and pythons
Wing bones in flightless birds
Muscles to move the human ears
4. Molecular homology
Genetic code is universal
Homologous genes: Inherited from CA
Ex: Humans and bacteria share genes
D. Fossil record
Remains or traces in sedimentary rock of previously existing organisms
Record of ancient organisms
Where and when they lived
Used to infer lines of descent that gave rise to modern-day organisms
Evidence of Evolution
Artificial selection
Direct observation
Homology
Fossil record
Summary
Evolution
Natural selection
Requires heritable phenotypic variation population
Evolutionary mechanisms: Unity and diversity of species
Evolution links all fields in science
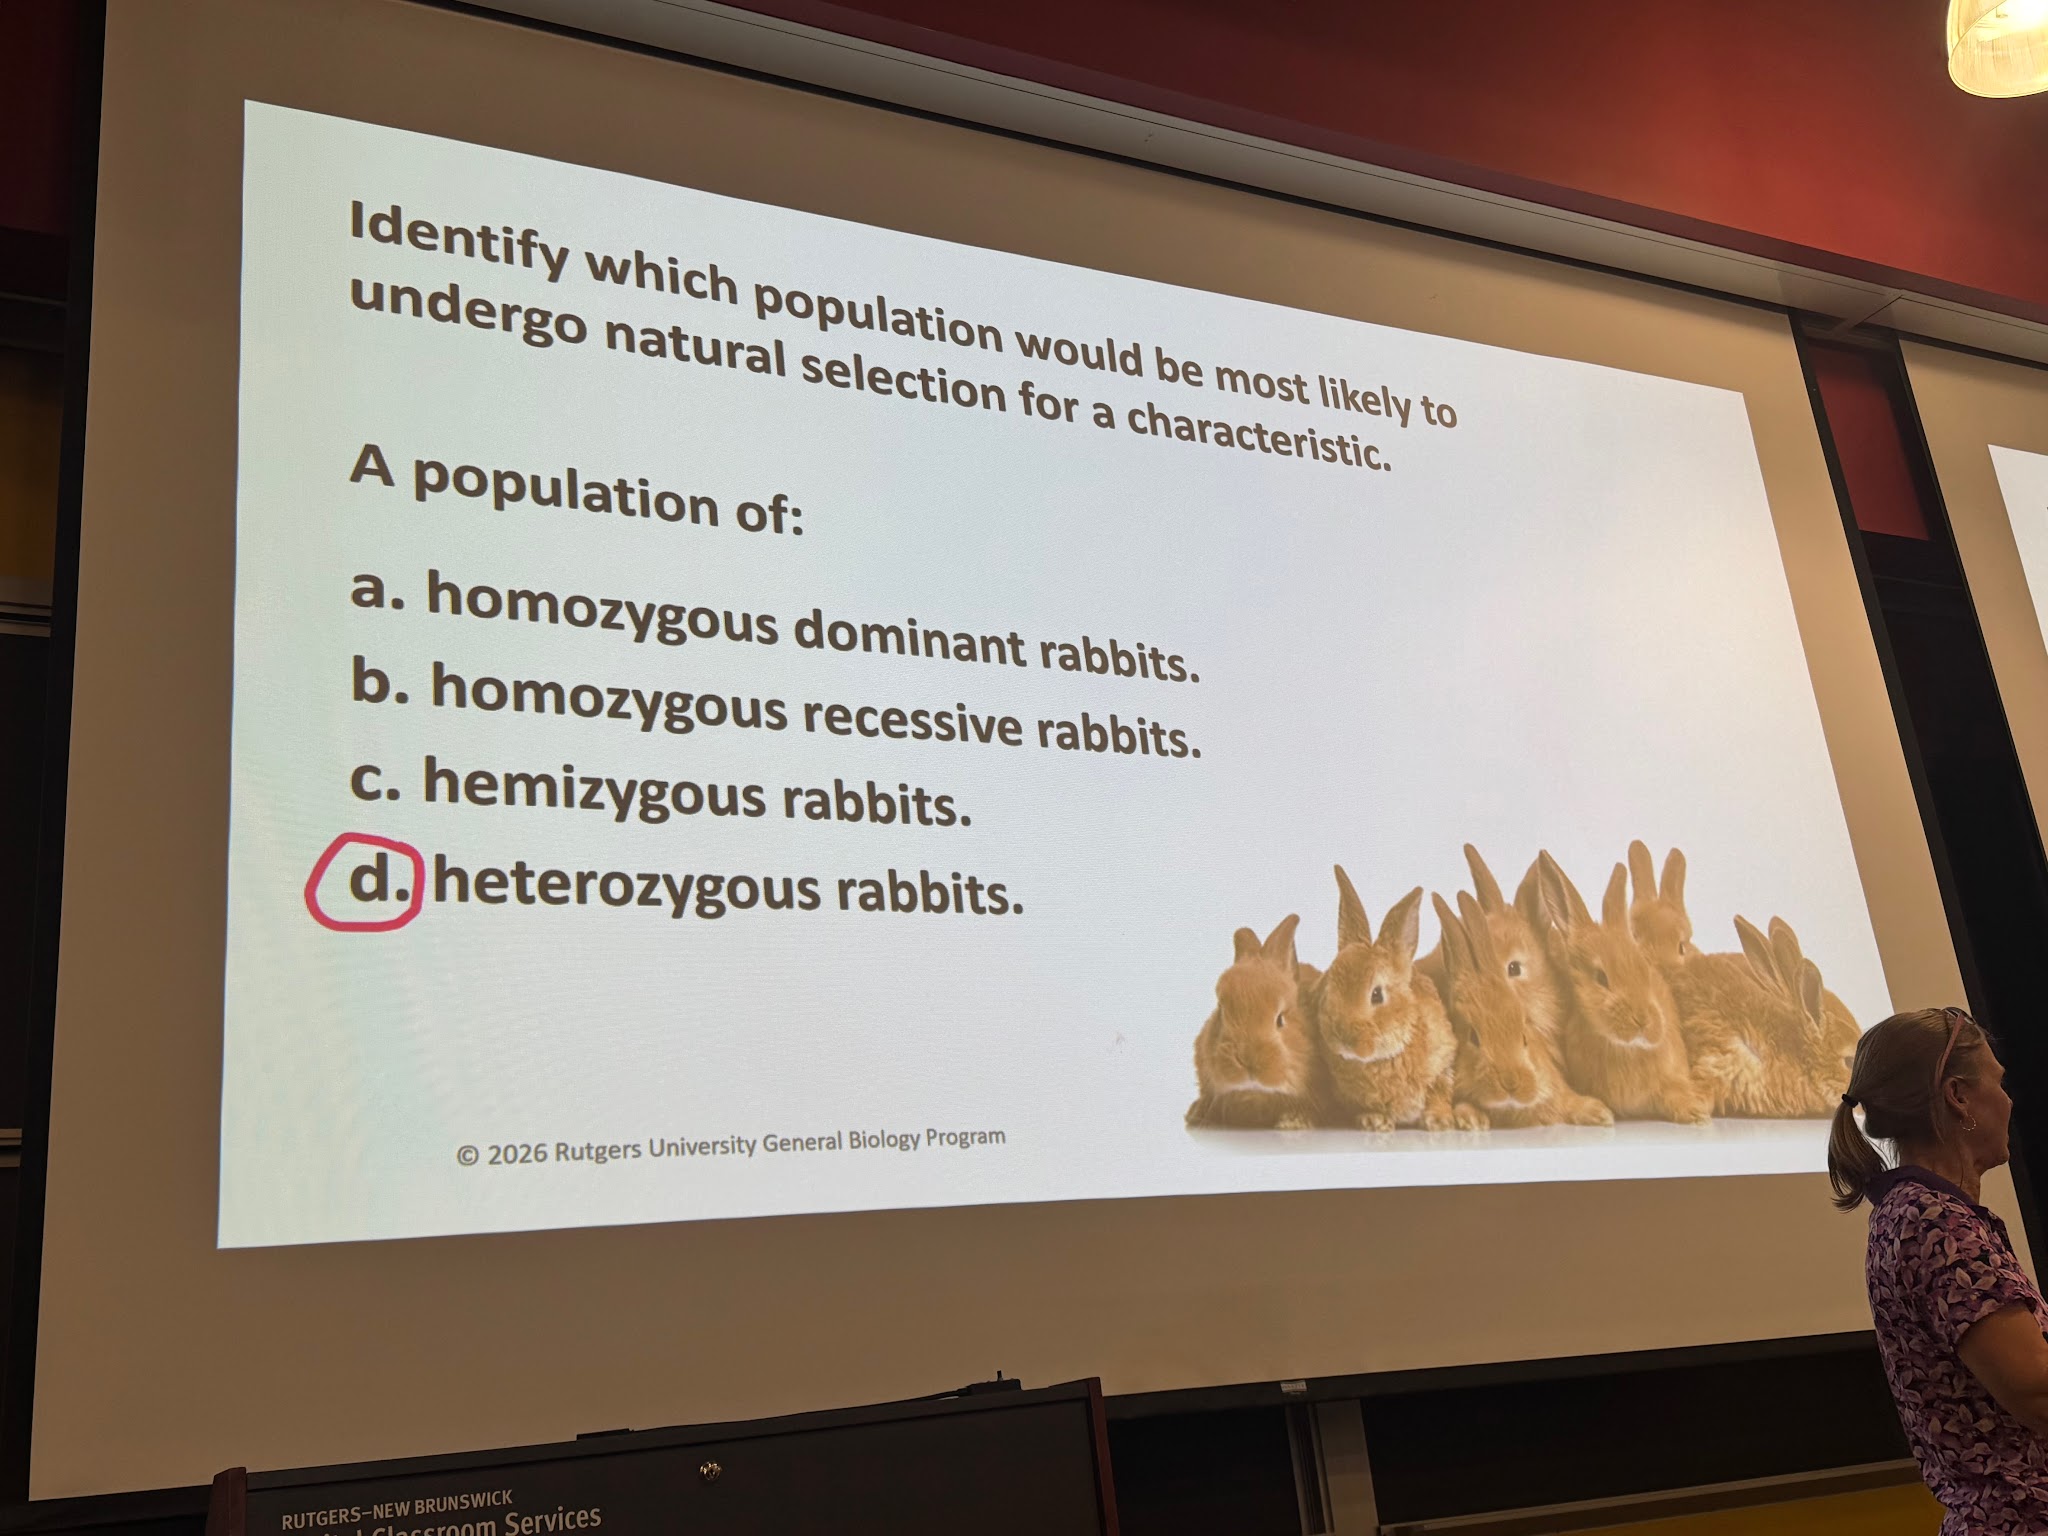
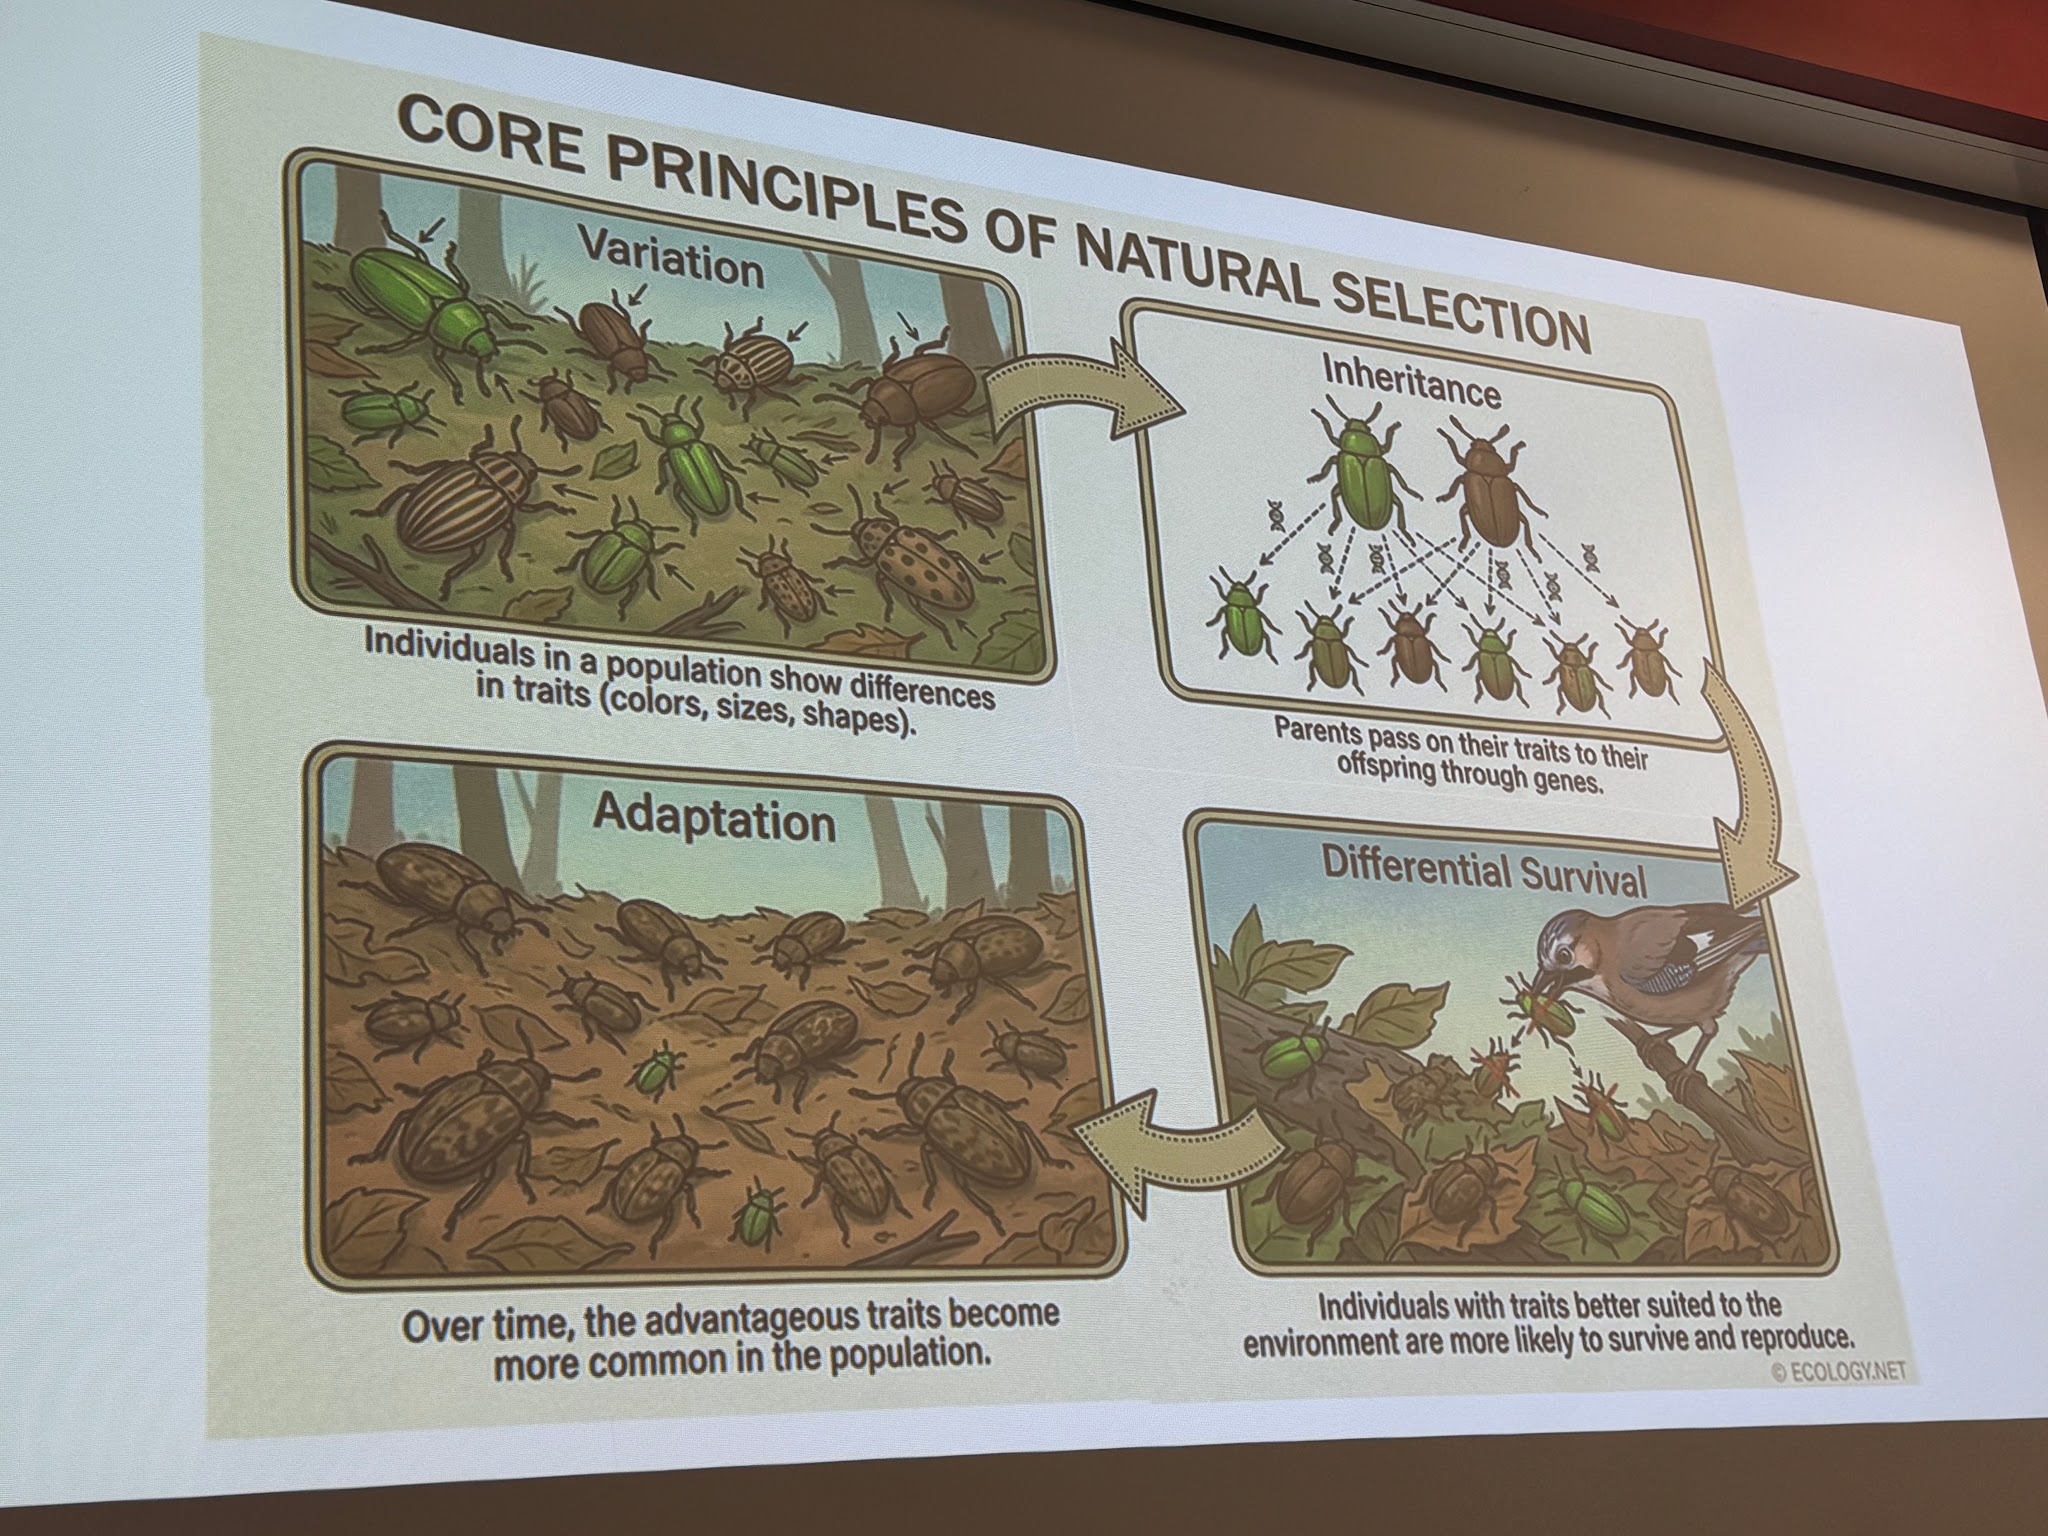
✅ 21: Population Genetics
Key Definitions
Population: Group of individuals of the same species living in the same area at the same time that interbreed to produce viable offspring
Evolution: Change in allele frequencies in populations over generations
Microevolution: Small changes in allele frequencies over a few generations
Population genetics: Study of genetic variability and evolutionary forces in populations
I. Variation in Individuals
A. Phenotypic Variation
Observable differences among individuals
Types:
Either/or variation
Controlled by a single gene
Example: pea plants
Continuous variation
Controlled by multiple genes
Example: human height
B. Genetic Variation
1. Differences in DNA sequences
2. Sources:
Mutation → new alleles
Sexual reproduction → new allele combinations
Key Relationship
Genetic variation → Phenotypic variation → Natural selection
II. Detecting Evolution in Populations
A. Allele Frequencies
Alleles in individuals:
Alternative forms of a gene
Individuals can be:
Homozygous (AA, aa)
Heterozygous (Aa)
Law of Segregation
Alleles separate into gametes
Genotype | Gametes | Allele Frequencies |
|---|---|---|
AA | A only | f(A) = 1.0 |
Aa | A, a | f(A) = 0.5, f(a) = 0.5 |
aa | a only | f(a) = 1.0 |
Alleles in populations:
Gene pool: all alleles in a population
Fixed allele: only one allele present
Allele frequency
Proportion of an allele
Must sum to 1.0
B. Genotype Frequencies
Proportion of genotypes in population
Example:
f(AA) = 0.64
f(Aa) = 0.32
f(aa) = 0.04
Total = 1.0
C. Hardy-Weinberg Equilibrium
Definition
Population is not evolving
Equations
p + q = 1
p^2 + 2pq + q^2 = 1
p = f(A), q = f(a)
p^2 = f(AA), 2pq = f(Aa), q^2 = f(aa)
Conditions (must ALL be met)
Very large population
Random mating
No mutation
No gene flow
No natural selection
→ If any condition is violated → evolution occurs
How to Solve HW Problems
Identify what is given
Use equations
Solve
Key Examples
If p = 0.7, then q = 0.3
If q² = 0.36, then q = 0.6, p = 0.4
Allele frequencies stay the same across generations in HW
III. Factors Affecting Allele Frequencies (Evolution)
A. Genetic Drift
Definition:
Random changes in allele frequencies (strong in small populations)
Effects:
Reduces genetic variation
Alleles lost by chance
Types:
1. Founder Effect
Small group forms new population
Different allele frequencies from original population
2. Bottleneck Effect
Sudden reduction in population size
Survivors not genetically representative
Loss of variation
B. Nonrandom Mating
Random mating:
Equal chance of mating
Nonrandom mating:
No random mixing
Effects:
Does NOT change allele frequencies
Changes genotype frequencies
Example: Inbreeding
Increases homozygous genotypes
Decreases heterozygotes
C. Mutation
Role:
Source of genetic variation
Creates new alleles → changes gene pool
Provides raw material for natural selection
Important Notes:
Not all mutations are passed on:
If in somatic cells → not inherited
Often harmful
Mutations are rare
Usually do NOT significantly change allele frequencies (especially in large populations)
D. Gene Flow (Migration)
Definition:
Movement of alleles between populations
Effects:
Alters allele frequencies in both populations
Can increase or decrease variation
E. Natural Selection
Key Idea:
Main mechanism of evolution
How it works:
Acts on phenotypic variation
Some individuals are better adapted
Results:
Better-adapted organisms:
Survive
Reproduce more
→ Differential reproductive success
Over time:
Favorable traits accumulate
Population becomes better adapted
→ Adaptive evolution
FINAL SUMMARY (what to remember most)
Evolution = change in allele frequencies
Hardy-Weinberg = no evolution baseline
If HW conditions break → evolution occurs
5 forces of evolution:
Genetic drift
Nonrandom mating
Mutation
Gene flow
Natural selection (most important)
✅ 22: Speciation
I. Species
A. Introduction
1. Microevolution
Changes in allele frequency over time in a population
→ Population is still the same species
2. Macroevolution
Large-scale evolutionary changes
→ Leads to formation of new speciesExample: divergence into very different organisms (ex: cats vs dogs)
3. Speciation
Formation of two species from one
Increases biodiversity
Biodiversity facts:
~2 million species identified
Estimated 10–100 million total
B. Species Concepts
1. Morphological Species Concept
Based on physical structure (shape, form, anatomy)
Works for:
Sexual organisms
Asexual organisms
Fossils
2. Ecological Species Concept
Based on ecological niche
Focuses on:
Interactions with environment
Resource use
Works for:
Sexual organisms
Asexual organisms
3. Biological Species Concept (BSC)
Ernest Mayr
Definition:
A species is a group of populations whose members:
Interbreed in nature
Produce viable offspring
Share a common gene pool
Have gene flow between populations
Key idea:
Reproductively isolated from other species
Limitations:
Cannot be applied to:
Fossils
Asexual organisms
II. Reproductive Isolation
Prevents:
Interbreeding
Production of viable offspring
Stops gene flow between species
A. Prezygotic Barriers
(occur before fertilization)
1. Prevention of Mating Attempts
a. Habitat Isolation
Same area, different habitats
Example:
One species prefers sandy soil
Another prefers loamy soil
b. Temporal Isolation
Breed at different times (day, season, year)
c. Behavioral Isolation
Different courtship behaviors or signals
Example: mating calls
Application example:
Eastern vs Western meadowlarks
→ Different songs prevent mating
→ Behavioral isolation
2. Mating Attempted but Fertilization Prevented
a. Mechanical Isolation
Reproductive structures don’t match
“Lock-and-key” mechanism
Examples:
Different genital structures
Flowers & pollinators:
Wide flower → bees
Tube-shaped → hummingbirds
b. Gametic Isolation
Egg and sperm incompatible
External fertilization:
Egg receptors bind only same-species sperm
Internal fertilization:
Sperm cannot survive in different species’ reproductive tract
B. Postzygotic Barriers
(occur after fertilization)
1. Reduced Hybrid Viability
Embryo fails to develop properly
→ Dies early
2. Reduced Hybrid Fertility
Hybrid survives but is sterile
Example:
Horse (2n=64) × Donkey (2n=62) → Mule (63 chromosomes, sterile)
3. Hybrid Breakdown
First generation is viable
Later generations:
Weak
Sterile
III. Process of Speciation
Formation of new species from one original species
Requires:
Reproductive isolation
Gene pool divergence
A. Allopatric Speciation (“Other homeland”)
Most common
1. Separation
a. Geographic Barriers
Mountains
Rivers
Lakes
→ Populations become isolated
b. Migration
Small group colonizes new area
→ Founder effect
2. Divergence
Gene pools evolve separately
Even if populations meet again:
They cannot interbreed
B. Sympatric Speciation (“Same place”)
Occurs without geographic isolation
New species forms within same area
Less common
Mechanisms of Sympatric Speciation
1. Polyploidy
More than 2 sets of chromosomes
Process:
Meiosis error → gametes are diploid (2n)
Fertilization → tetraploid (4n)
Result:
4n organisms:
Can reproduce with each other
Cannot reproduce with original 2n population
Notes:
Common in plants
Rare in animals
2. Sexual Selection
Differences in traits (appearance, behavior)
→ Can lead to reproductive isolation
3. Habitat Differentiation
Subgroups use different resources or habitats
→ Reduces interaction → speciation
IV. Pace (Rate) of Speciation
A. Speciation Models
1. Punctuated Equilibrium
Long periods of little/no change
Short bursts of rapid evolution
Triggered by environmental change
2. Gradualism
Slow, steady accumulation of changes
Continuous evolution over time
Proposed by Darwin
B. Speciation Rates
Range:
4,000 years → 40 million years
Average:
~6.5 million years
Example: Euhadra (Japanese land snail)
Single gene change → shell spirals differently
Changes genital alignment
→ Cannot mate
= Mechanical isolation
Extra Concepts (from notes)
Tree of Life
All organisms share a common ancestor
Speciation creates branching pattern of life
Scientific Method
Observation
Question
Hypothesis
Prediction
Experiment
Analyze results
Conclusion:
Supported
Not supported → revise
Report results
✅ 23: Phylogenetics
Evolution
Decent with modification
Natural selection
Populations (Individuals do not evolve) (change in allele frequencies)
Systematics
The study of diversity of organisms and evolutionary relationships
2 Parts
- Taxonomy = Describing, naming, and classifying
- Phylogeny = Evolutionary history
Taxonomy
1. Binomial nomenclature
a. Naming species (Developed by Carolus Linnaeus - unique 2 part name)
b. Genus + specific epithet (Ex: Homo sapiens)
Named 11,000 species of plants and animals -> Still used today
c. Rules (Ex: Tyto alba)
- Latin/latinized
- Genus name upper case, but specific epithet is not
- Both italicized or underlined
- Genus can be abbreviated (T. alba)
2. Hierarchical classification
a. Species = smallest unit of classification
b. Levels
Domain
Kingdom
Phylum
Class
Order
Family
Genus
Species
Taxon (taxa pl.) - grouping of organisms at any one of these levels
Ex: Family genus & species
Mnemonic - learning technique that aids in encoding/retrieval of info
Dear King Phillip Come Out For Goodness Sake
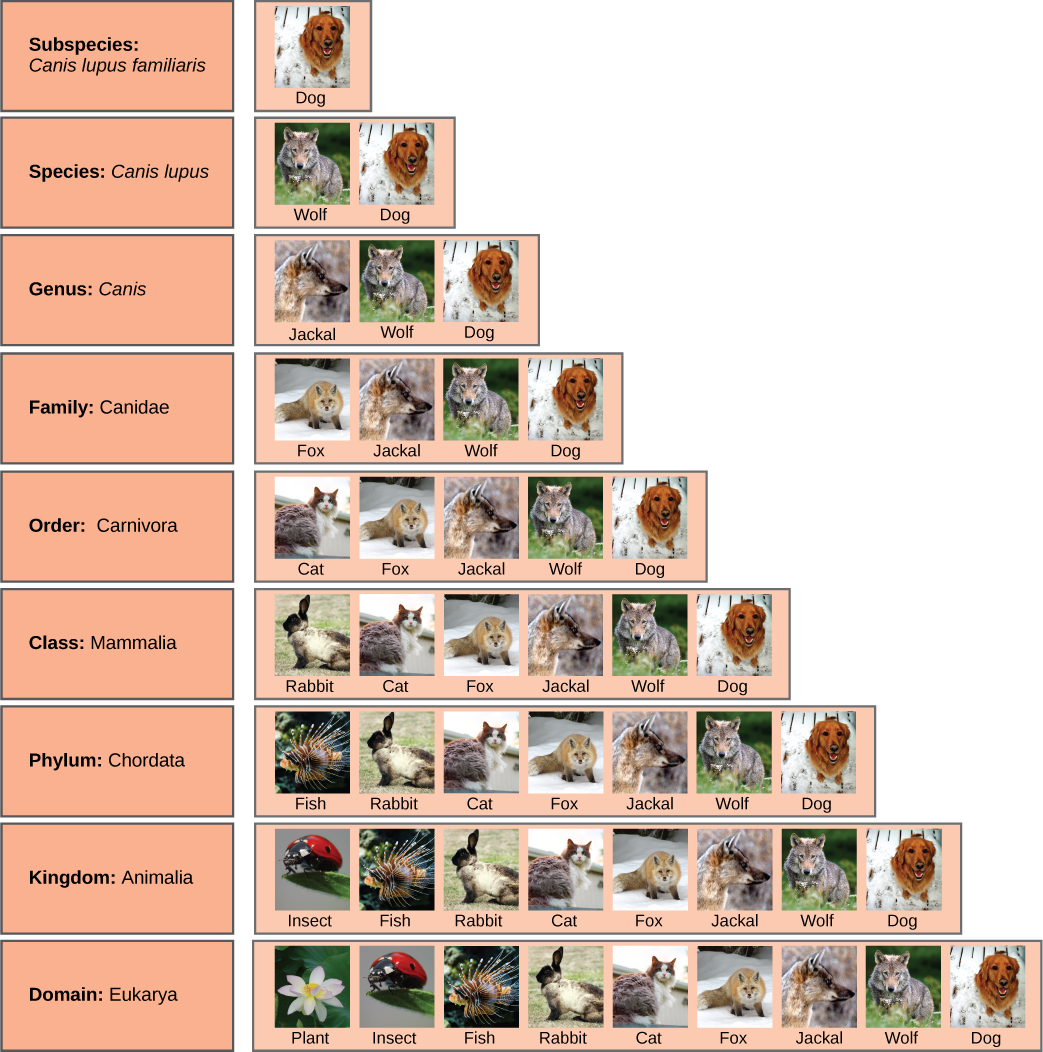
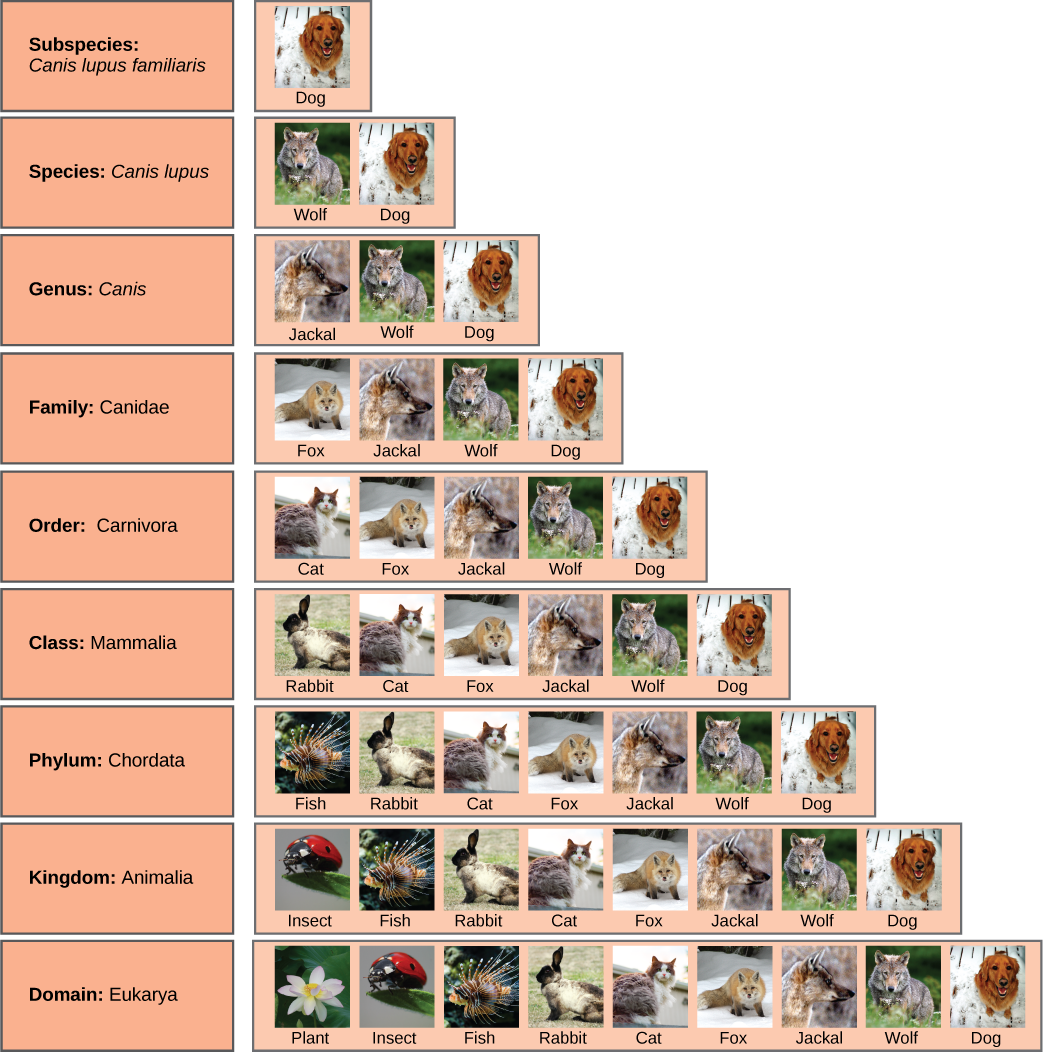
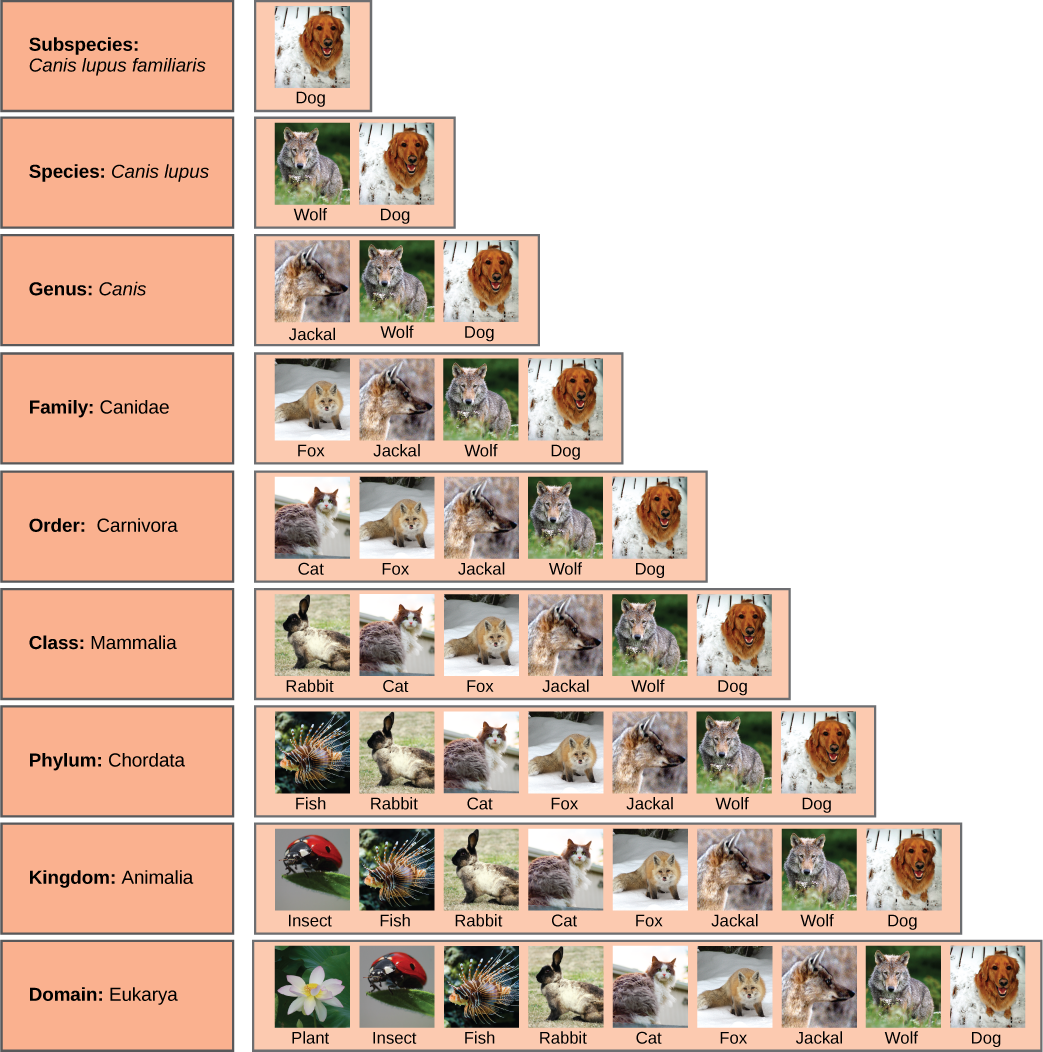
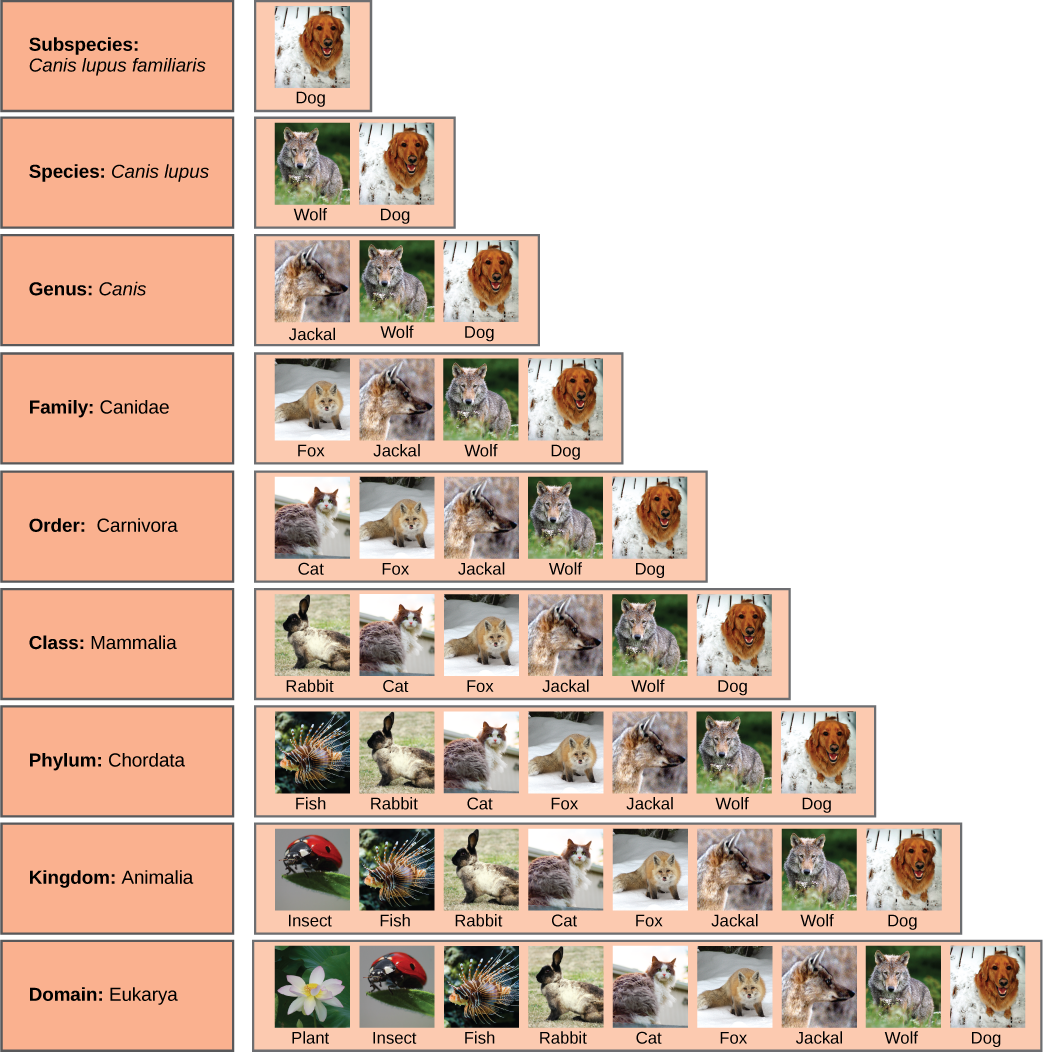
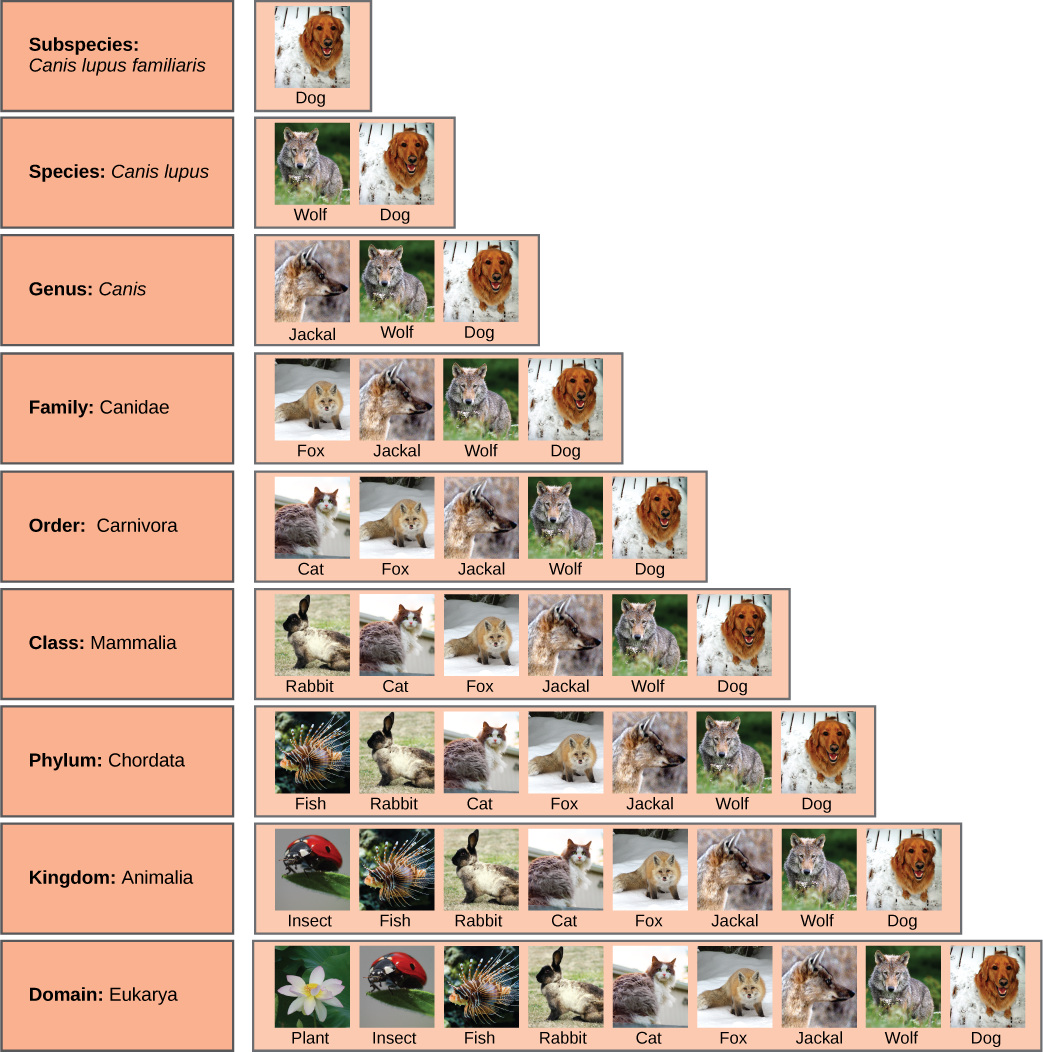
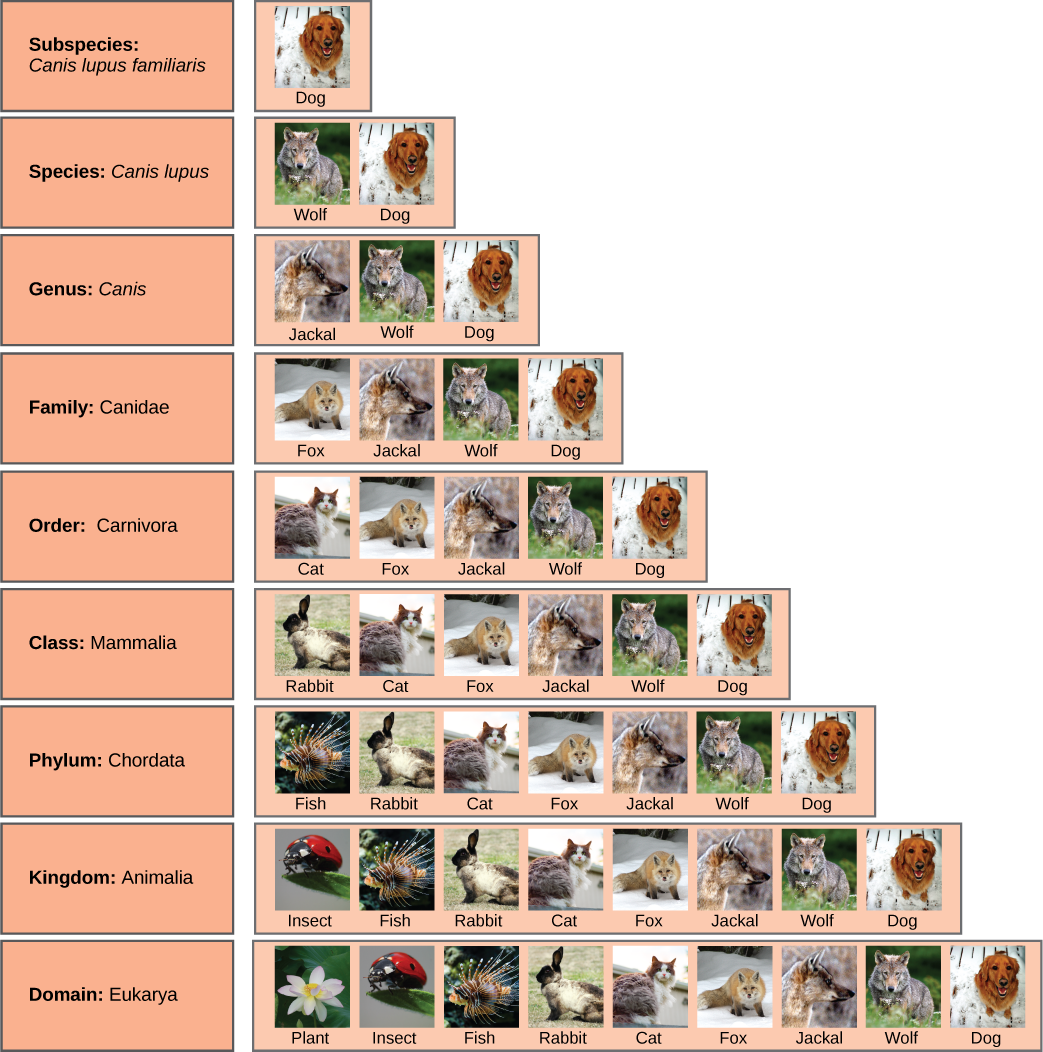
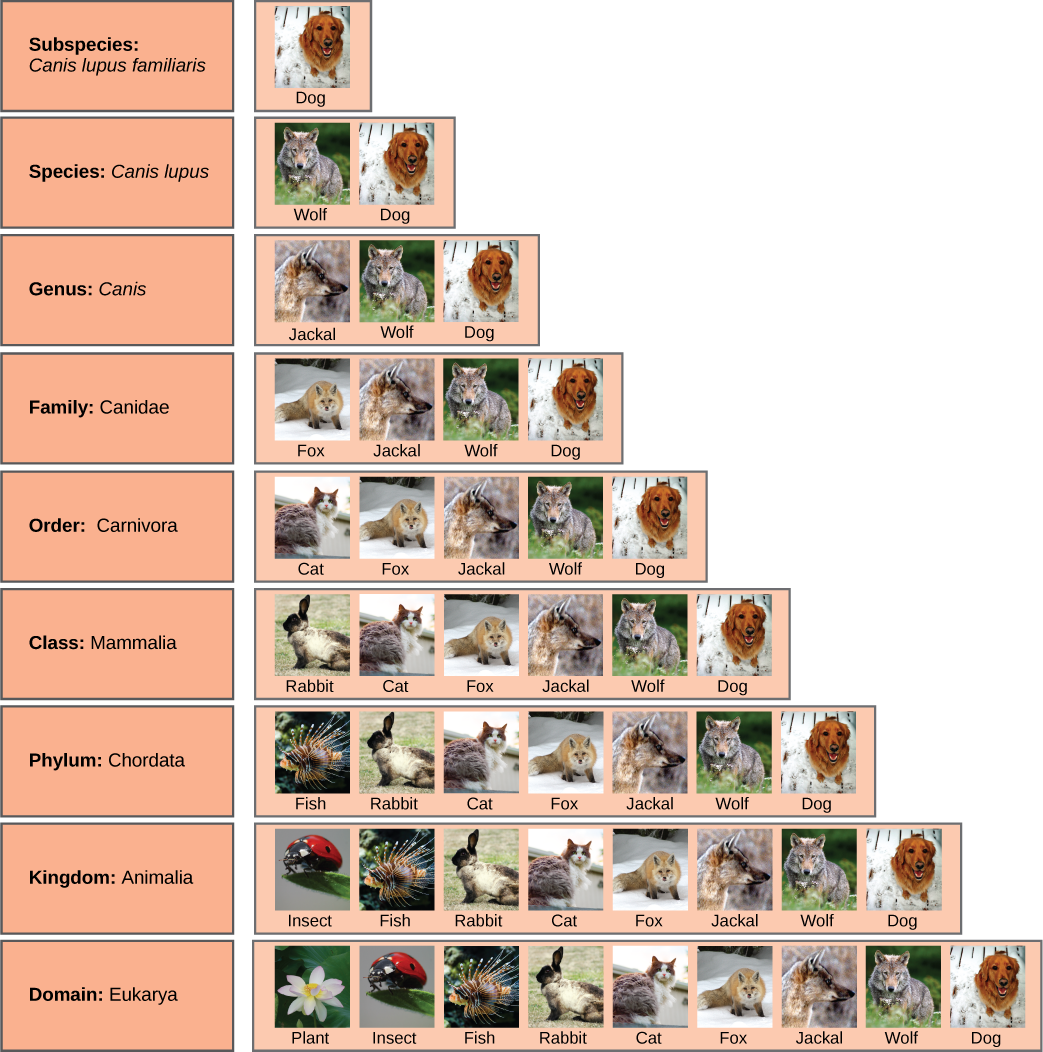
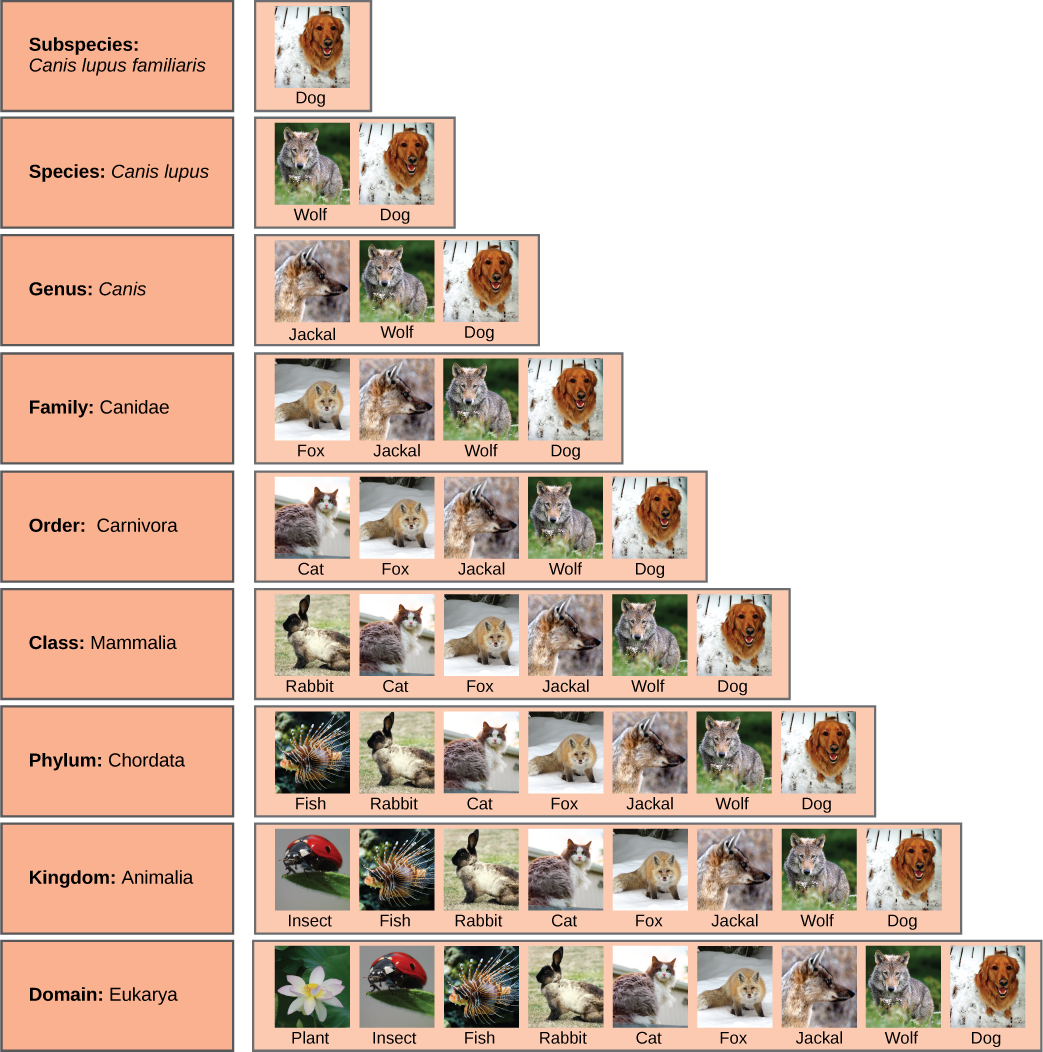
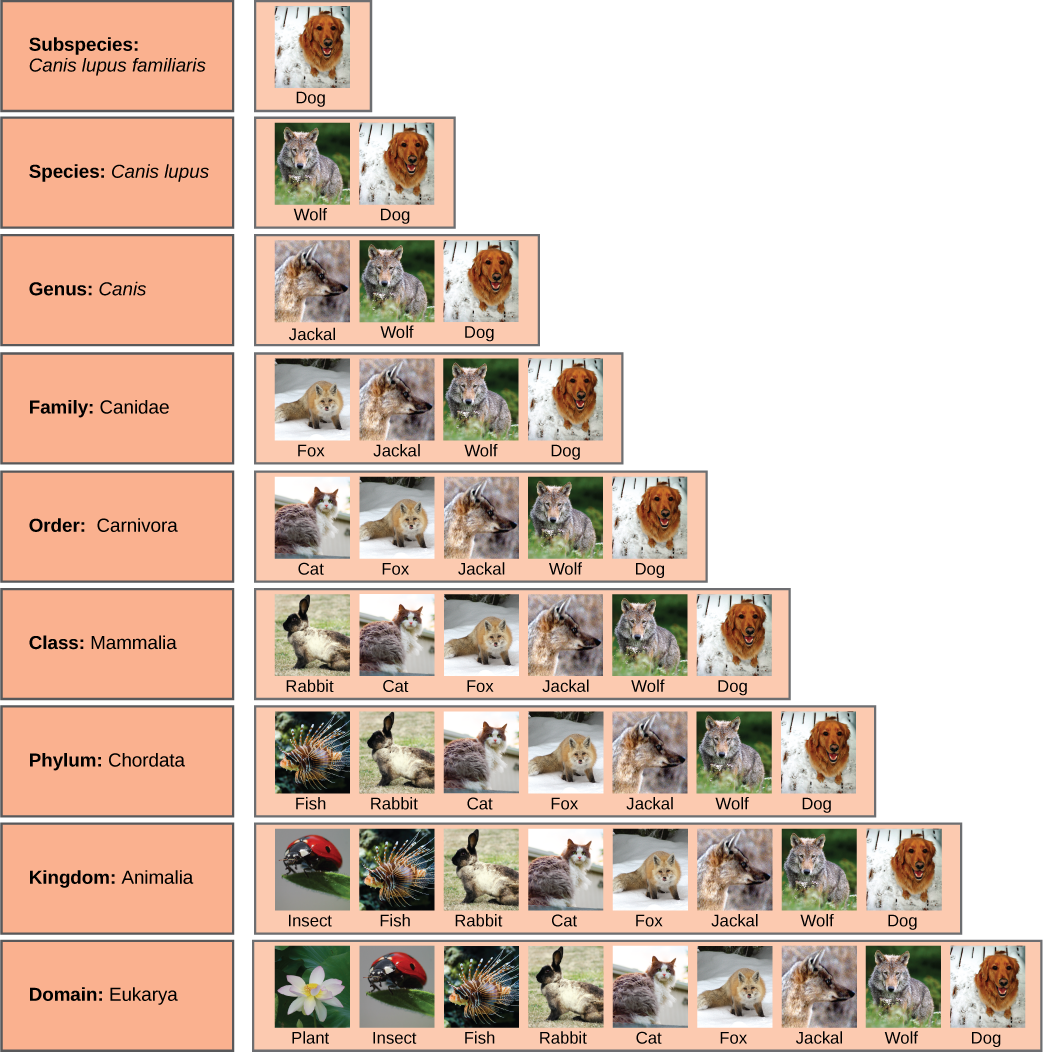
c. From species to domain
-> Each level more inclusive
d. All species at a level share characteristics of that group
Ex: Spinus tristis
Domain Eukaryota
Kingdom Animalia
Phylum Chordata
Class Aves
Order
Family
Genus
Species
Phylogeny
- Study of evolutionary history and relationships among organisms
- Based on shared ancestry, not phylotypic similarity
II. Basics of phylogenetics
Phylogenetic tree
Branching diagram
Patterns of descent from a common ancestor (CA)
Many hypothesis

B. How to read a tree
Most recent common ancestor
Root
Ancestor from which all taxa in tree have descended
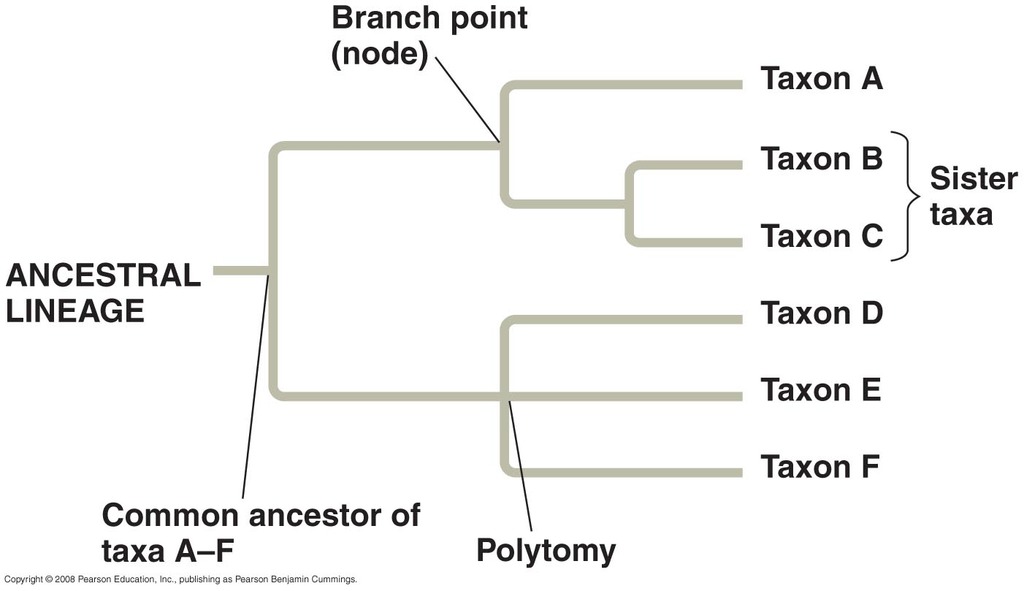
Branch points = Nodes
Dichotomies: Divergencies of 2 lineages from a CA
Branches can rotate without changing relationships
3. Extant species
Currently living
At tips of branches
4. Basal Taxon
1st lineage to diverge from CA of group
5. Sister taxa
Organisms that share an immediate CA
Each other’s closest relatives
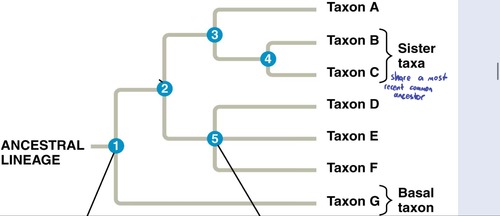
6. Polytomy
- Branch point with > 2 descendent groups
- Evolutionary relationships not clear
Summary

III. Constructing phylogenies
Character
Defined attribute of a species
States: Alternate forms of a character
Ex: Four legs
| Ex: Body covering
|
|---|
Compare characteristics and states
-> The more closely 2 species are related, the more they share
Must result from common ancestry
Character states may be similar for two reasons
Homologous (inherited from a CA)
Connection -> Intro to evolution
Look and function differently
Underlying structure is the same
Inherited from CA
Homologous structures
Share common evolutionary relationships
Analogous
Independently acquired
Similar adaptations in organisms from different evolutionary lineages
Similar environment
-> Similar selection pressure
-> Similar character
(Do not share a CA with that character)
-> Convergent evolution
Analogous structure

Aerodynamic principles
-> converged on structures for flight
5. Choosing characters
Ex: Anatomical/morphological features
Developmental and life history traits
Molecular data
a. Morphological data
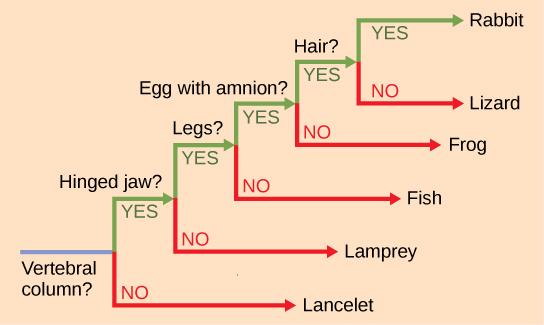
b. Molecular data
- Compare DNA sequences
Genes are sequences of 100s of nucleotides
Ex: 12 nucleotides -> 12 characters
A, C, G, or T at each site -> States
If a gene in 2 organisms shares many nucleotides
then possibly homologous
Compare RNA sequences
Compare amino acid sequences of proteins

B. Cladistics
1. Widely used method of systematics
Uses homologies to classify organisms based on common ancestry
Claude - group which includes ancestral species and all its descendants
2. Three possible groups
Monophyletic group (clade)
| Paraphyletic group
| Polyphyletic group
|
|---|
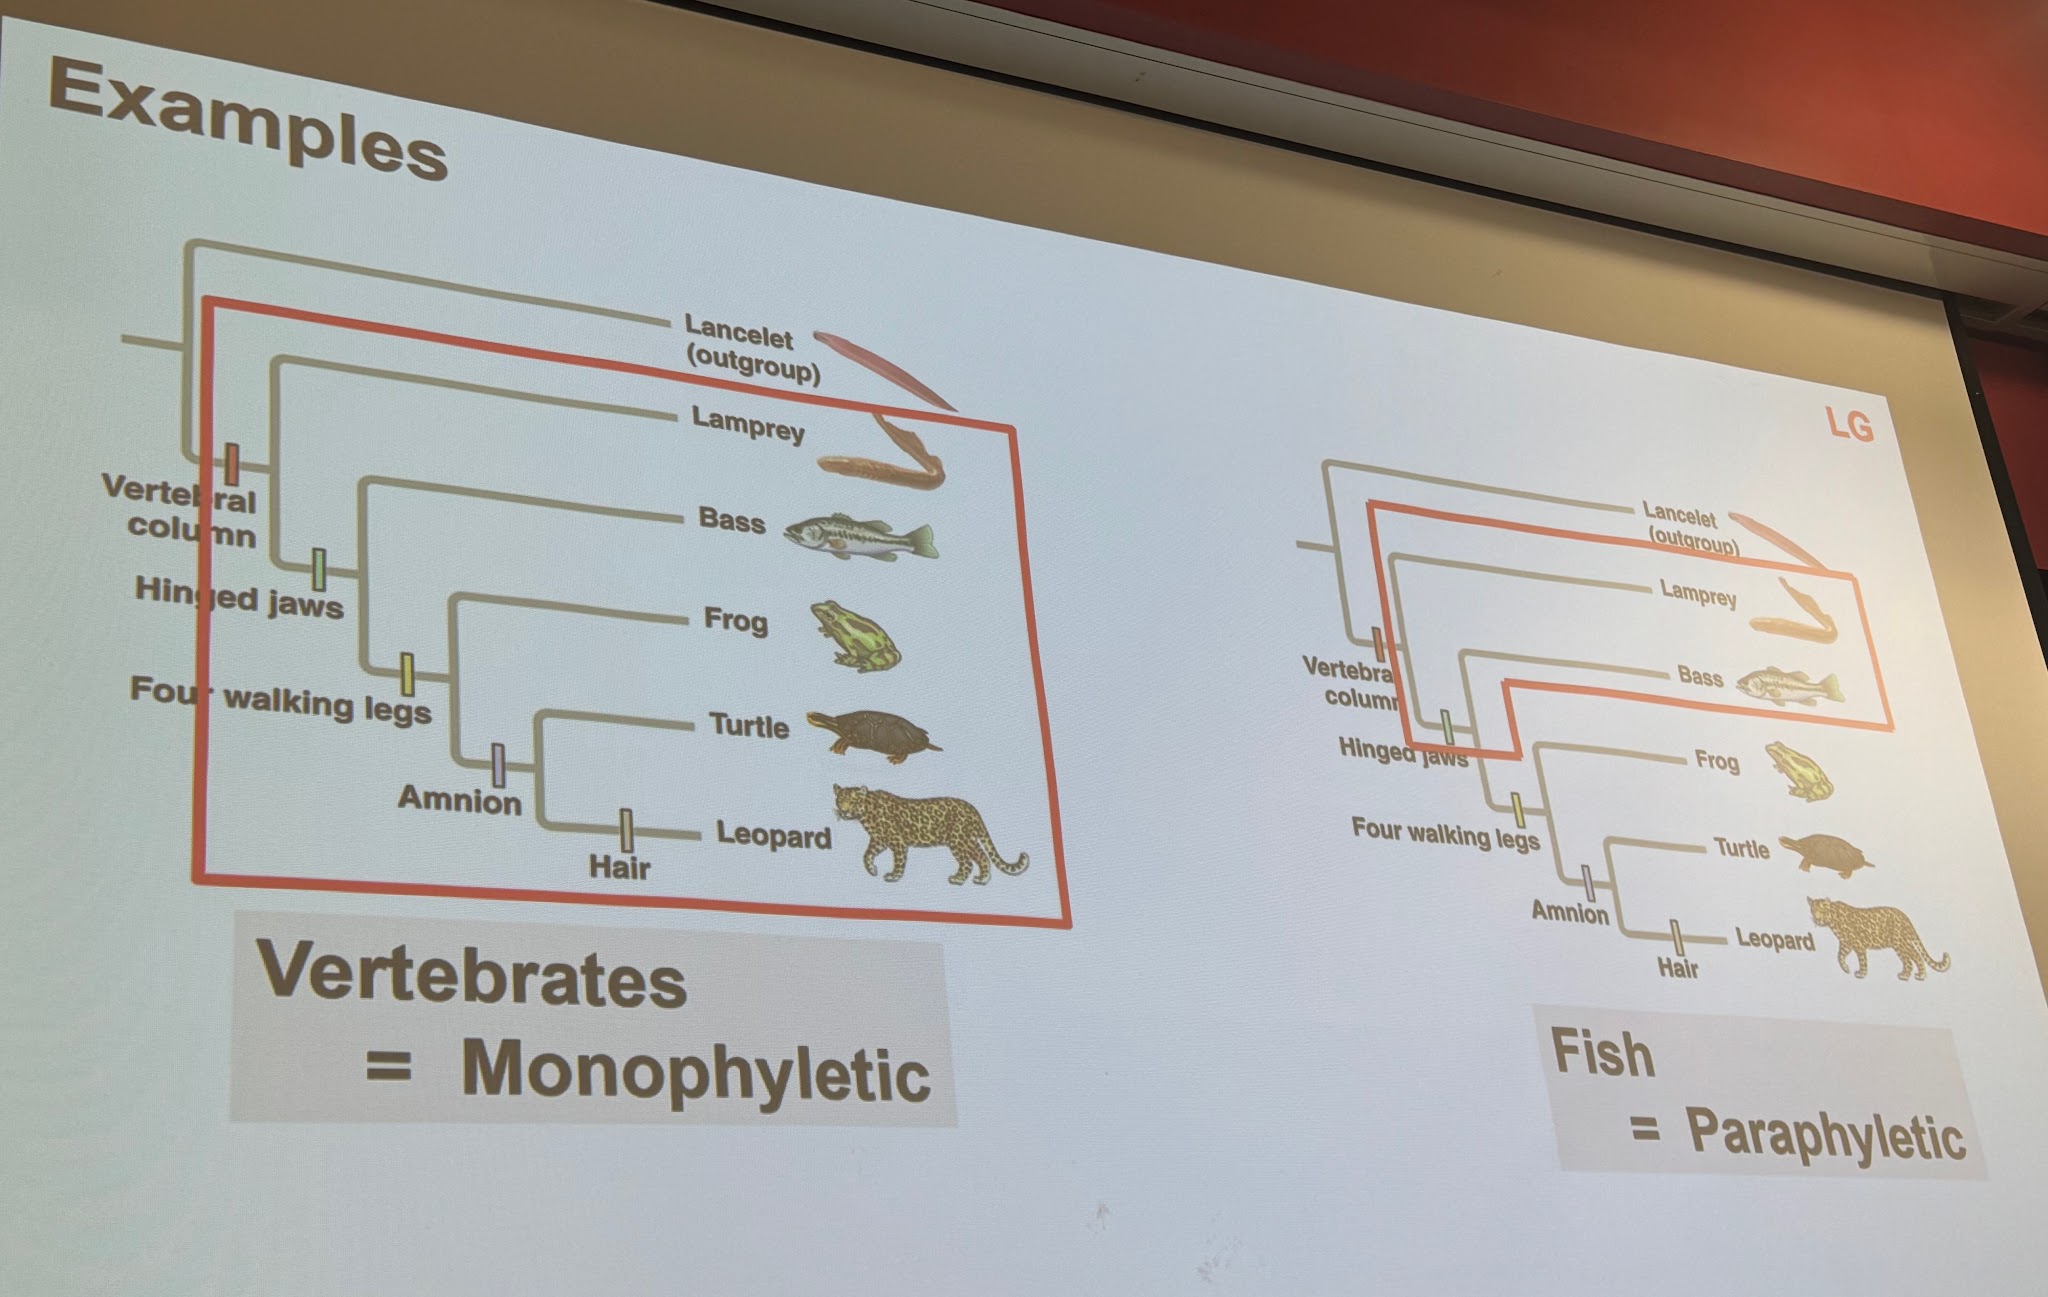
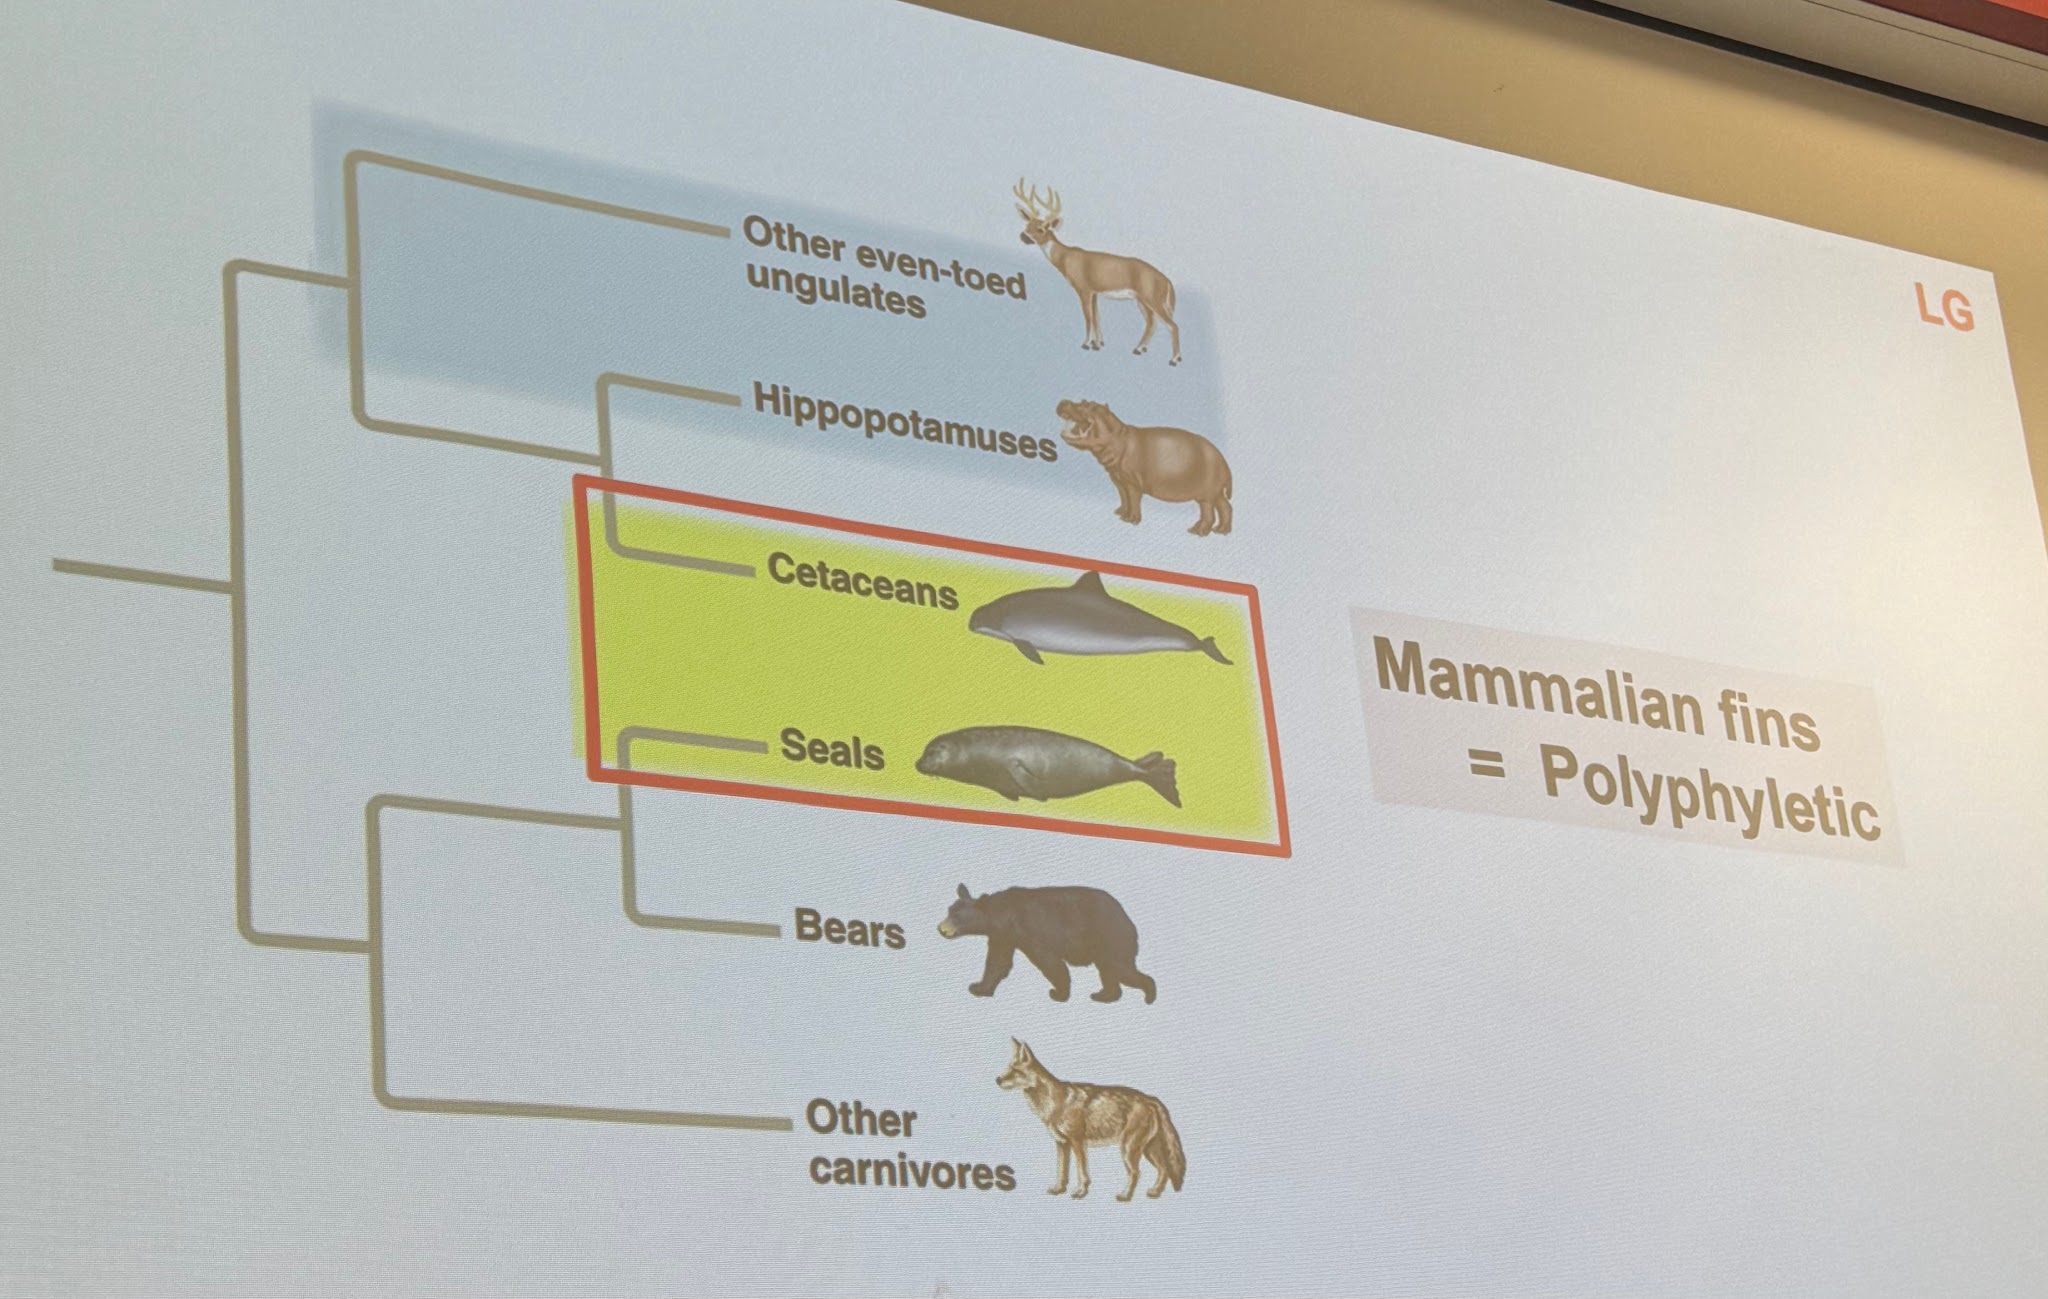

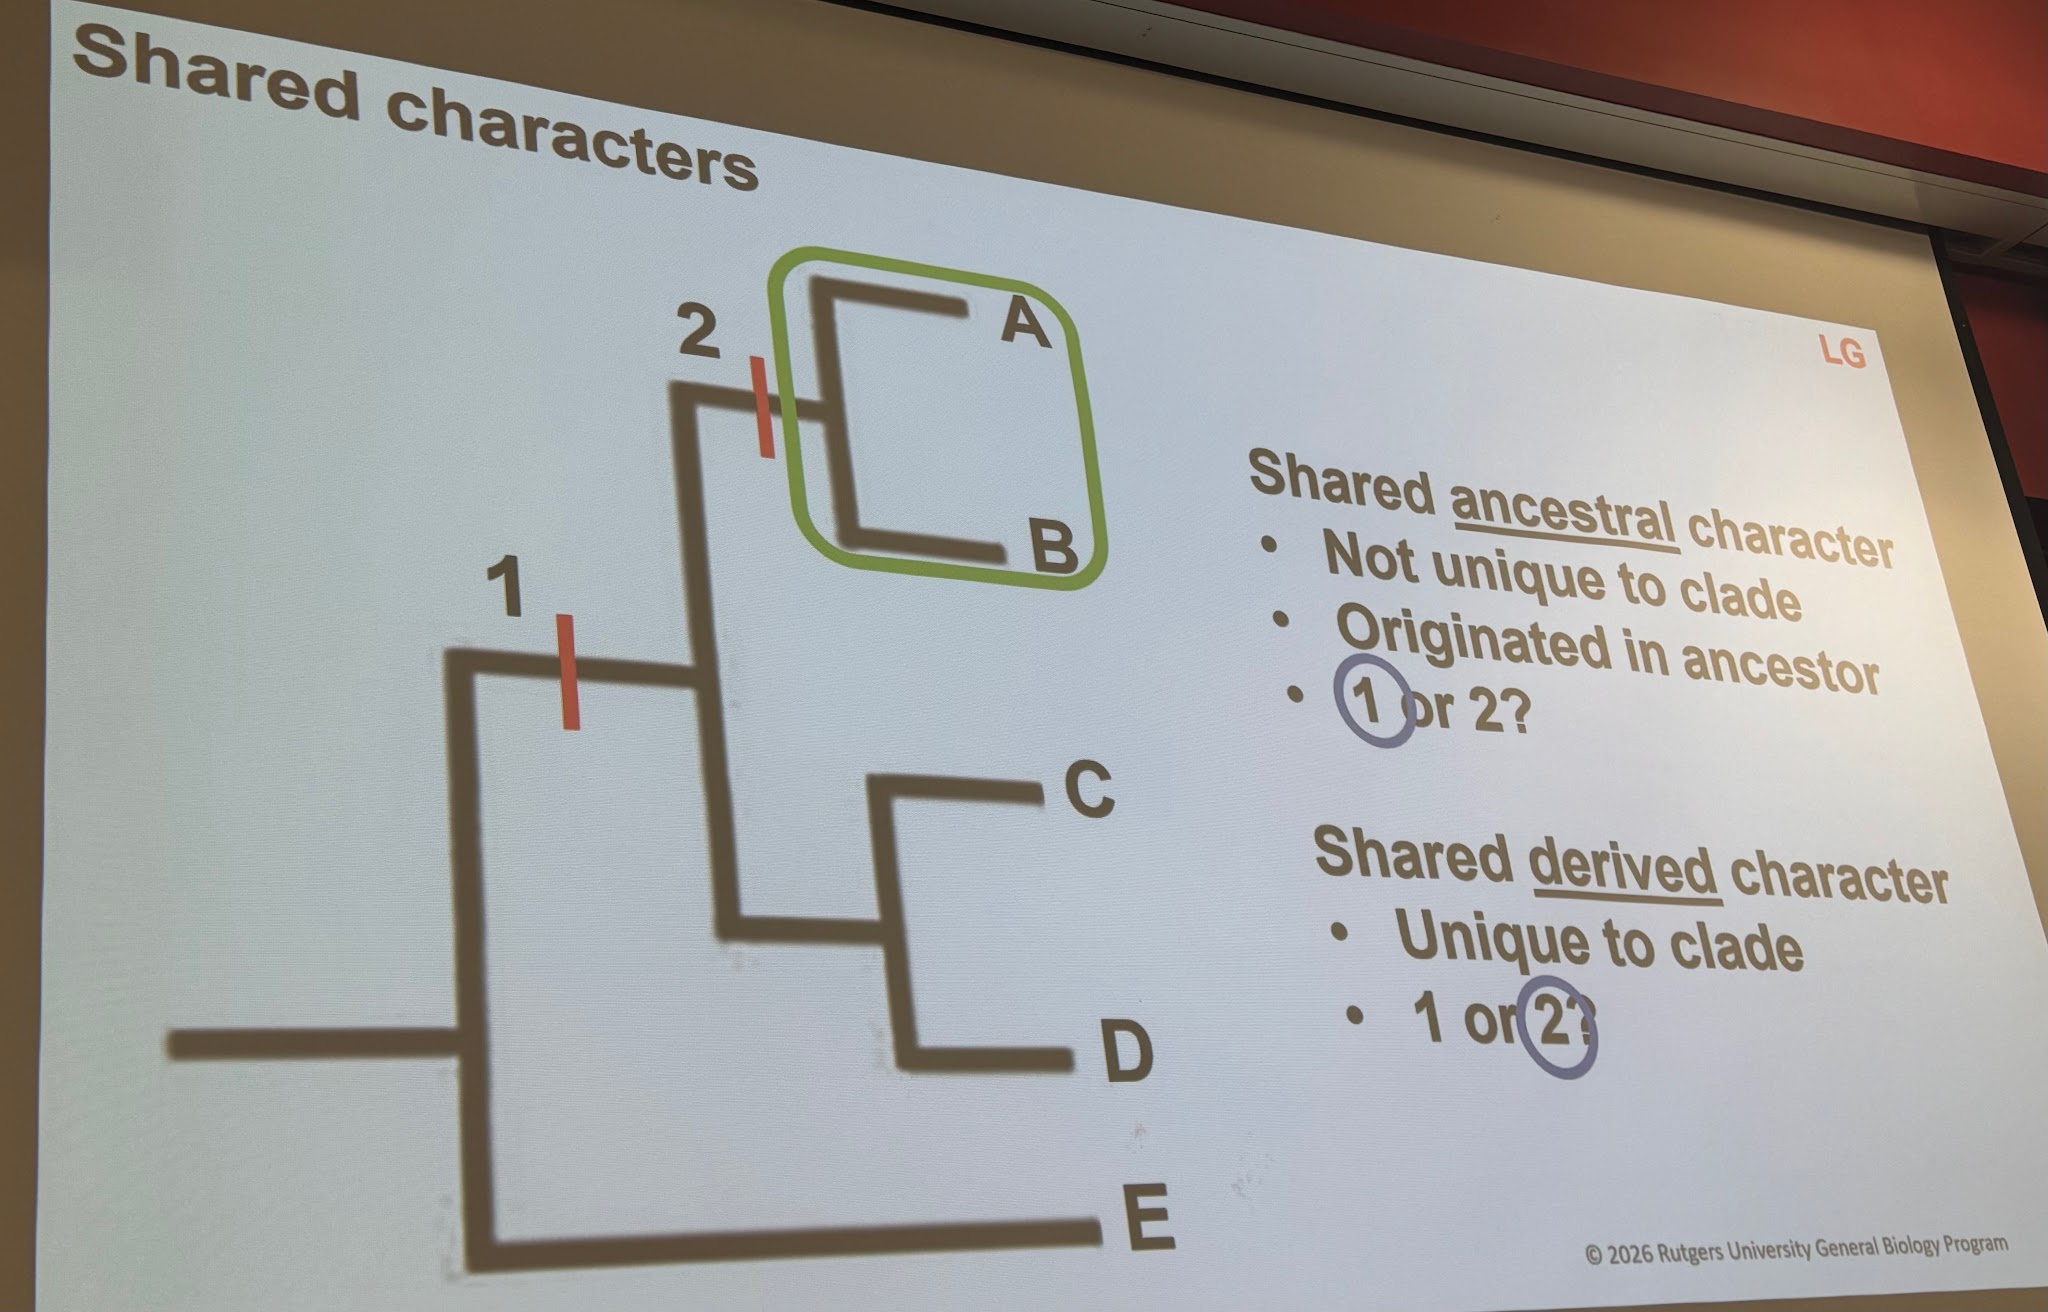
GB 116
Lecture 1 = phylogenetics review and virology
✅ 25: Population Ecology
Ecology
Study of interactions between organisms and environment
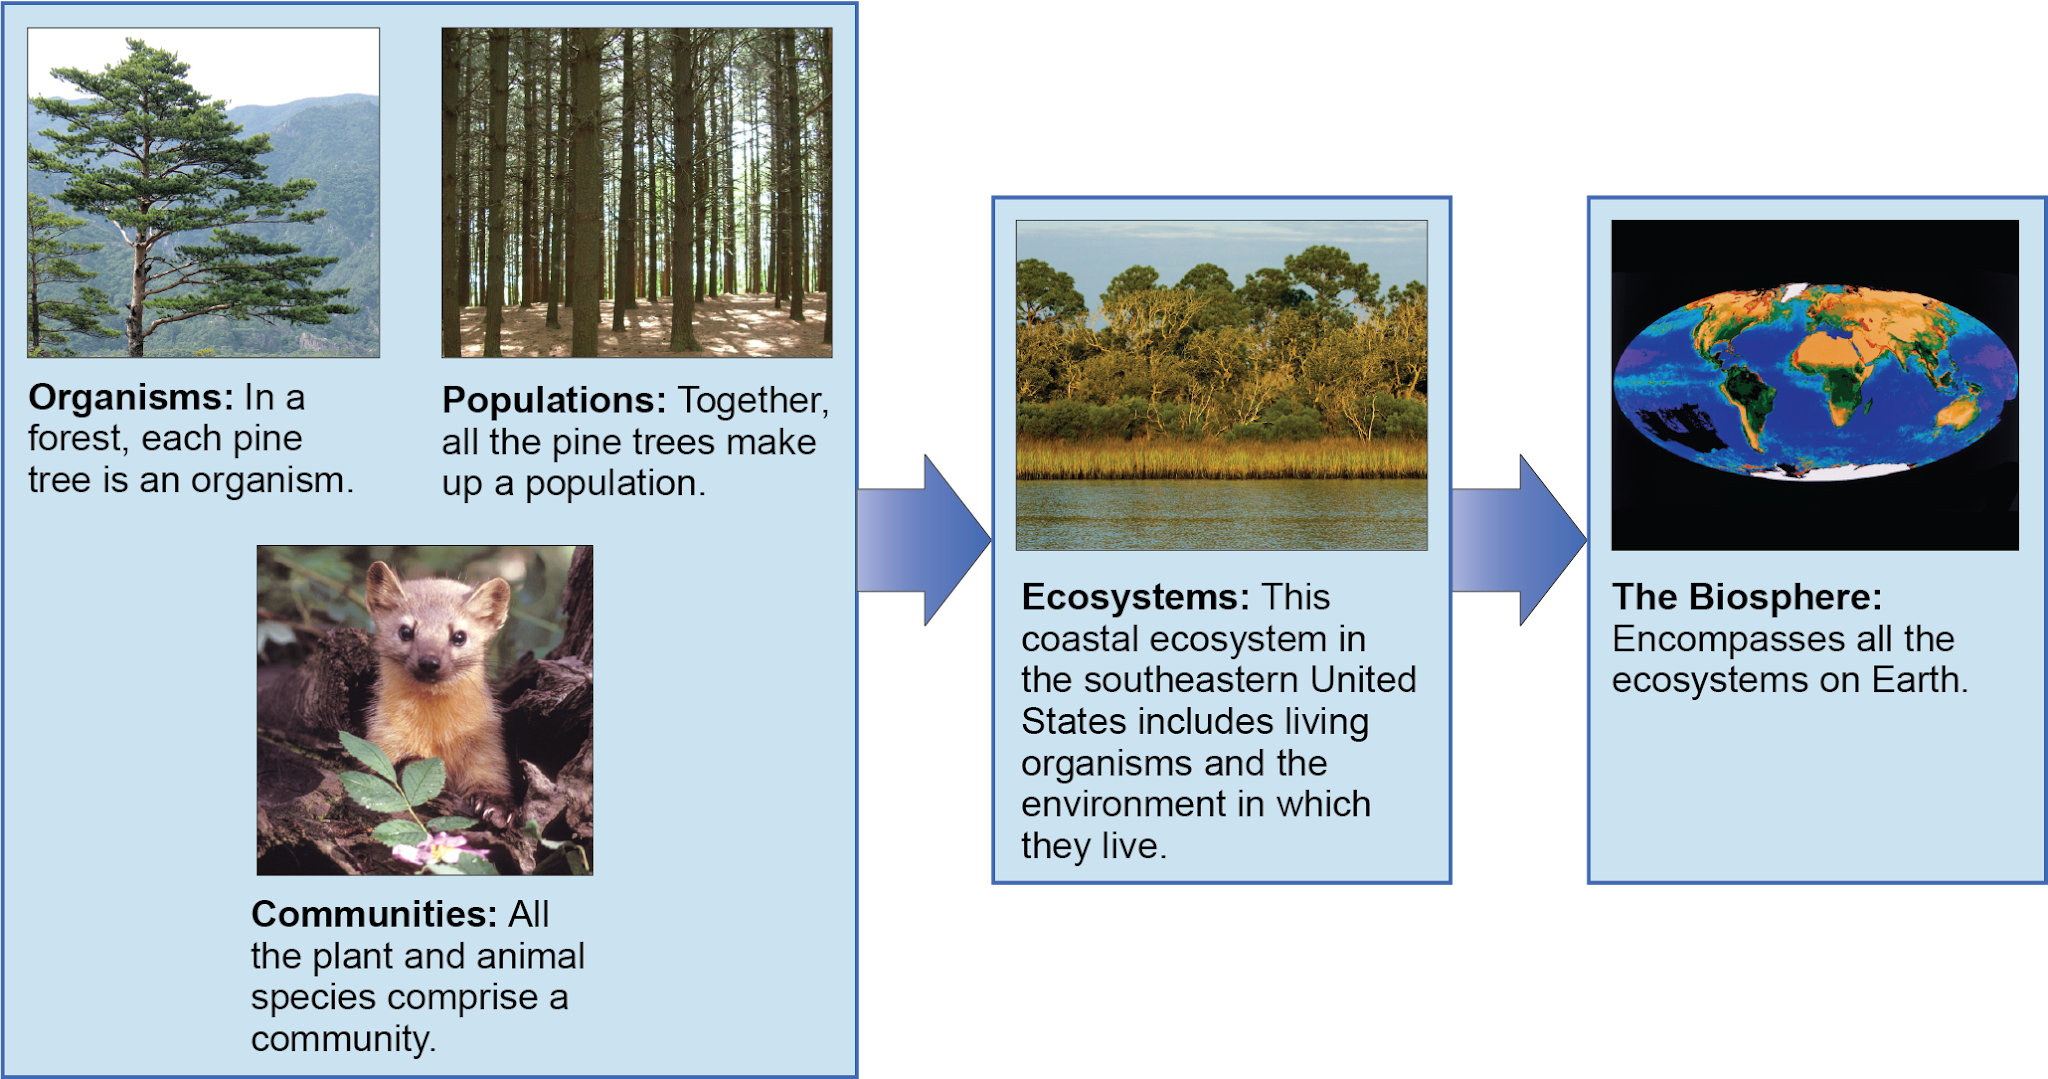
Introduction to population ecology
Basic concepts
Population
Definition
Interact and breed
Share common gene pool
Same resources and environmental factors
Evolves as a natural selection acts on variation
Population ecology
How biotic and abiotic factors affect populations
How and why populations change over time
Features of populations
Size: # of individuals
Density: # of individuals per unit area or volume
Population size | Population density (per square mile) | |
|---|---|---|
Middlesex | 883,000 | 2,800 |
NJ | 9.5 million | 1,280 |
US | 338 million | 99 |
B. Change in population size over time
N = # of individuals
t = time
B = # births
D = # deaths
Change in # of individuals
ChangeN/changet = B - D
Ex: 10 births and 40 deaths
ChangeN/changet = 10 - 40 = -30
Ex: 20 birds and 5 deaths
ChangeN/changet = 20 - 5 = 15
If N started at 15, population increased 100%
If N started at 150, population increased 10%
Per capita change
a. How much does the average individual contribute to the population
- b = per capita birth rate = B/N
- m = per capita death rate = D/N
Ex: A population of 100 has 15 births and 10 deaths per year
What are the birth and death rates?
N = 100
B = 15
D = 10
b = B/N = 15/100 = 0.15 births/year/individual
m = D/N = 10/100 = 0.1 deaths/year/individual
b. Use rates (b and m) to calculate expected change in population size
changeN/changet = B - D
= bN - mN
= N(b - m)
Ex: a population of 200 has a birth rate of 2.0 and a death rate of 0.15
N = 200 b = 0.2 m = 0.15
What is the expected change in population size per unit time?
200 (0.2 - 0.15) = 10 individuals added to population per unit time
b = bN = 0.2 x 200 = 40 births
D = mN = 0.15 x 200 = 30 deaths
Per capita growth rate (r)
r = b - m
changeN/changet = N(b - m)
= rN
If b < m then r < 0 -> population declining
If b > m then r > 0 -> population increasing
If b = m then r = 0 -> Zero population growth (ZPG)
(Births and deaths cancel out, occurring at same rate)
Instantaneous growth rate (r inst)
r at one specific point in time rather than a larger interval
dN/dt = rinstN
II. Population growth models
Exponential growth model
Describes population in which conditions are ideal
Low population density
Every individual has access to abundant resources and free to reproduce at physiological capacity
Population growing at (r max)
Intrinsic rate of increase
Max rate at which population could increase under ideal conditions
Microorganisms have highest r max
Ex: Bacteria reproducing by binary fission every 20 min
1 cell -> >1 billion in 10 hours
Large organisms tend to have low r max
J-shaped curve
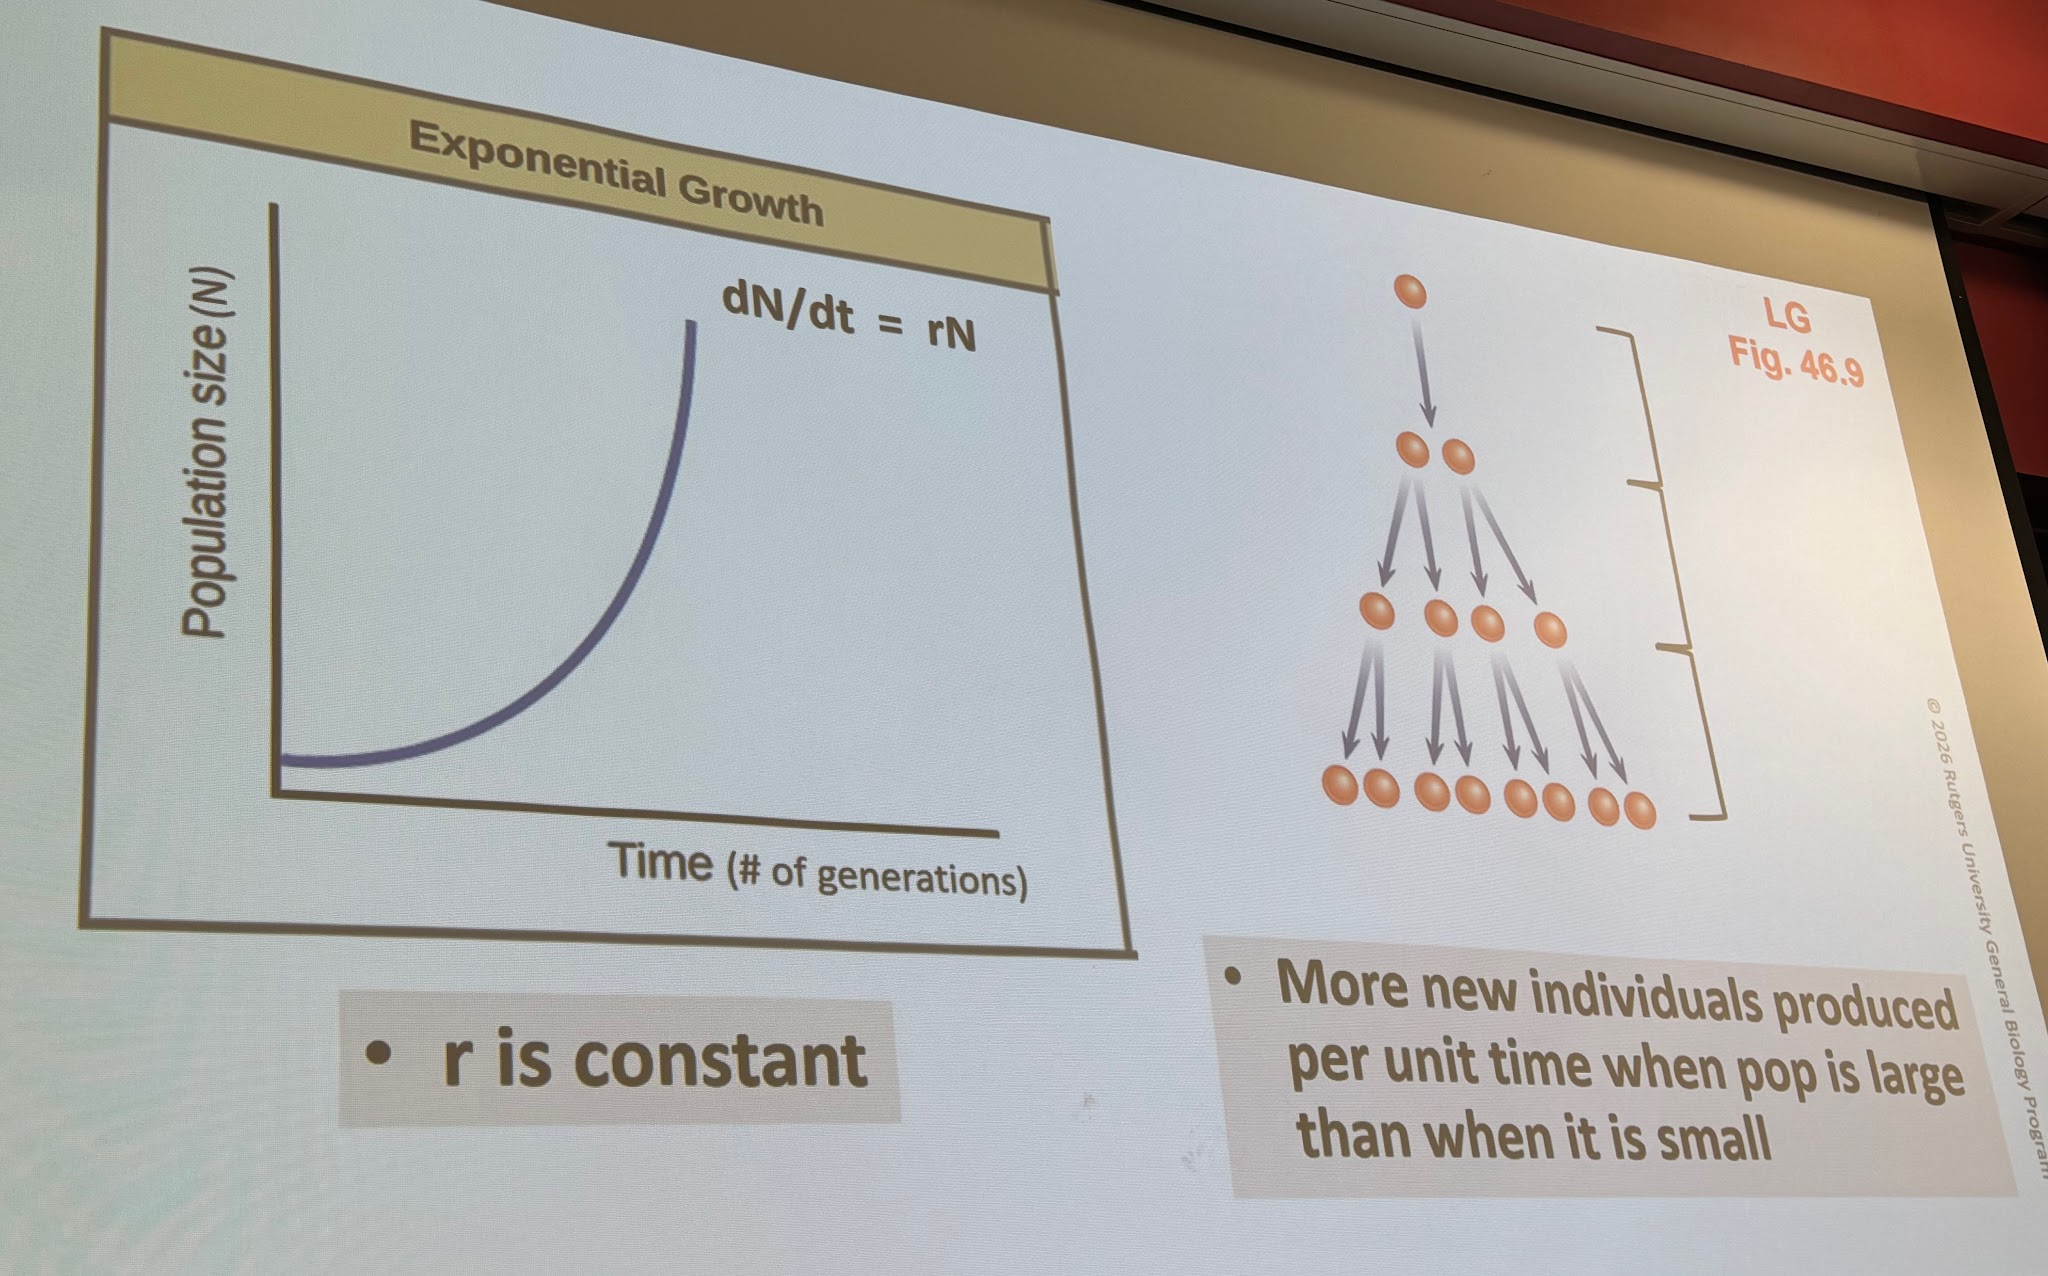
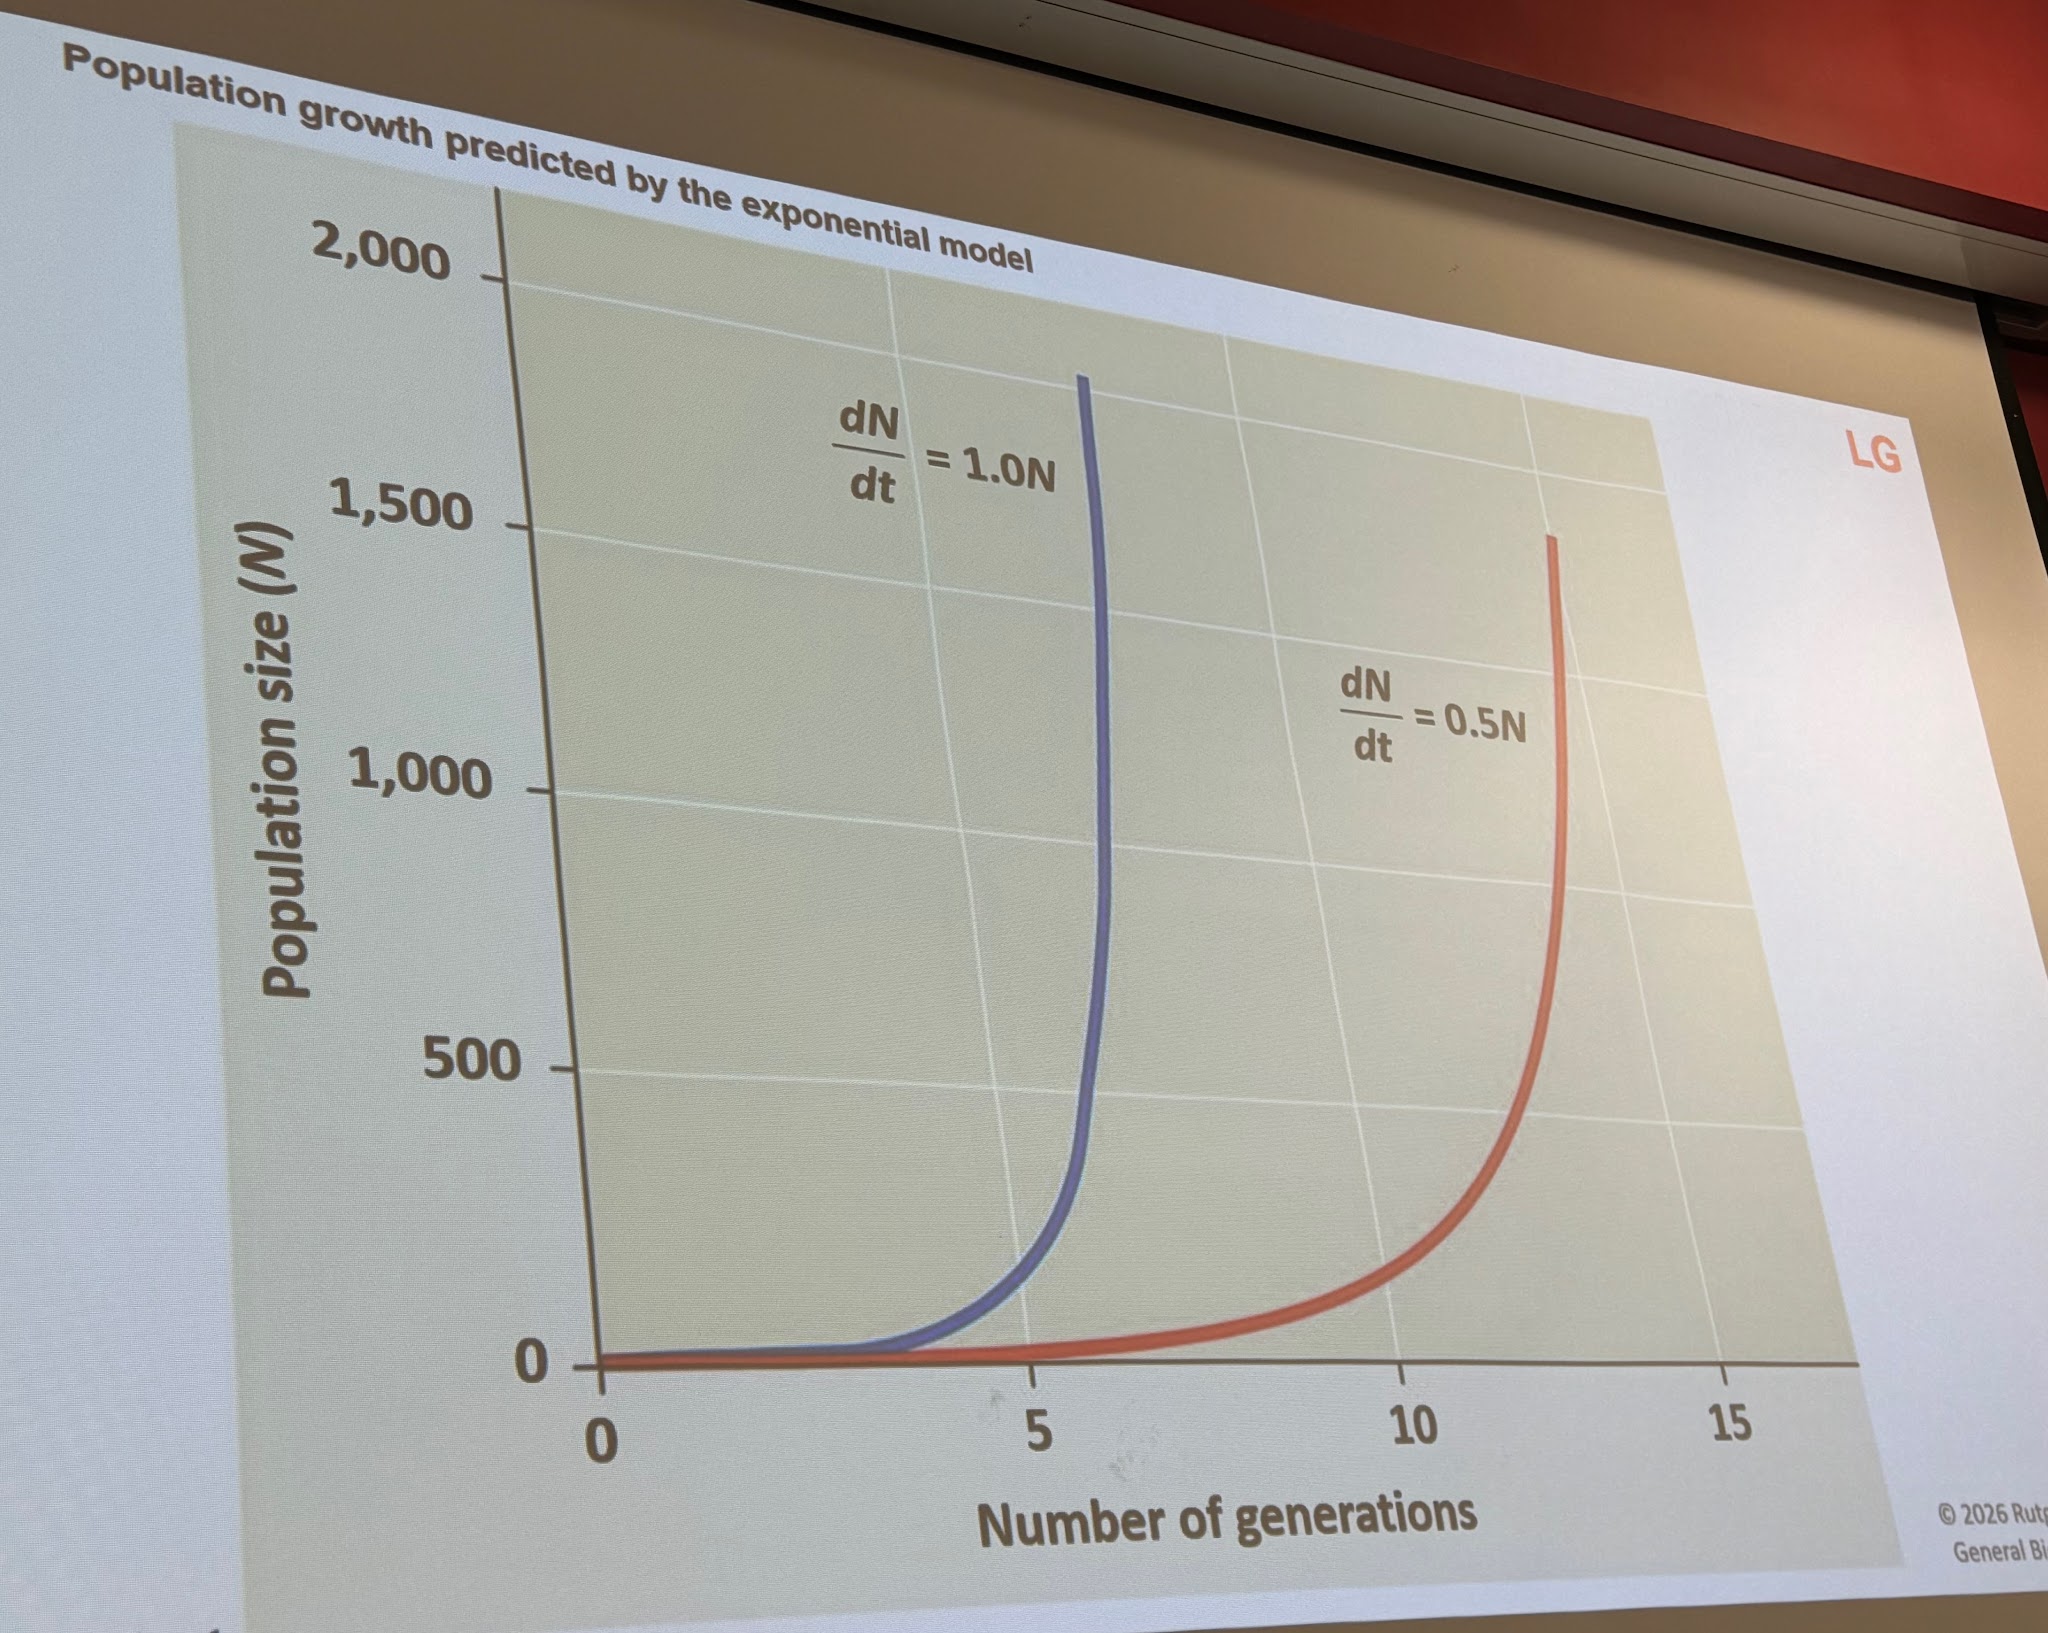
3. Exponential growth model isn't as realistic in nature
Environmental resistance
As population density increases
Less resources/individual
Build up toxic wastes
Some populations may undergo exponential growth for short periods of time
But over long periods of time, growth rate may slow and go down to nearly zero
B. Logistic growth model
Accounts for environmental resistance
As population reaches limit of environment's ability to support it, population growth rate approached zero
Carrying capacity (K)
Max population that can be sustained by a particular environment for an indefinite period
Assumes no changes in environment
S-shaped curve (sigmoid)
First part is exponential growth
Levels out as K approaches
Equation
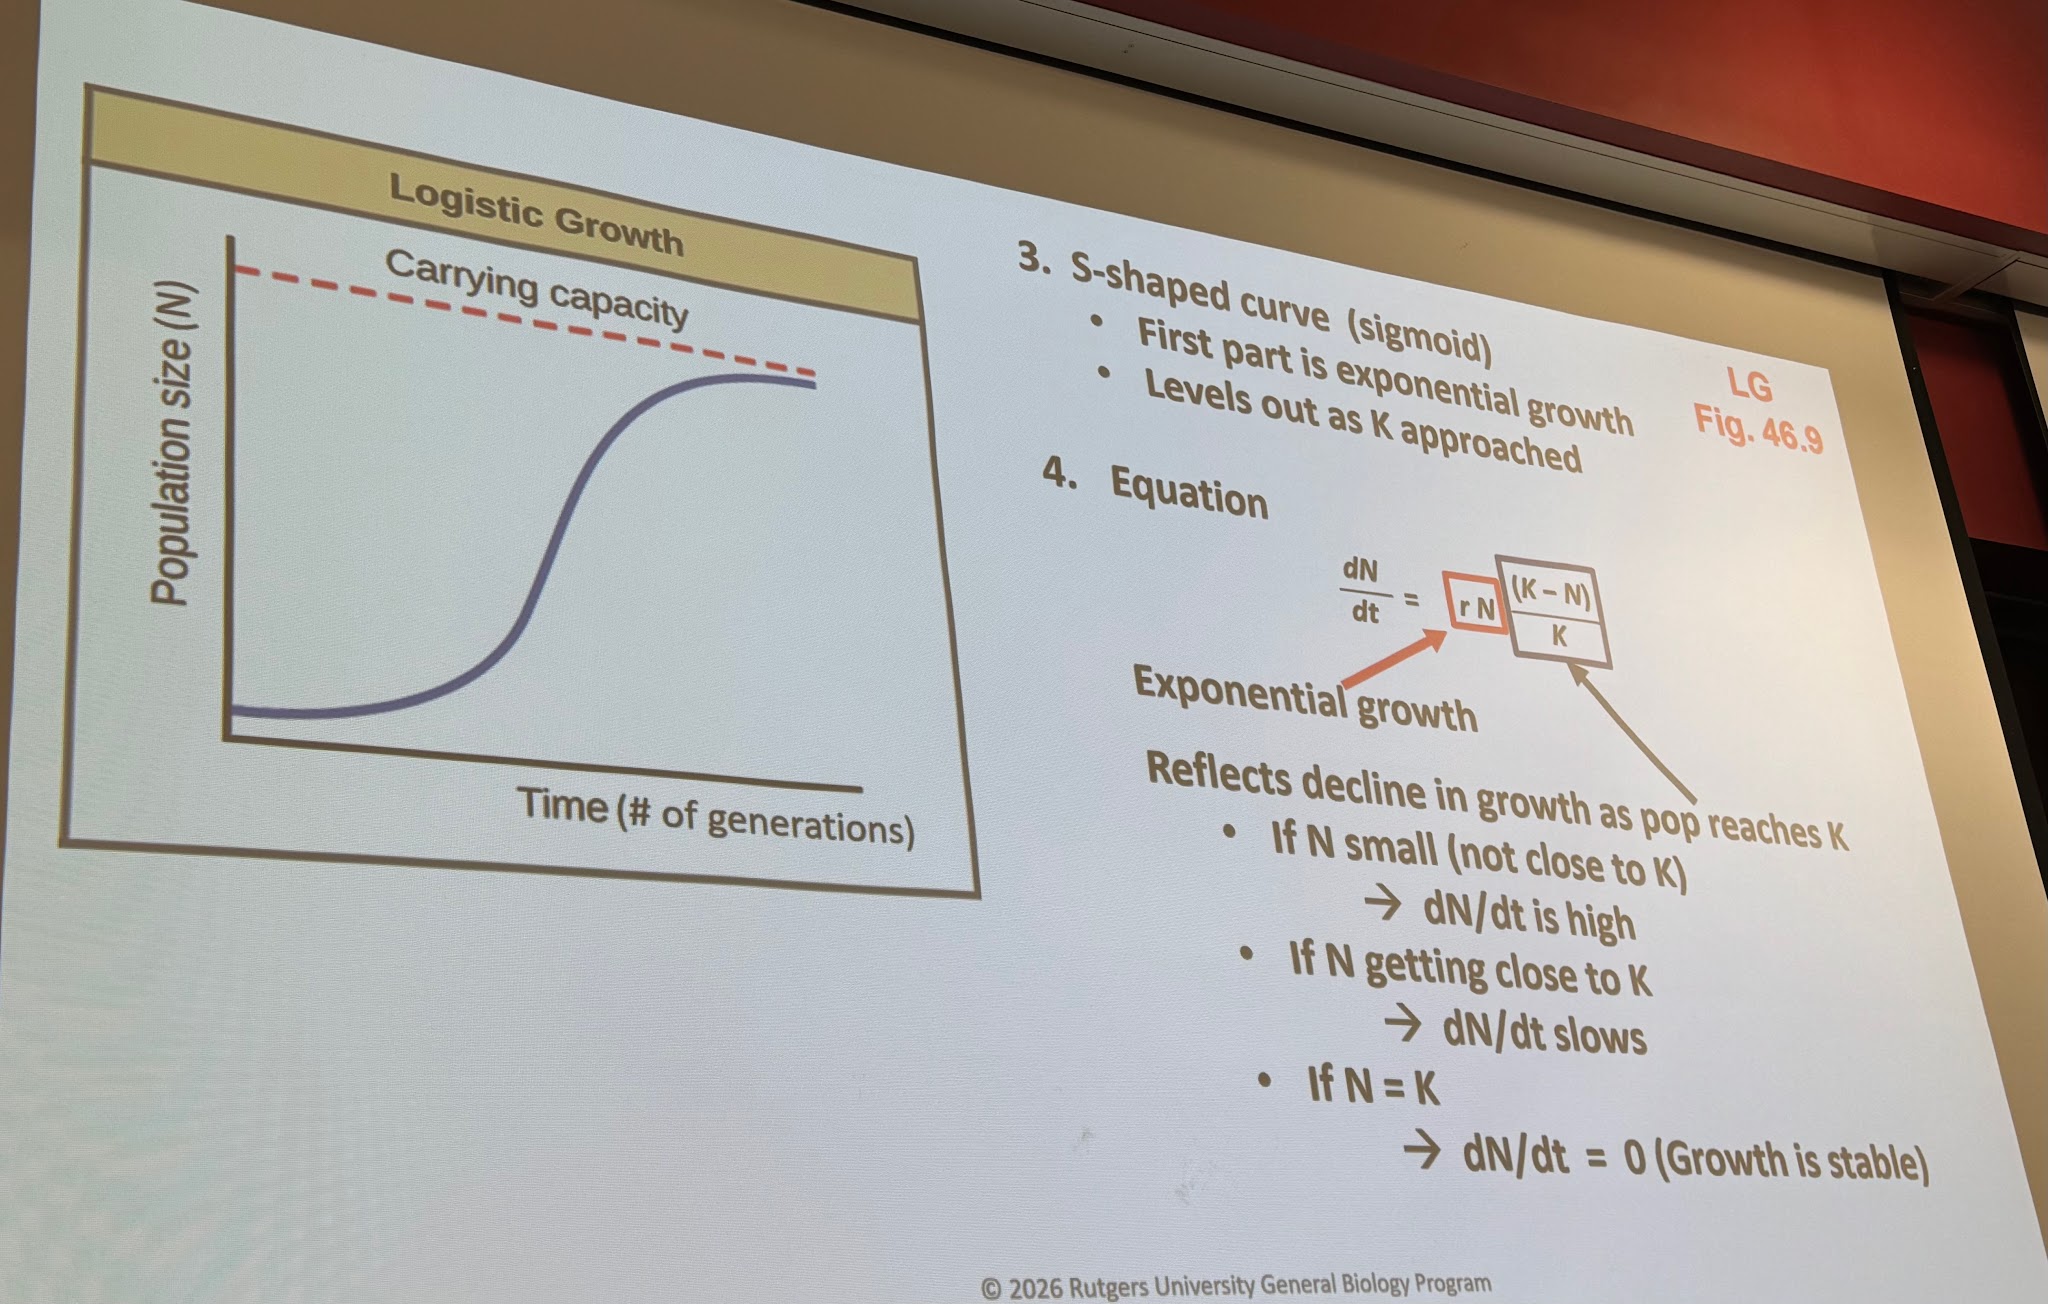
More realistic than experimental model
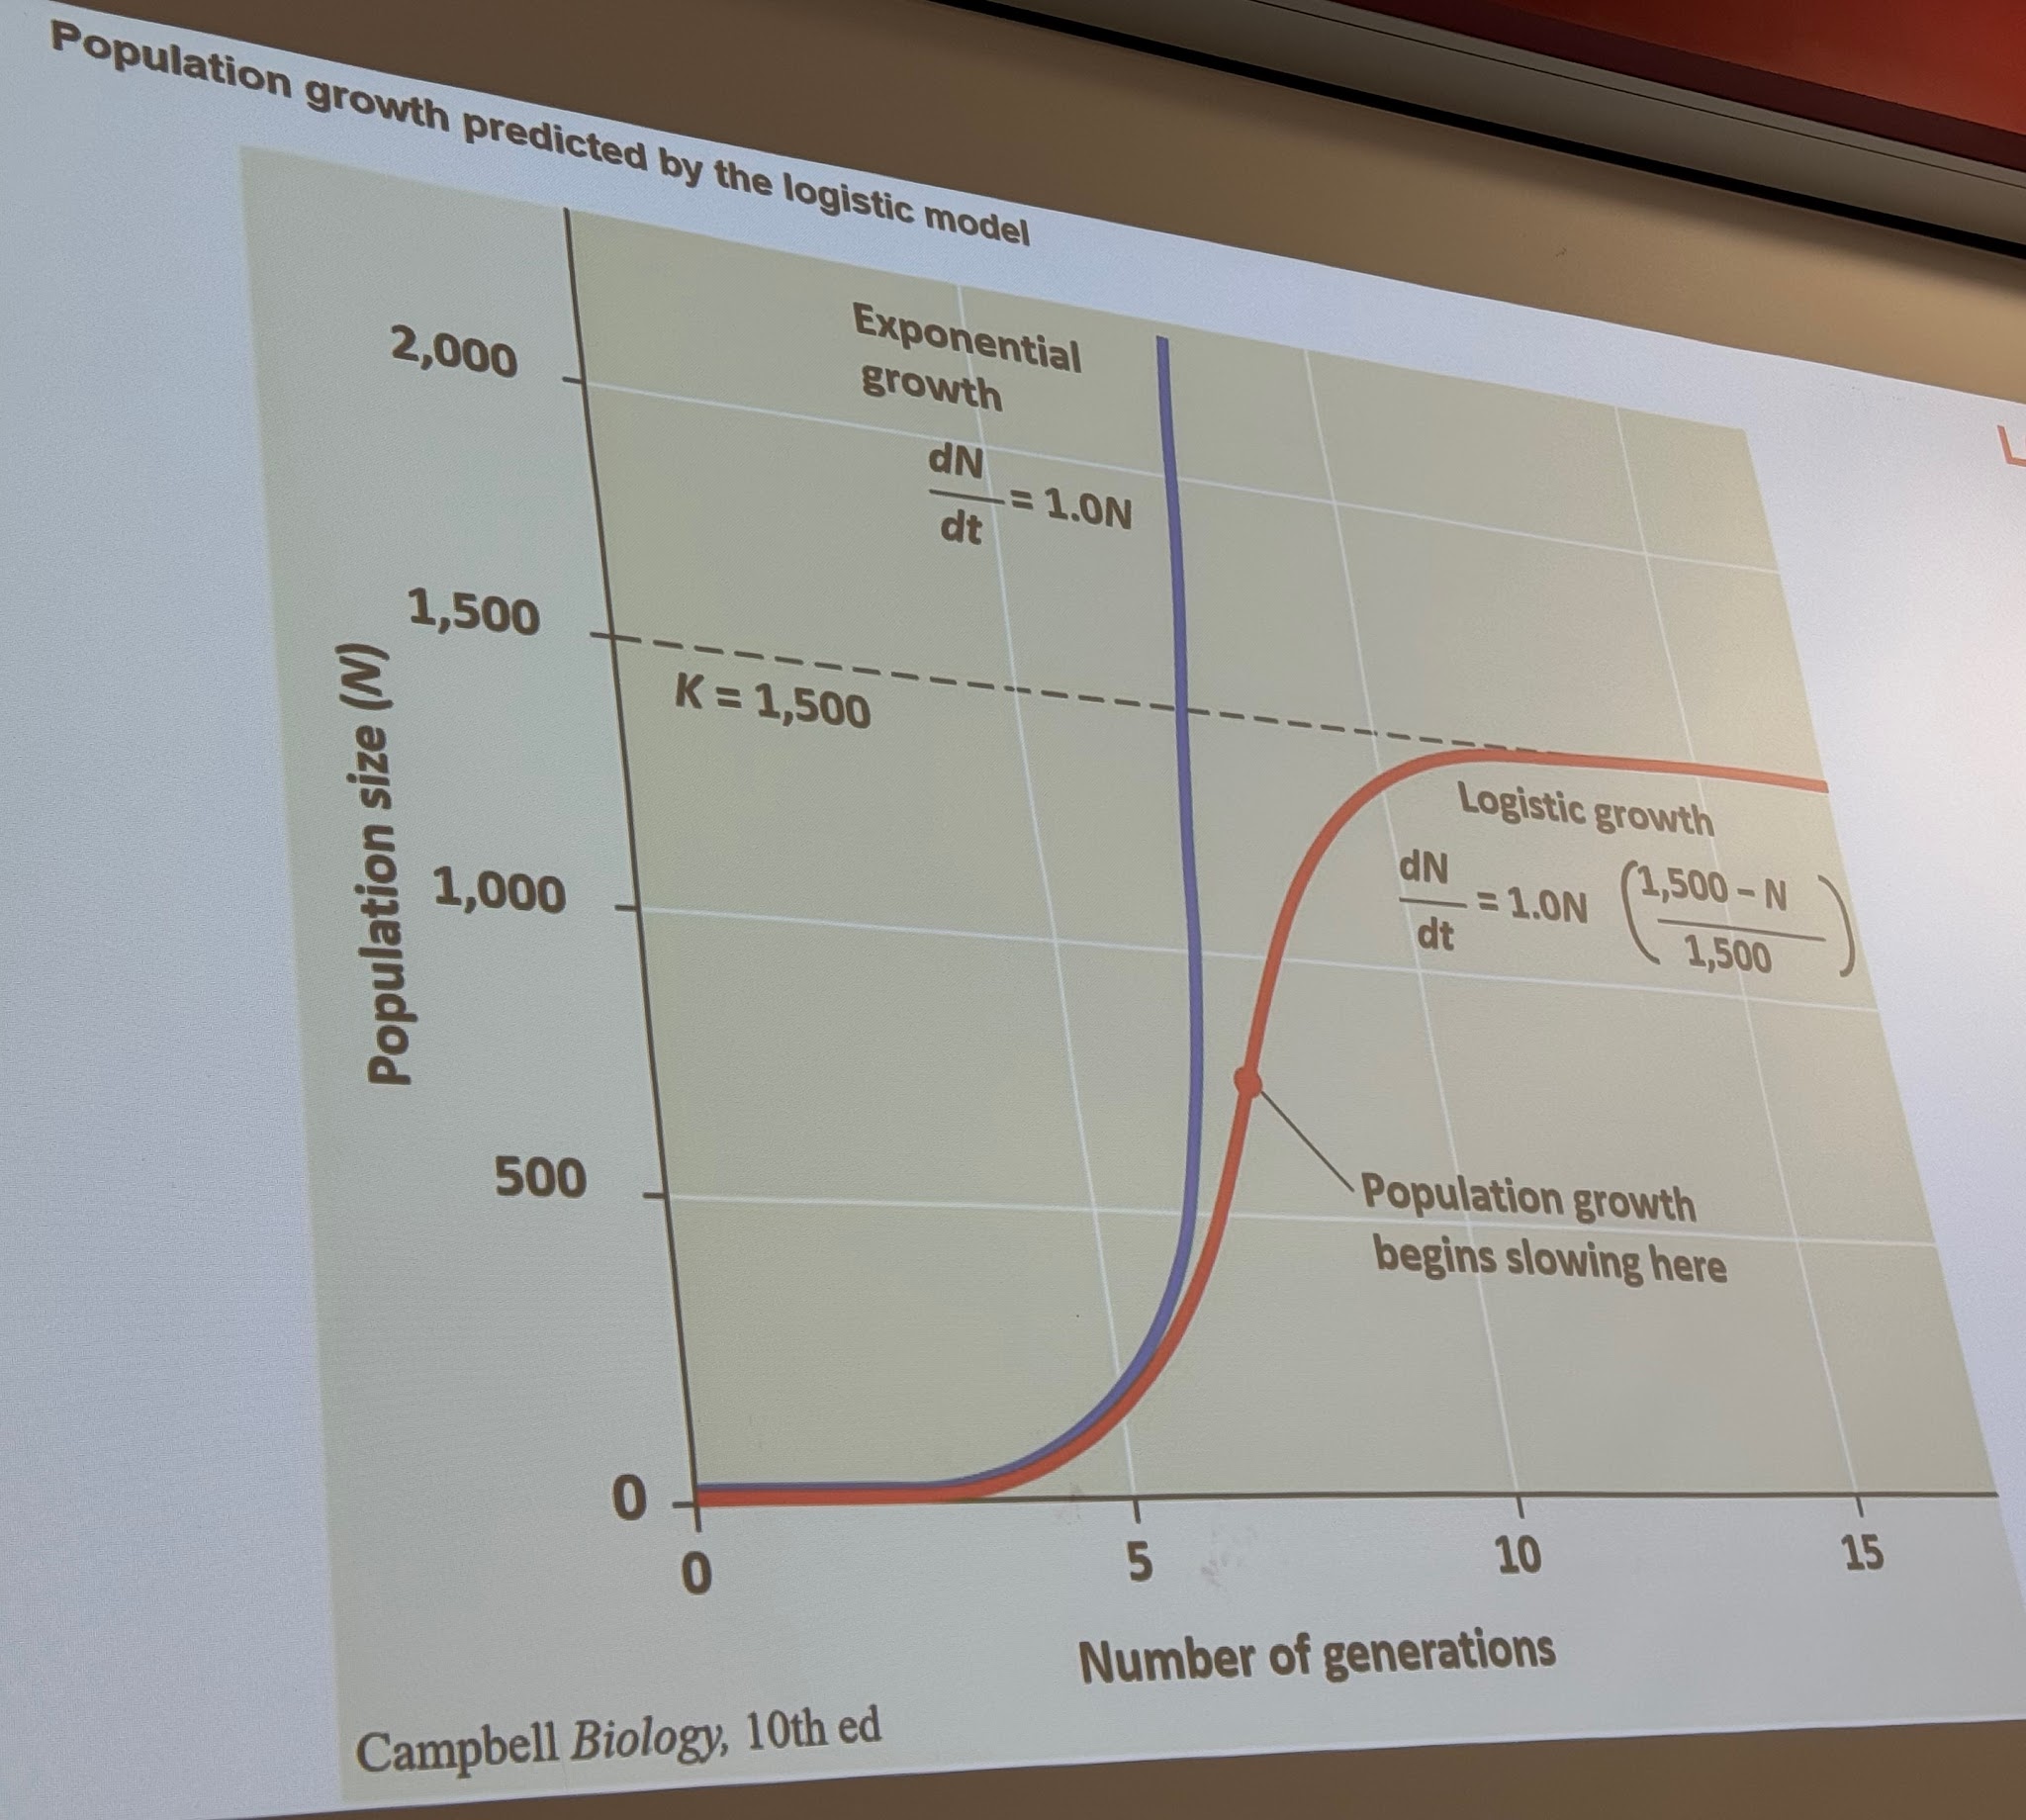
S-curves in nature usually not perfectly logistic
Populations tend to fluctuate around K
Environment is never completely constant -> K may change
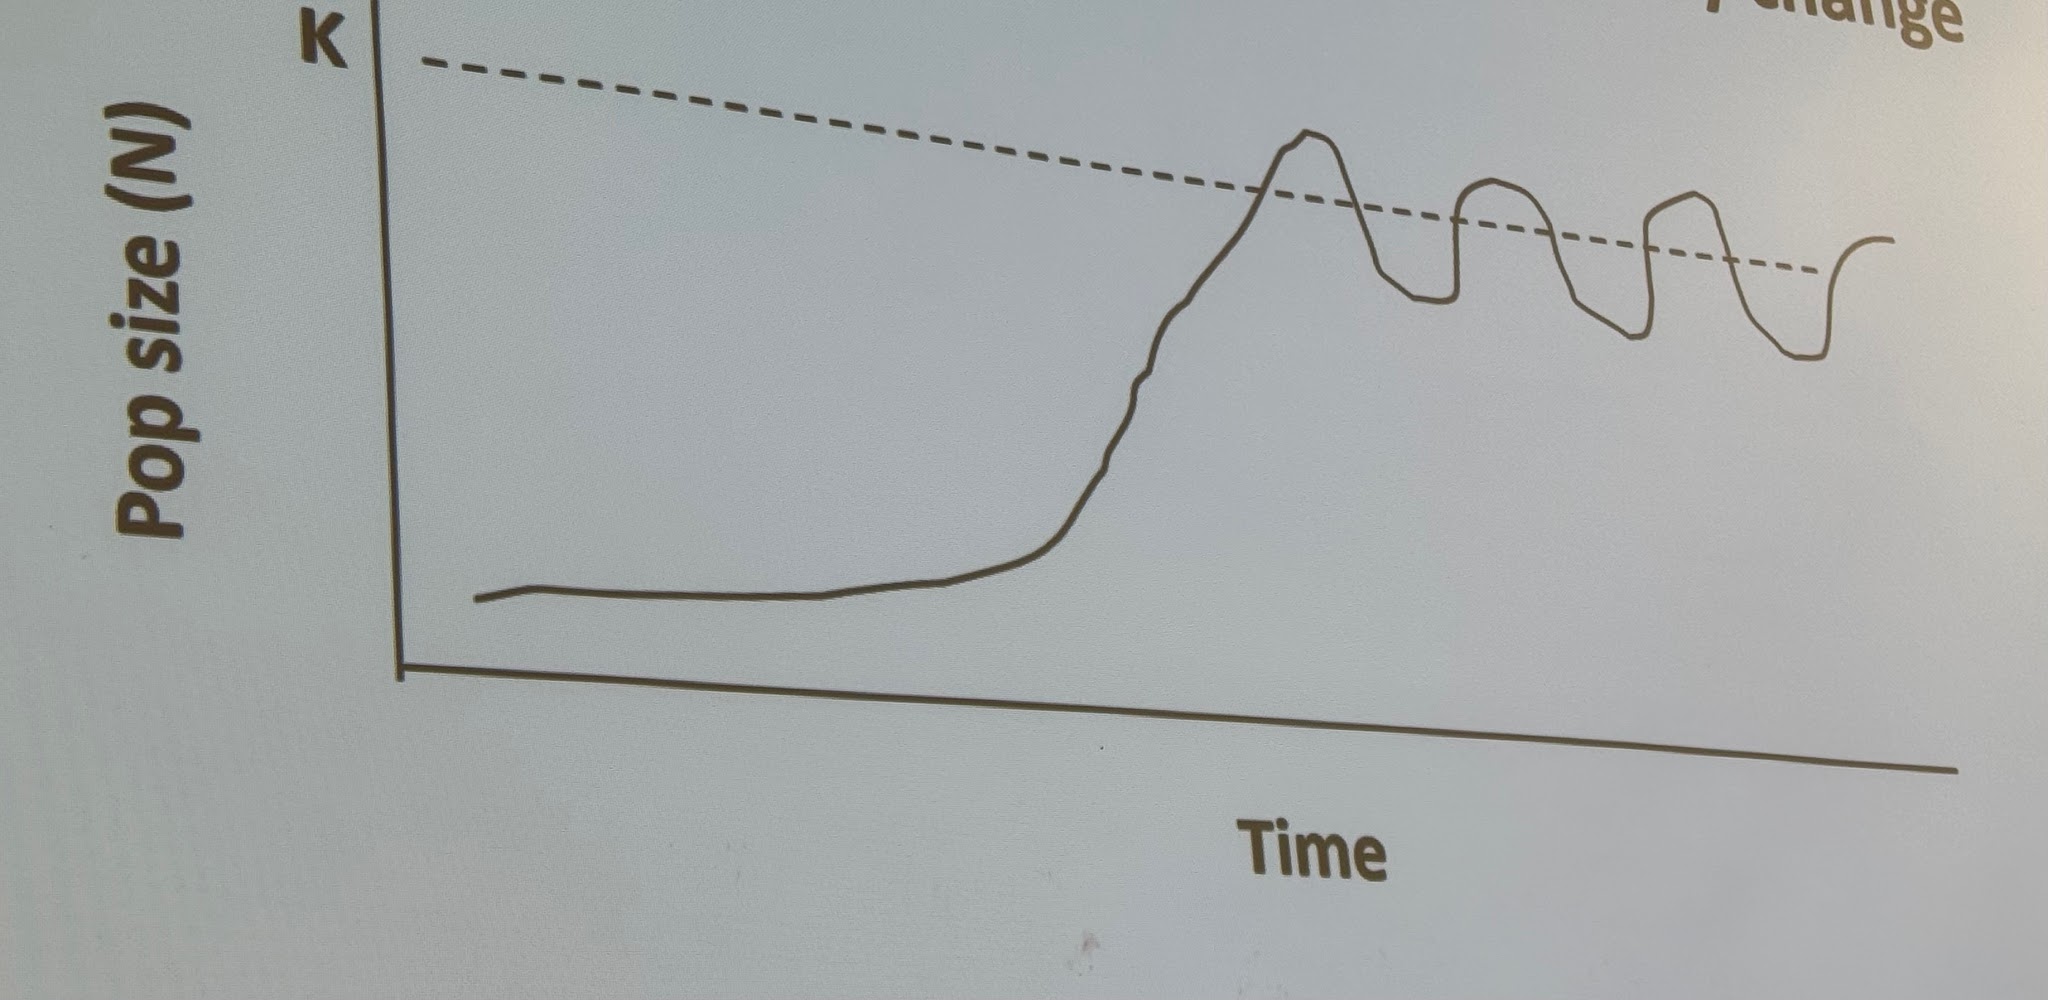
III. Life history
Patterns of survival, growth, and reproduction
Trade-offs
Reproductive strategies
3 main variables
Age at 1st reproduction
How often organism reproduces
# offspring per reproductive episode
Semelparous
Short-lived (reproduce early)
Reproduce once
Very many offspring
Ex: Many insects, salmon
Iteroparous
Long lived (reproduce later)
Reproduce many times
Fewer offspring
Ex: Most verts
B. Life history extremes
Connect differences in traits with growth models
r-selected species
Usually found in temporary or unpredictable environments
Tendency for:
High growth rates (r)
Small body size
Early maturity
Rapid production of many offspring
Little or no parental care
Short life span
2. K-selected species
Usually in relatively stable environment
Population size usually close to K
Tendency for:
Long life span with slow development
Large body size
High competitive ability
Defenses against predators
Relatively old at 1st reproduction
Few offspring
Parental care
Life History
Allocation of resources to survival, growth and reproduction
Natural selection
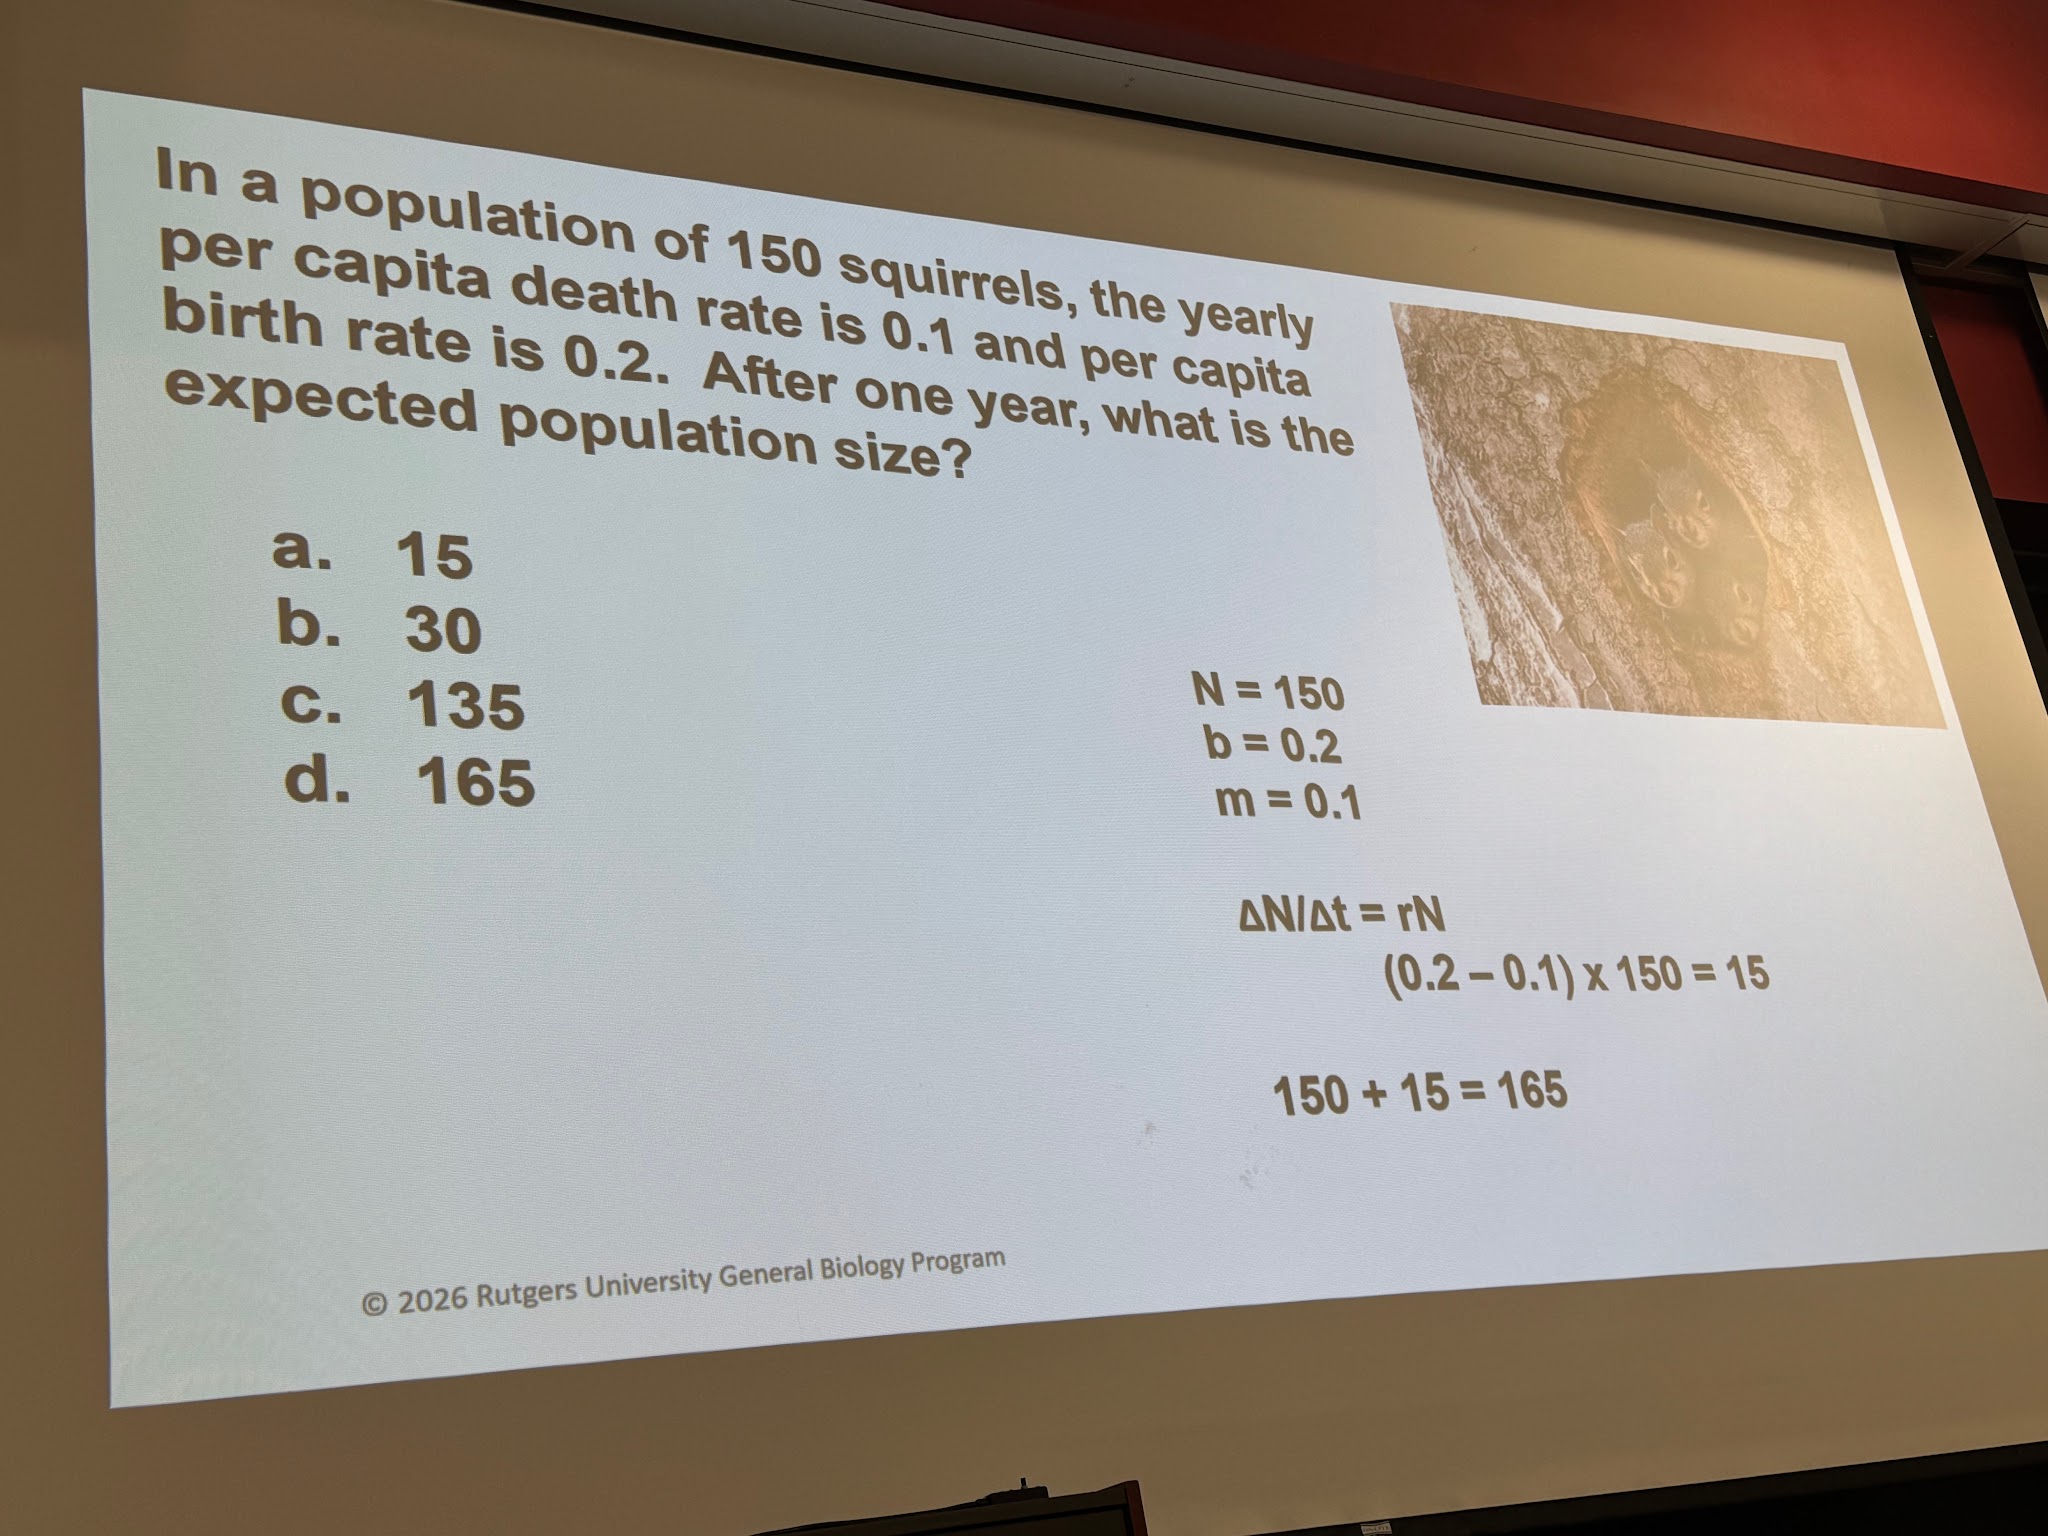
✅ 26: Community Ecology
Community
All populations of different species that live and interact in the same place at the same time
Community Ecology
Study of interactions that determine distribution and abundance of individuals and populations
Resource
Anything in environment that meets the need of a species
Community interactions
Competition -/-
Most important determinant
2 or more individuals attempt to use same resources
Types
Intraspecific
Interspecific
3. Competitive exclusion
G.F Gause
Paramecium aurelia & P. caudatum
- Closely related to protists
- Cultured under constant conditions and food
Competitive exclusion principle
Conclusion: 2 species competing for the same limiting resources cannot coexist
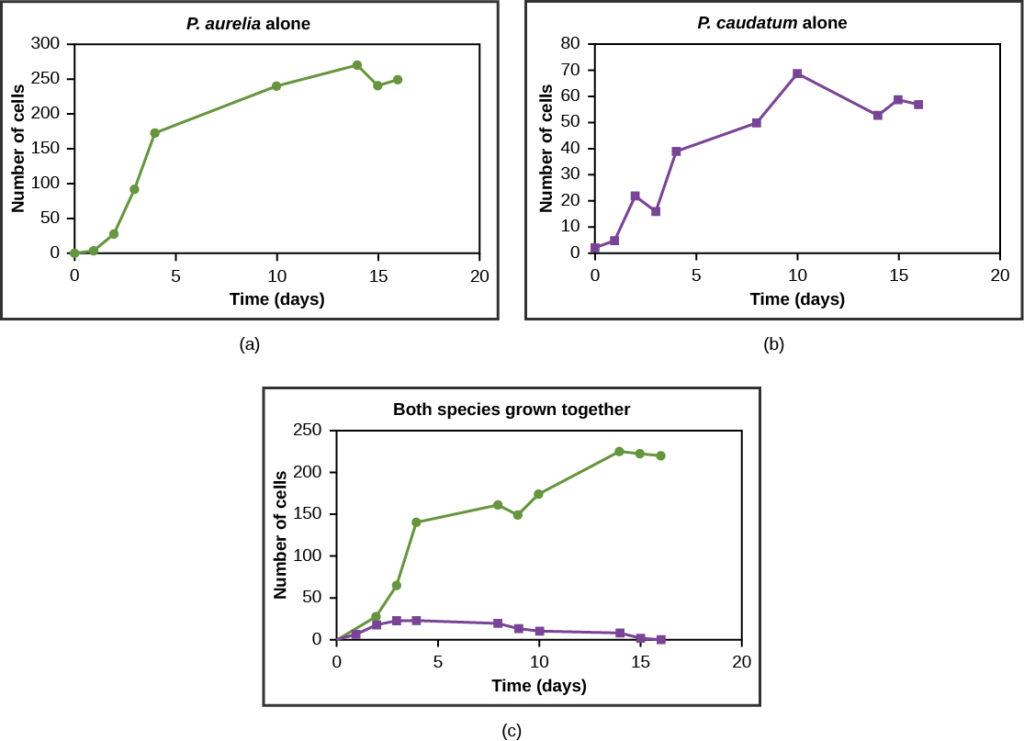
4. Ecological niche
Eugene Odum
Habitat = “address”
Niche = “profession”
Role of species within community
Use of resources
Interactions
All factors needed to survive, stay healthy, and reproduce
Fundamental niche
Ideal circumstances
Realized niche
Actual interactions and use of resources
Species with identical niches cannot coexist
-> Competitive exclusion
Species with similar niches can coexist
-> One species may exclude the other species from part of its fundamental niche into a realized niche
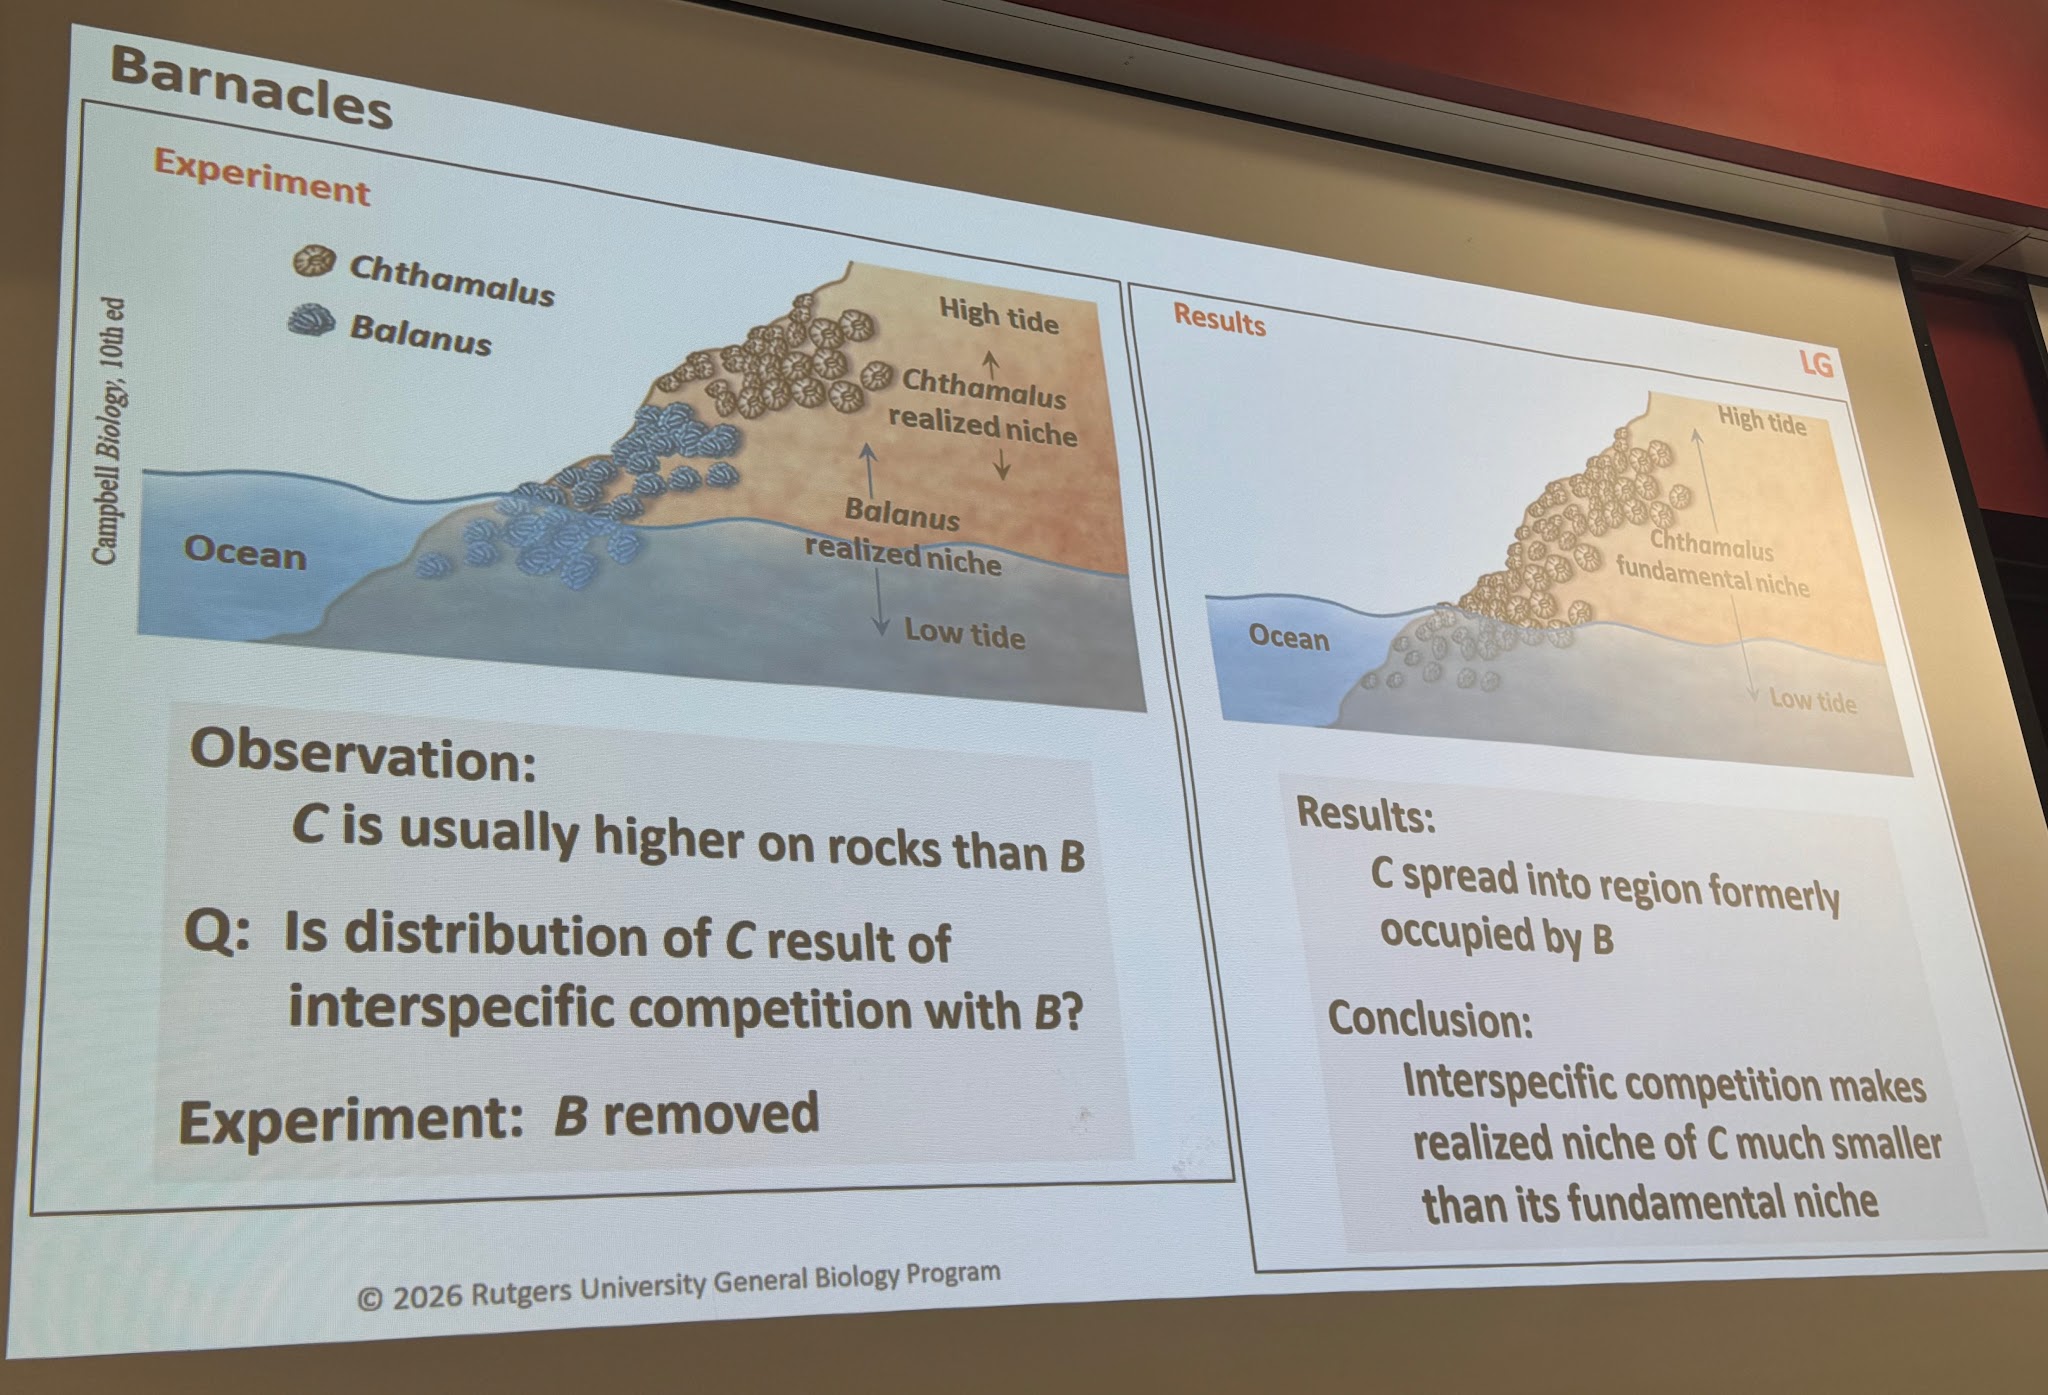
Resource partitioning
Species specialize their use of resources and thereby limit competition with others
B. Predation +/-
Predator eats prey
Results in evolutionary “arms race”

Each exerts strong selective pressure on other
-> Coevolution
Interdependent evolution of 2 interacting species
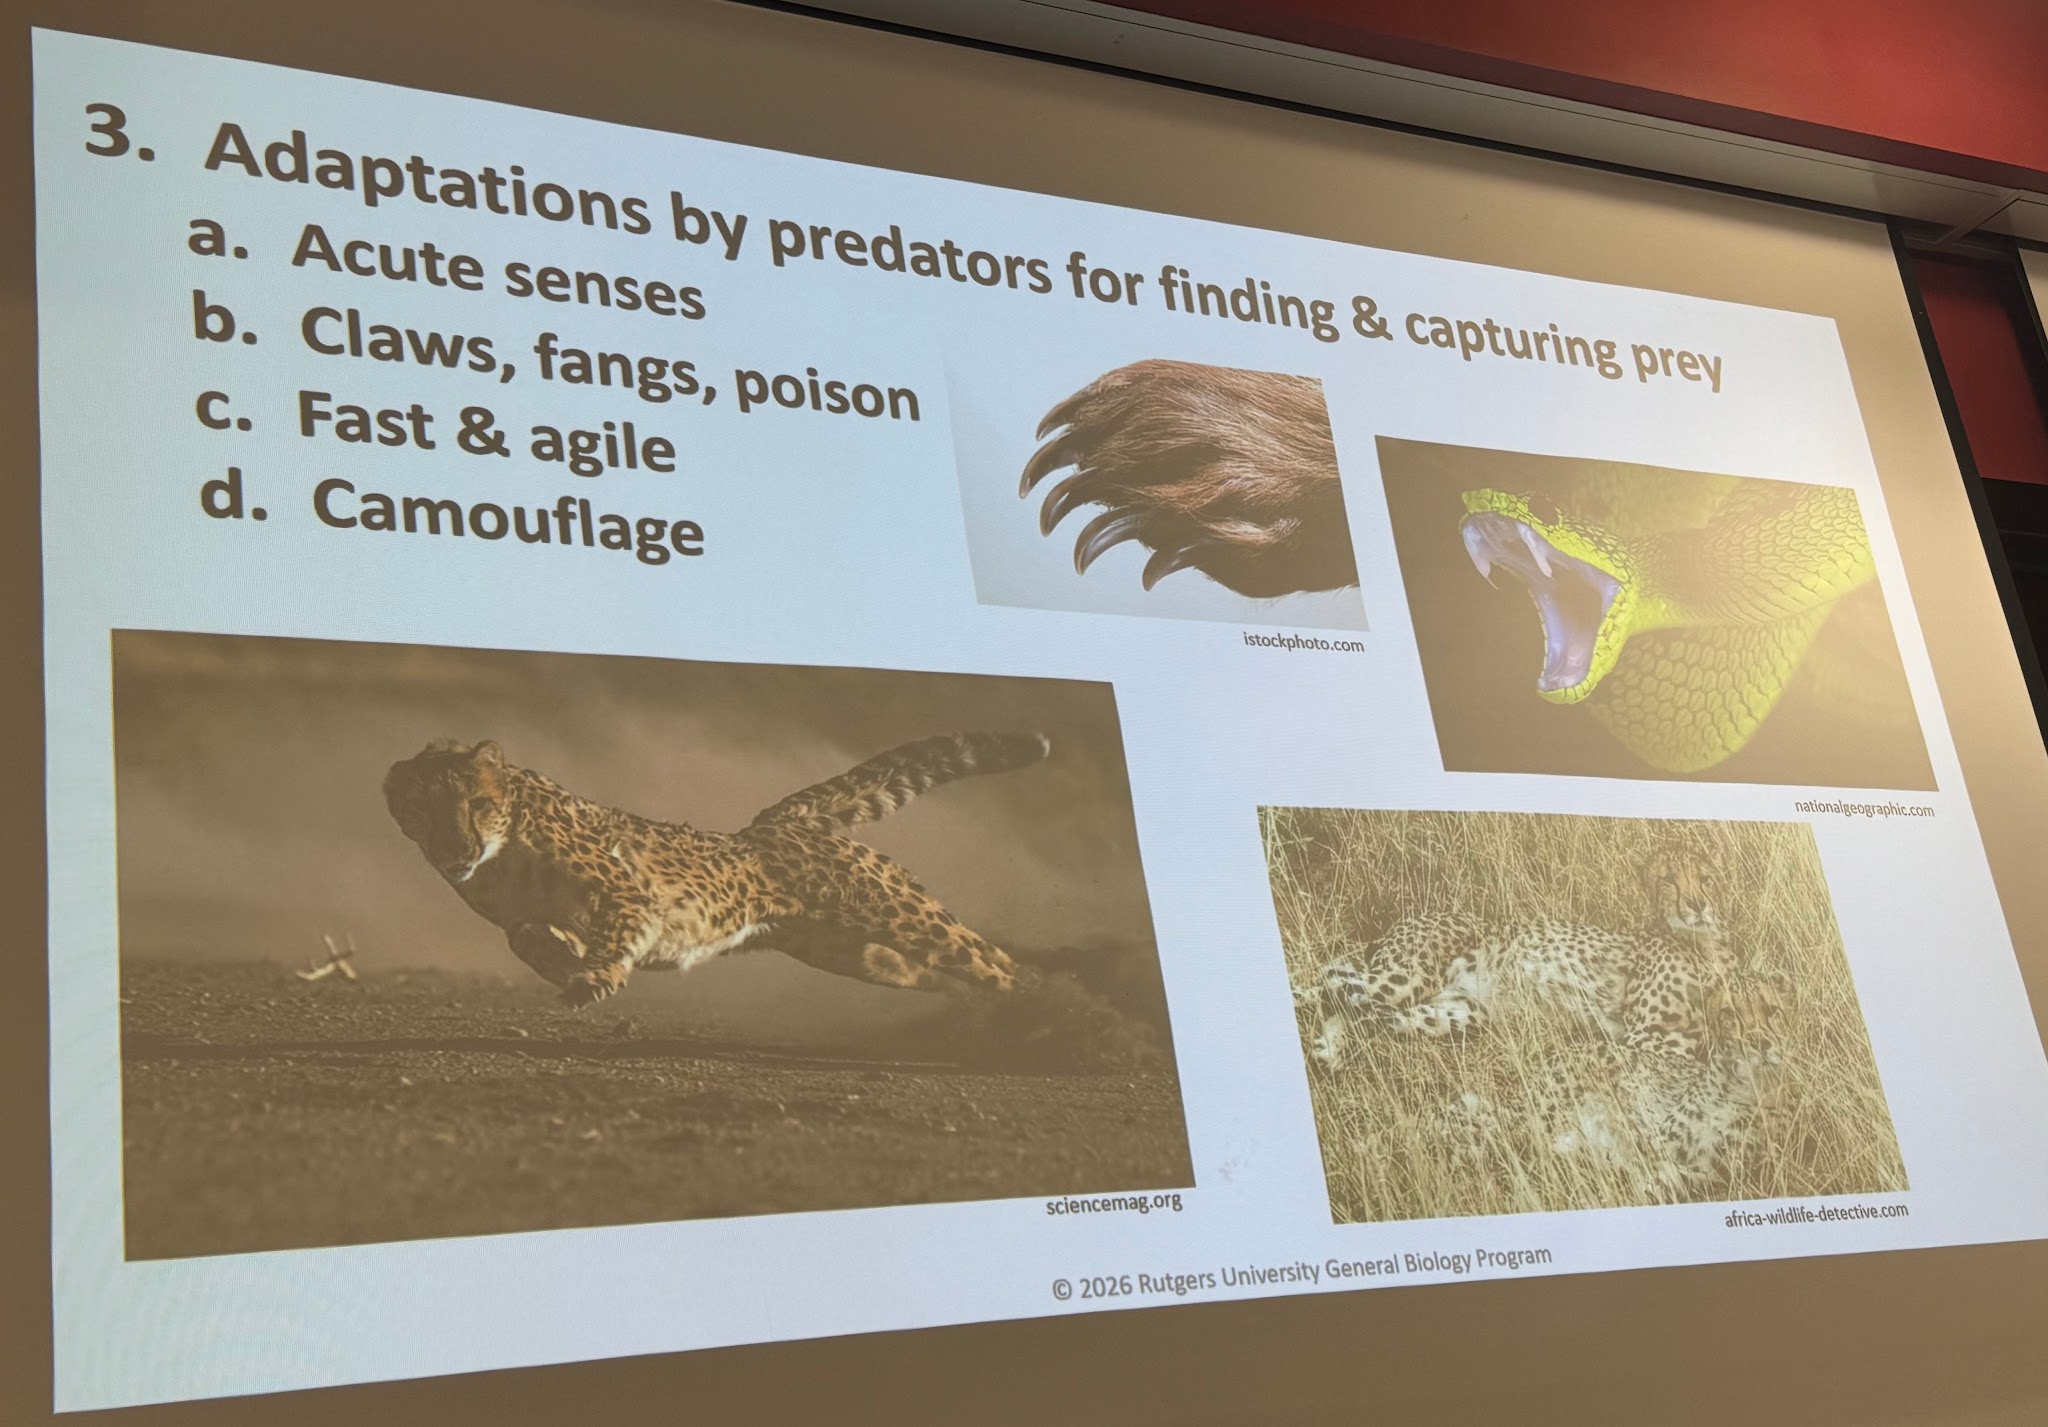
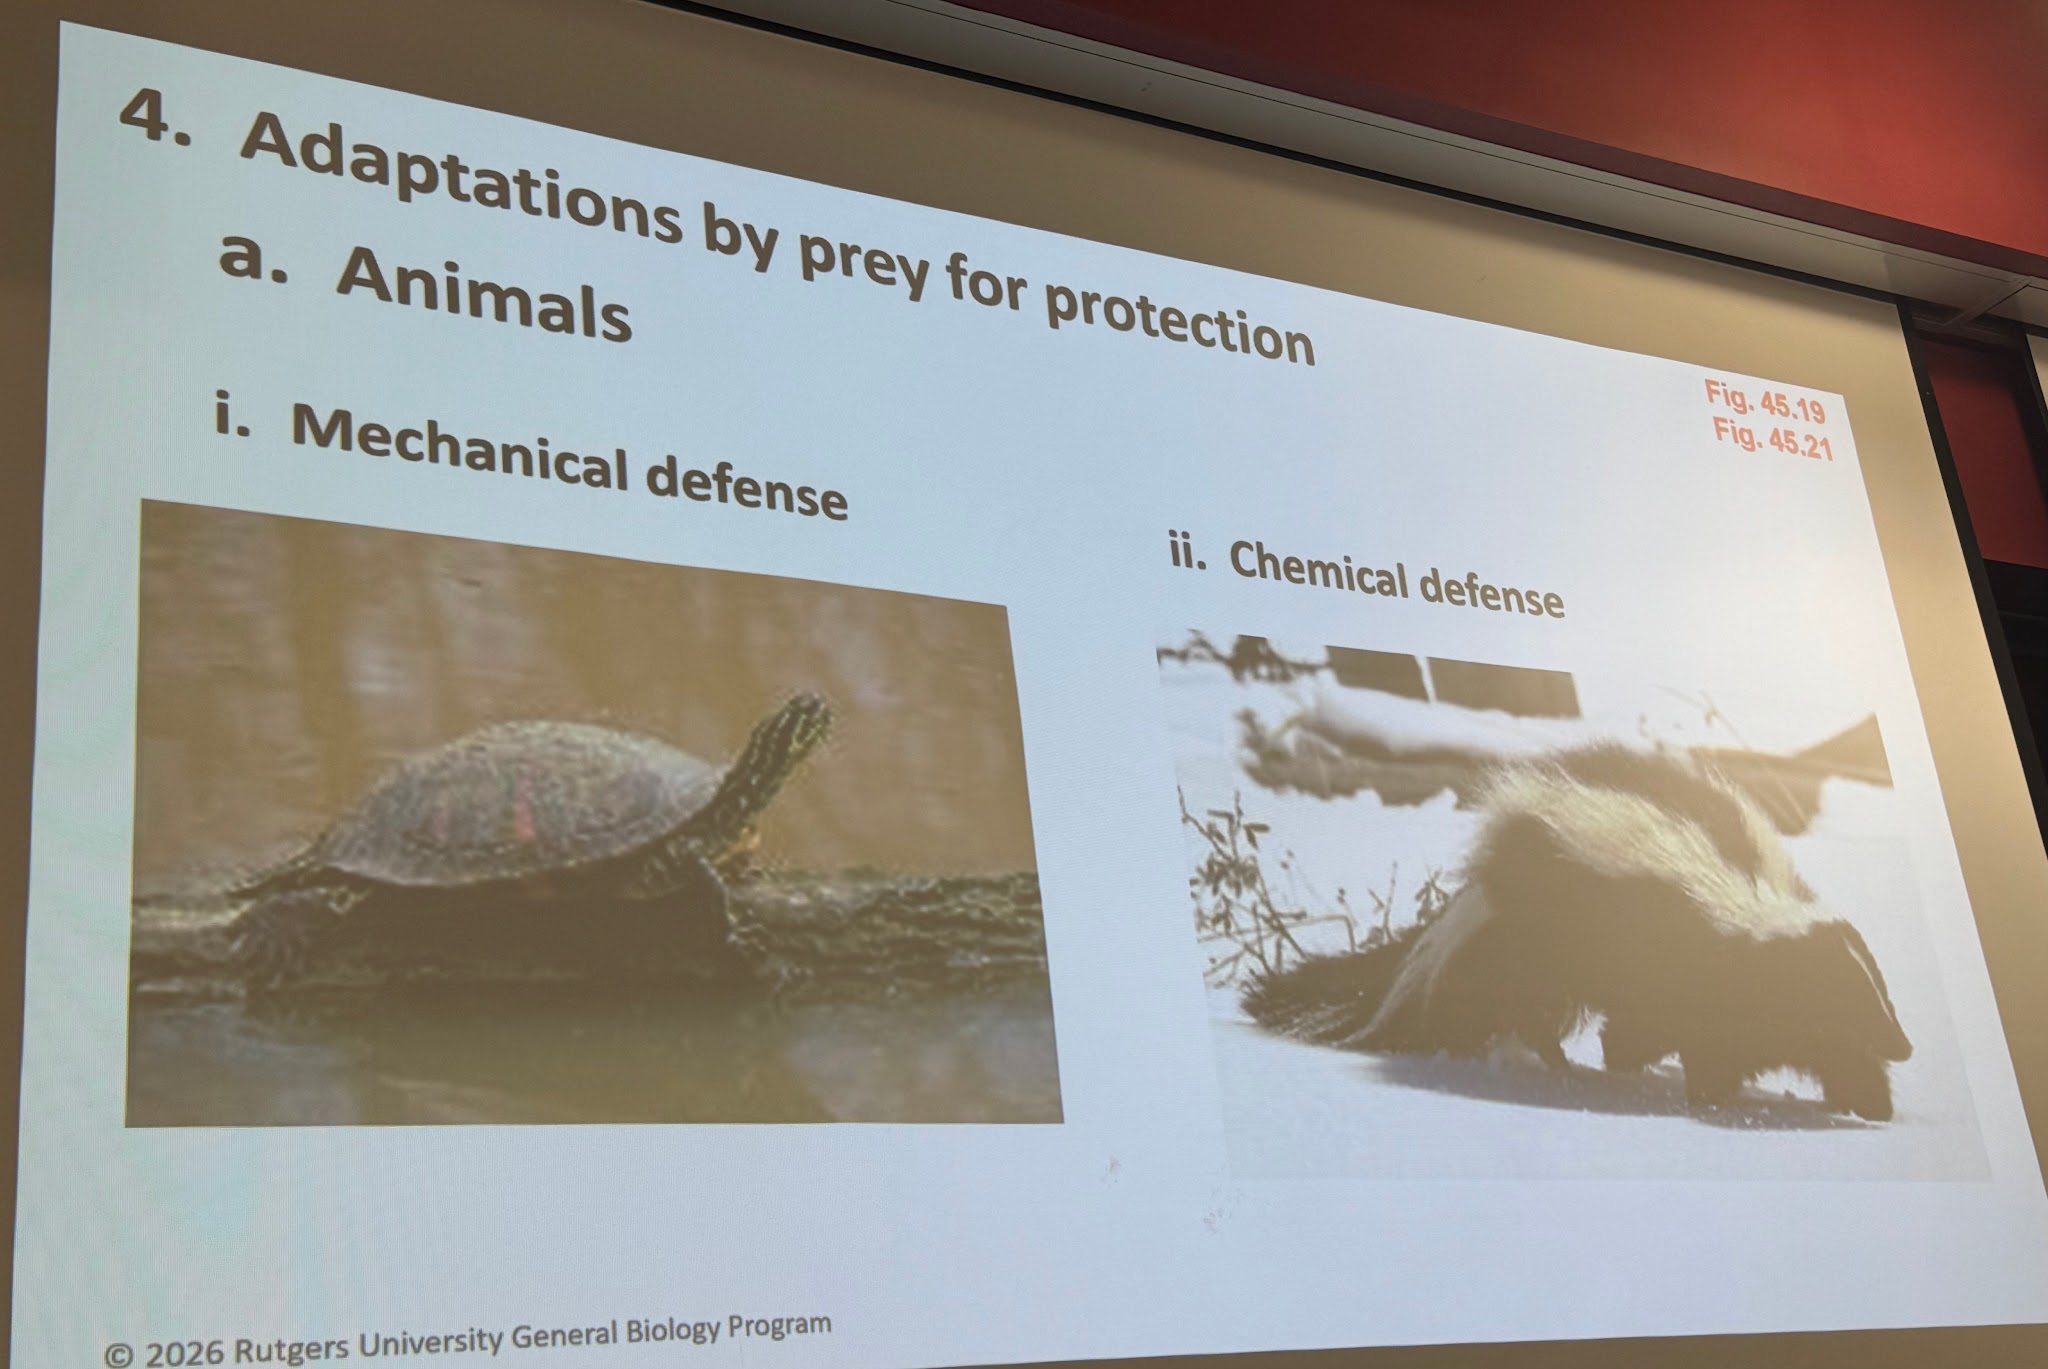
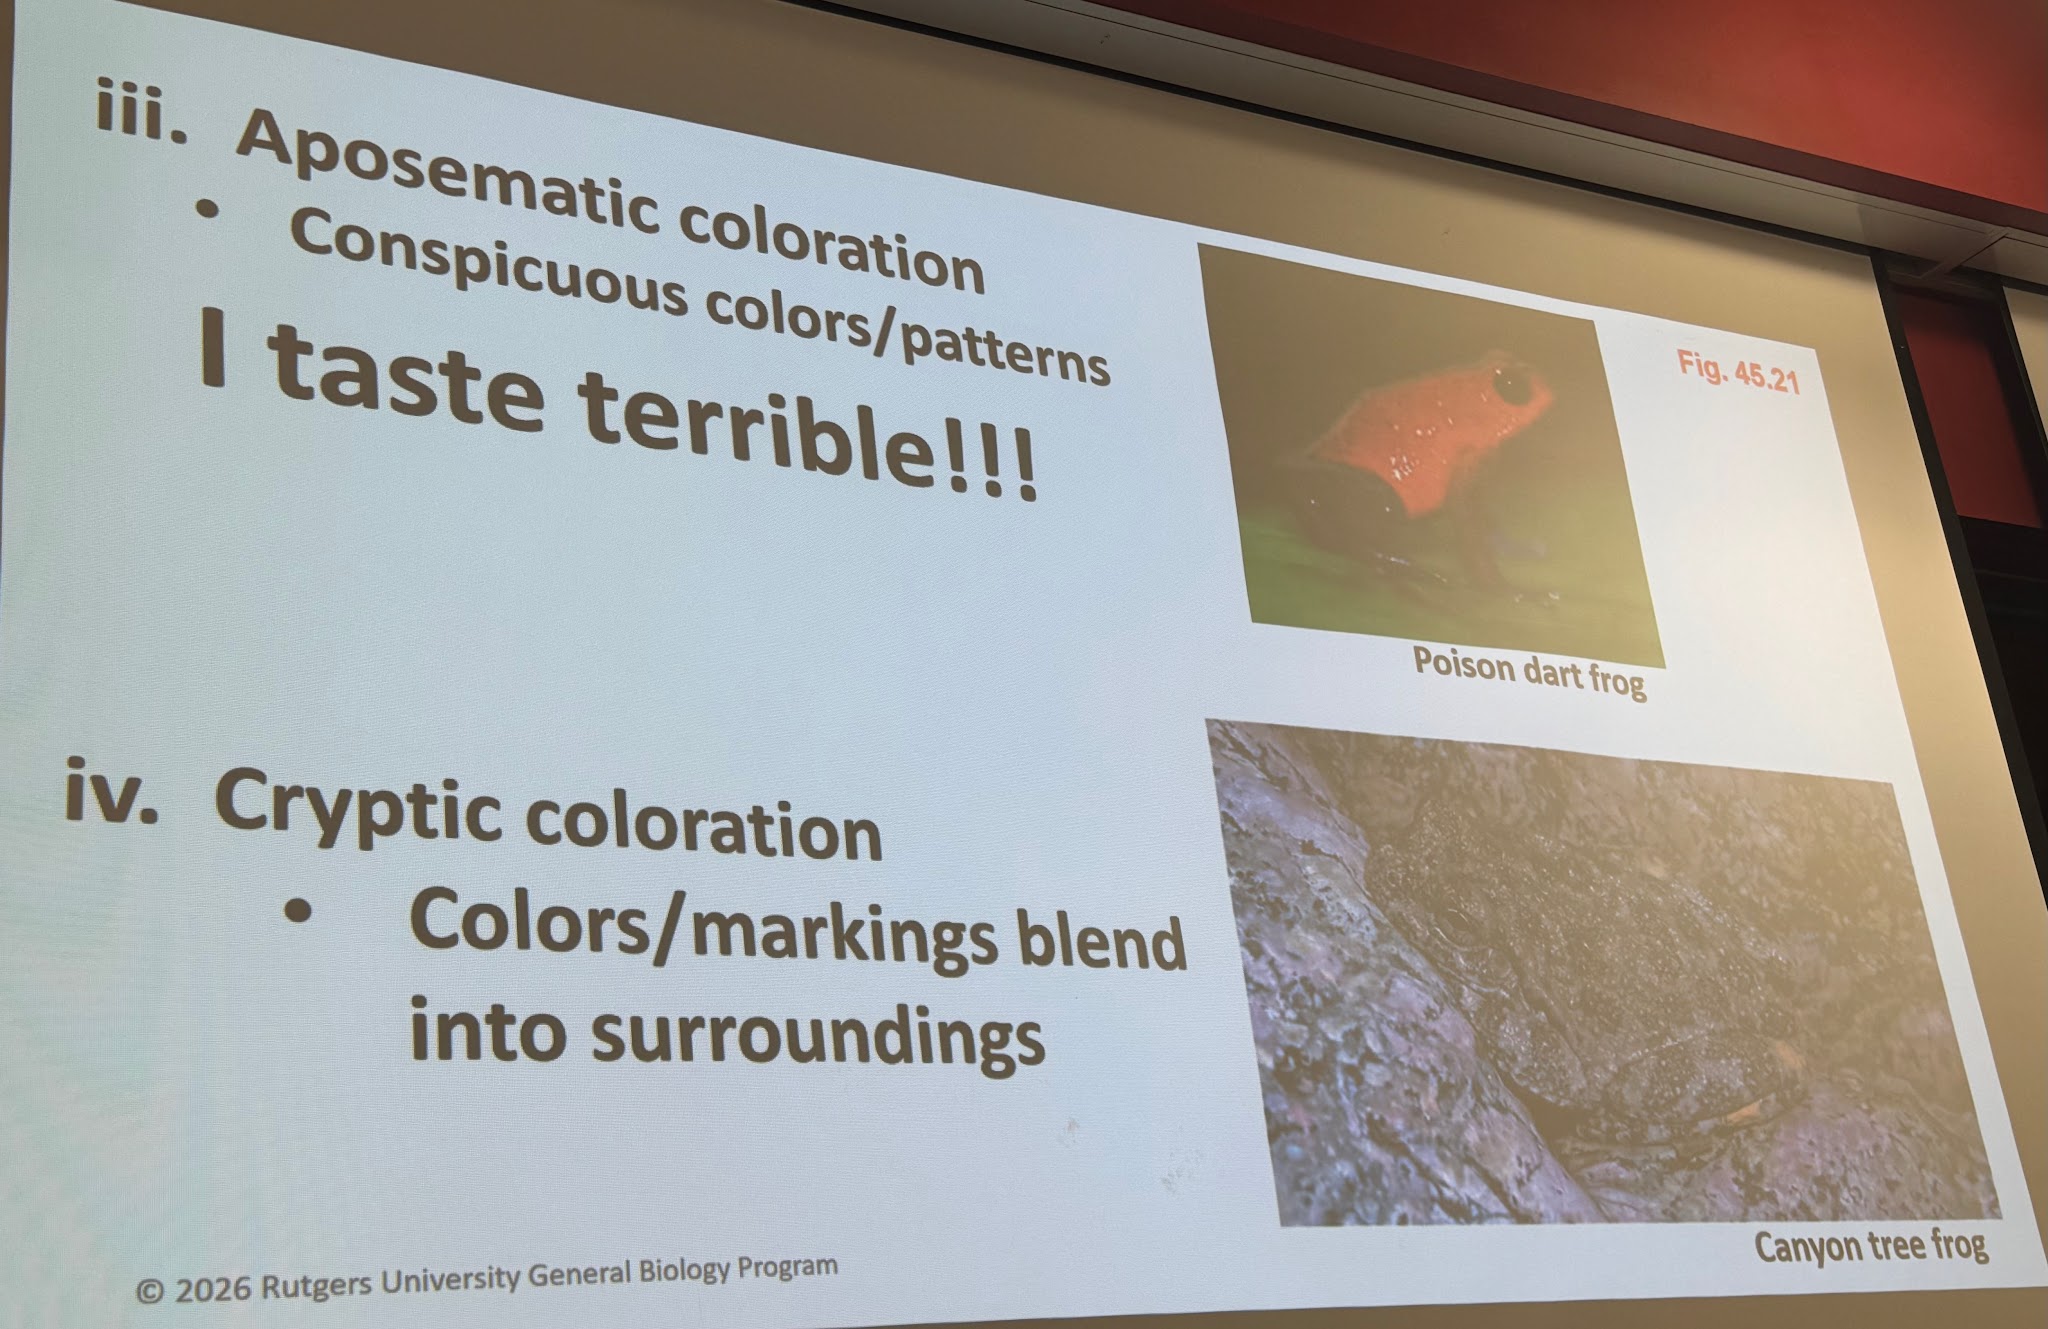
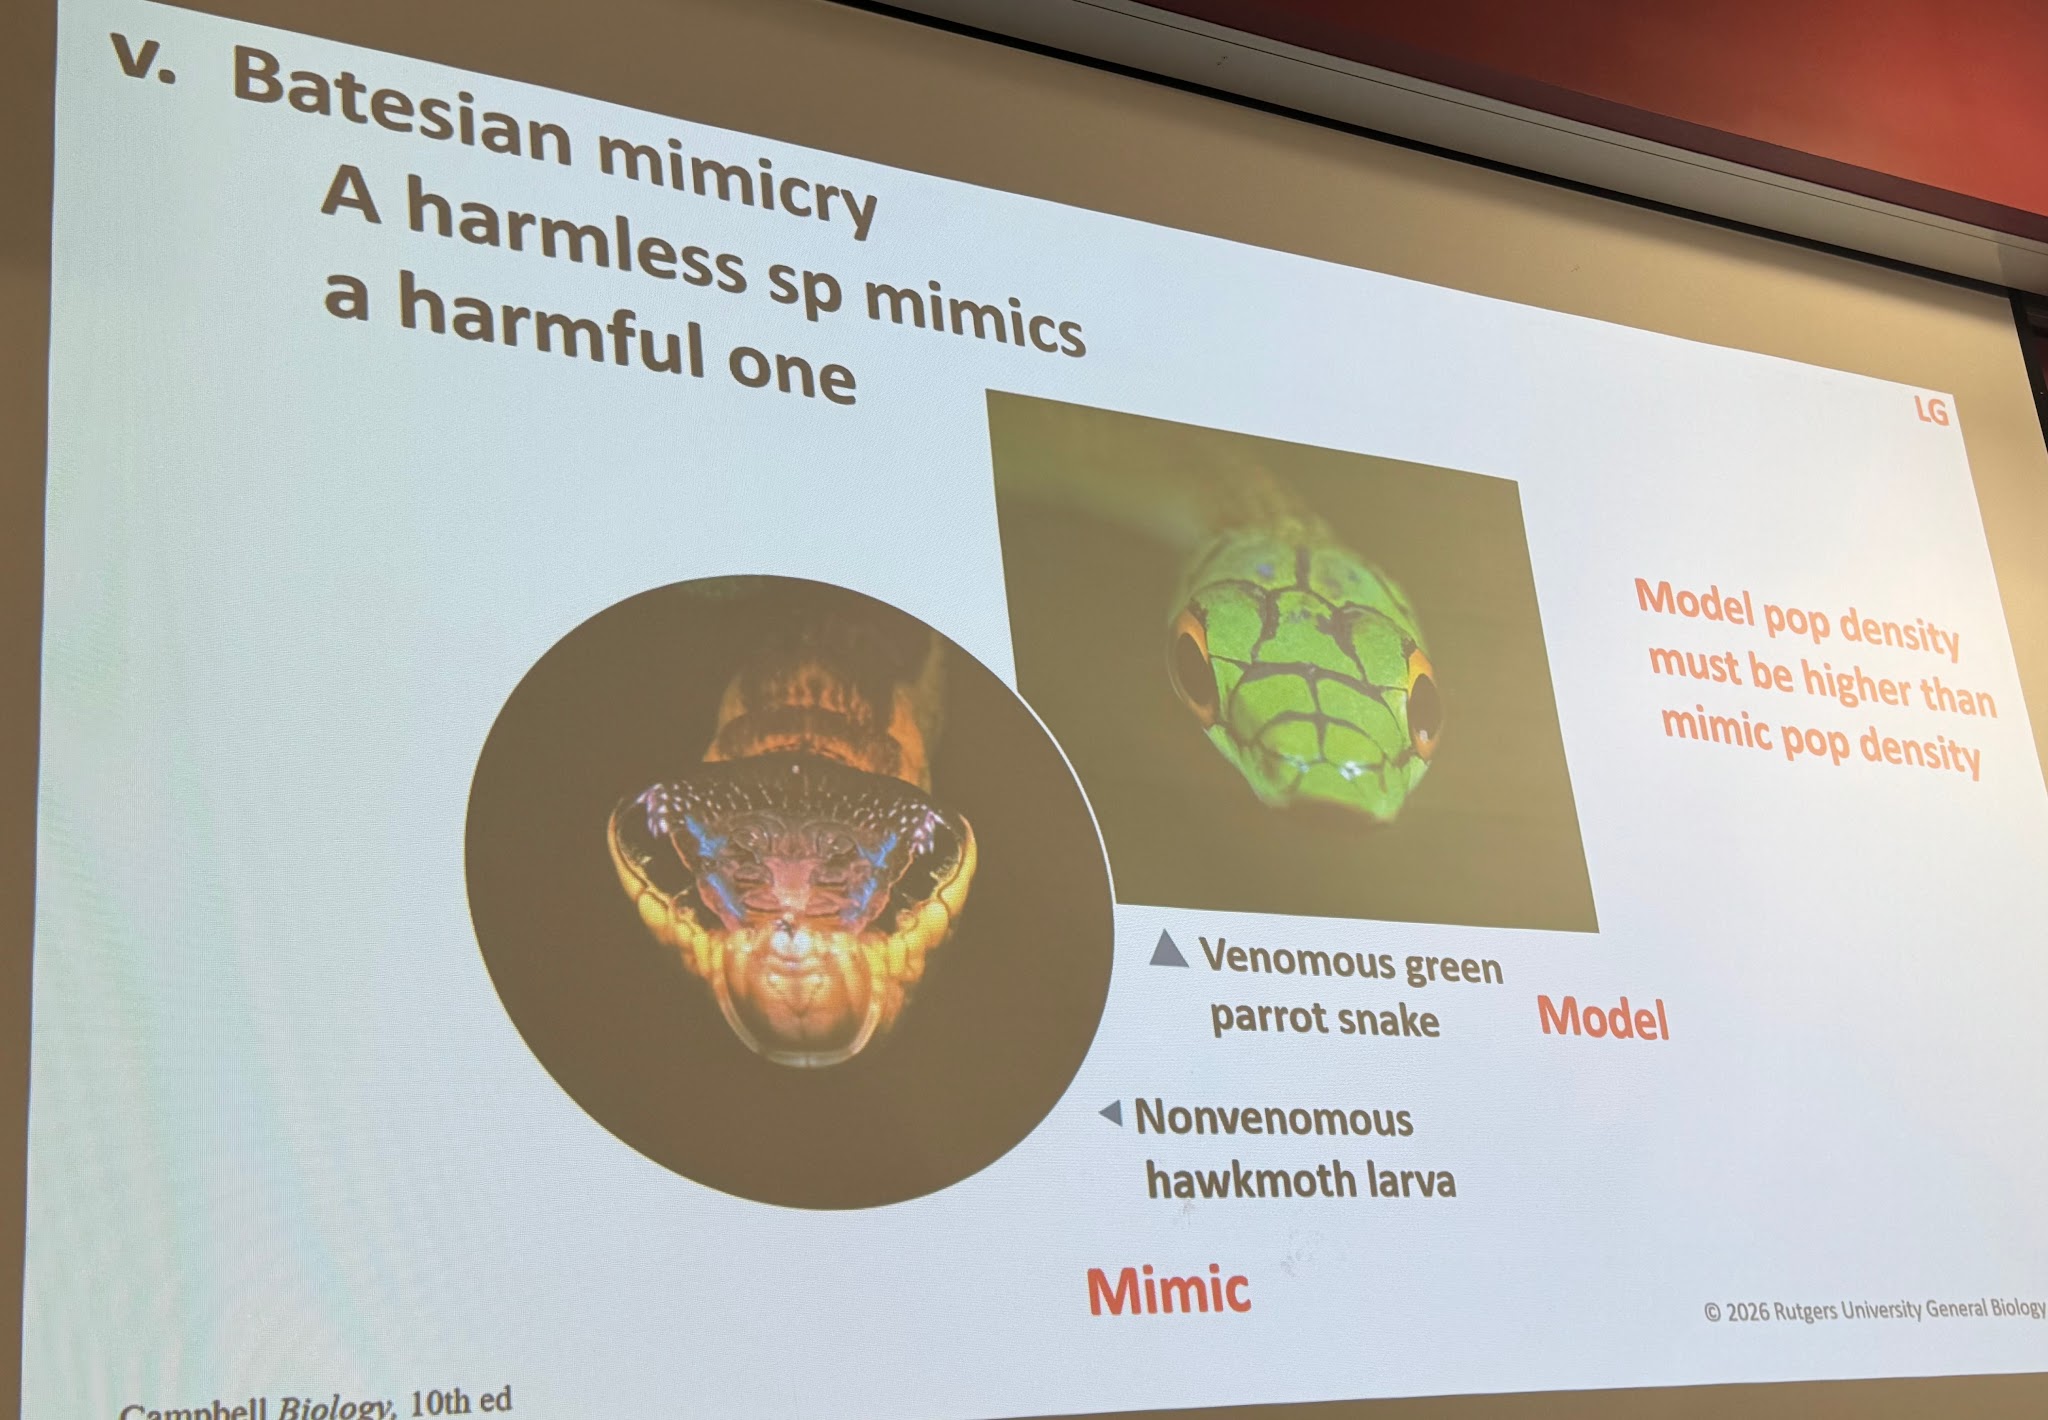
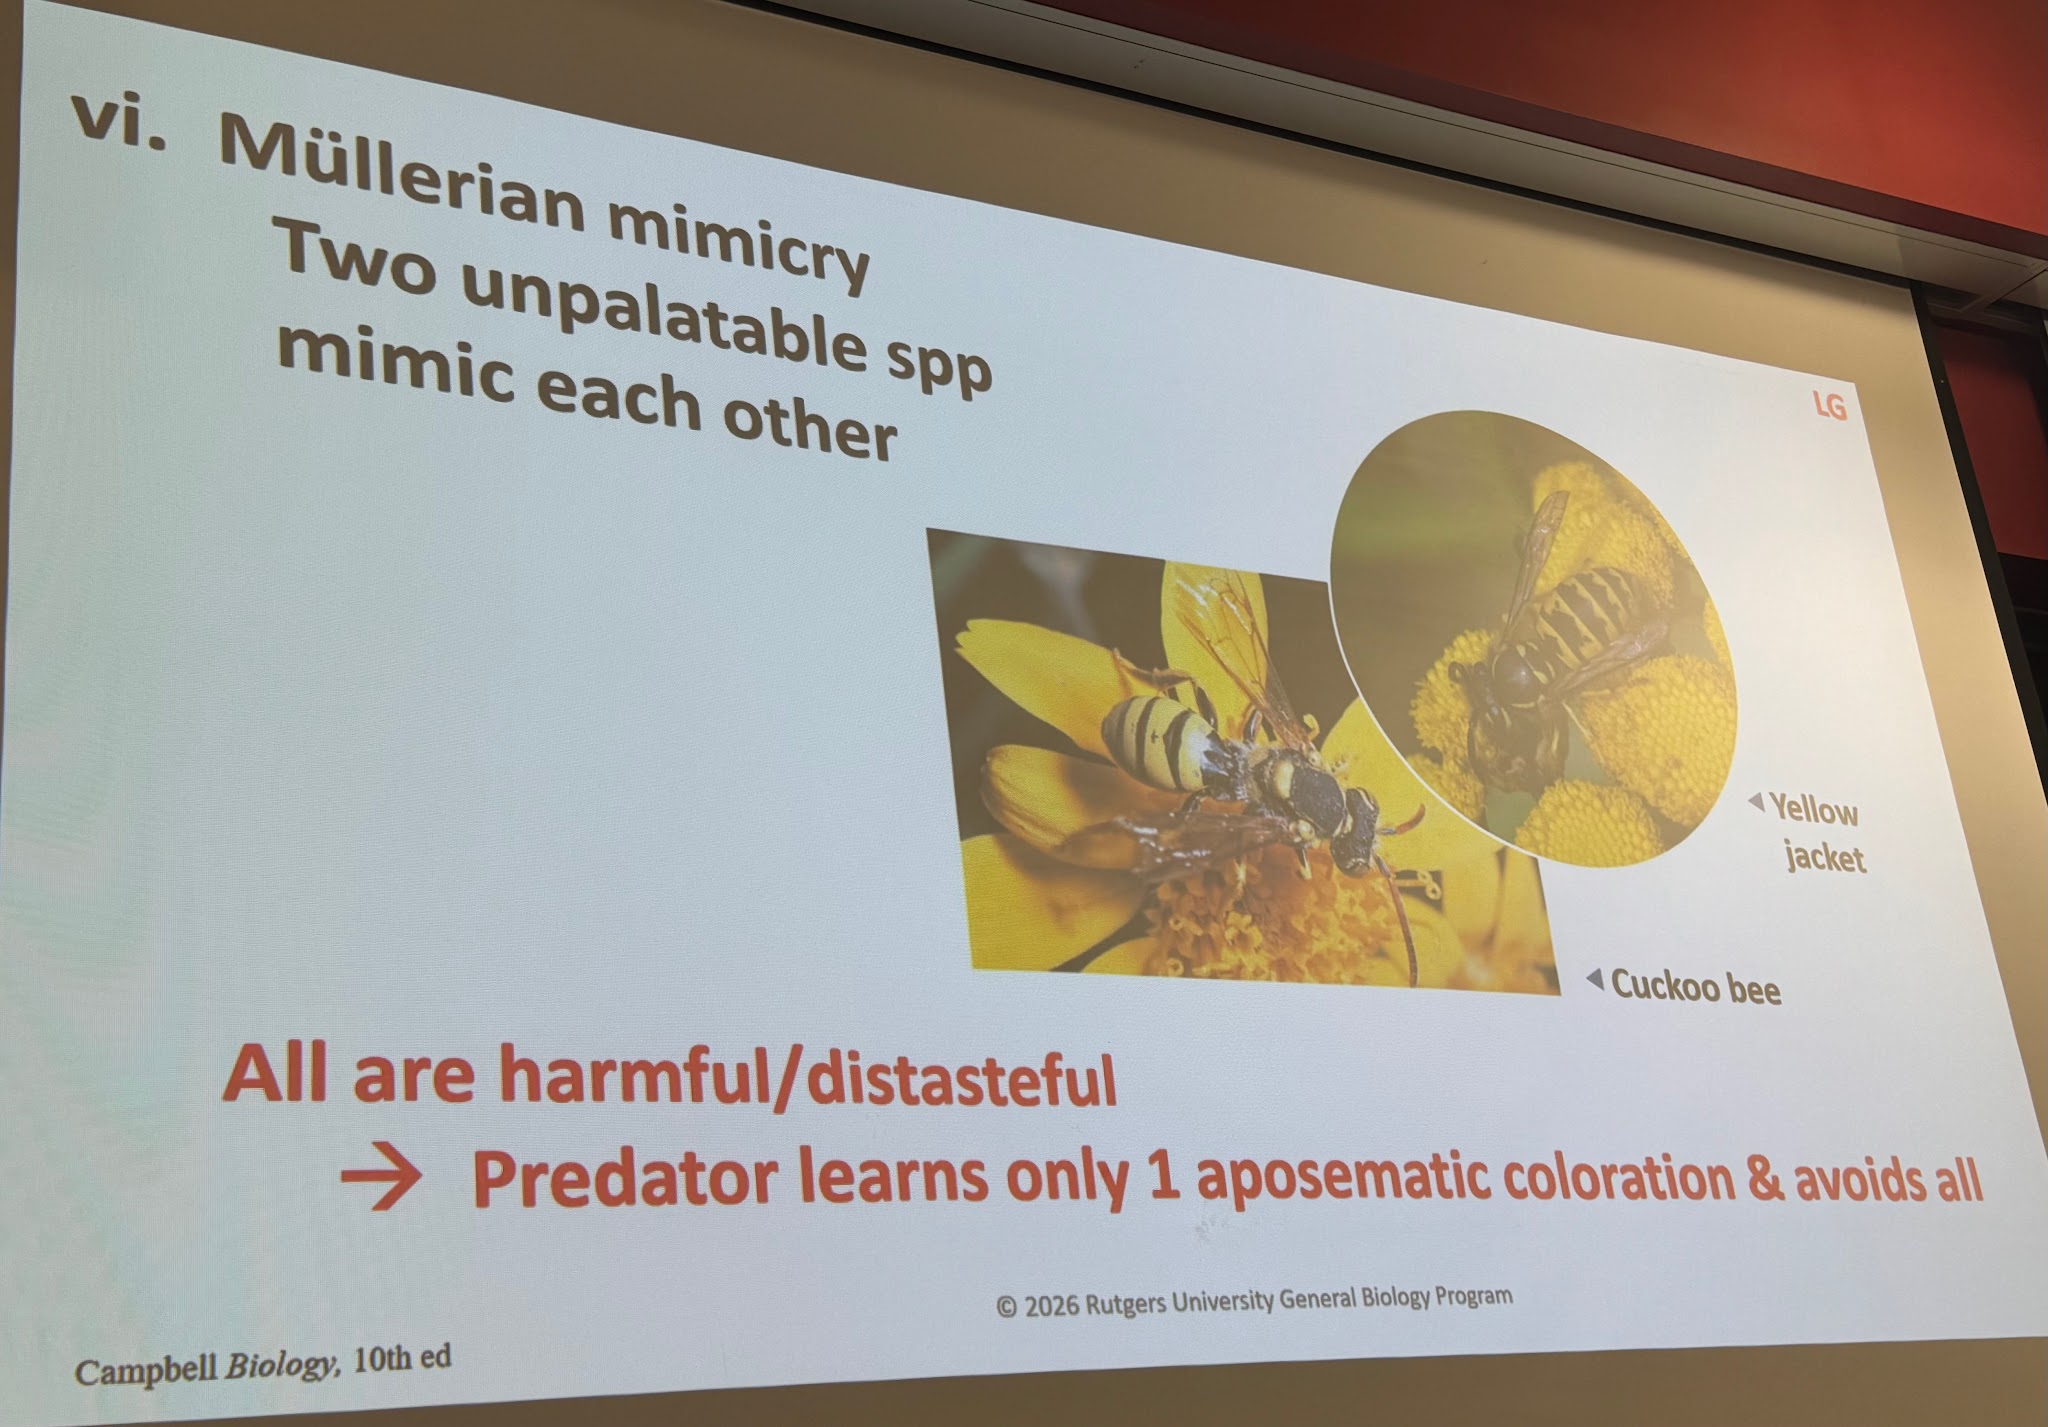
vii. Behavioral defences
Fleeing
Living in groups (Ex: herbs, school)
b. Plants
Herbivory +/-
Can’t escape predators
Adaptations to decrease chance of being eaten
Mechanical (Ex: spines, thorns)
Chemical (Ex: toxic to herbivores)
C. Symbiosis
Intimate, long-term relationship between 2 or more species
Usually involves one species living in or on the other
3 main forms of relationships
Parasitism (+/-)
- Parasite benefits and host can be harmed (rarely killed)
- Ex: heartworm in dog
Mutualism (+/+)
- Both partners benefit and each dependent on other
- Ex: Mycorrhizae
Fungi and roots of many plants
Roots provide organic molecules from photosynthesis
Fungi provide essential minerals from soil
Commensalism (+/0)
- one organism benefits and the other is neither harmed or helped
- Ex: Cattle egrets and african buffalo
II. Ecological Succession
Continuous process of community development over time
Changes in plant and animal species
Primary succession
Change in habitat not previously inhabited
Ex: New volcanic island
Bare rock: No organisms, no soil
1st organisms
Lichen (Mutualism between algae and fungi) & mosses
Break down rock and begin to form soil
Larger pants:
First grasses,
Then shrubs and trees
B. secondary succession
Existing community cleared by disturbance that leaves soil intact
Ex: Forest fire
Abandoned ag field